Best 10 Facebook Ads Report Templates in 2026 (Updated)

Setting up a Facebook Ads report can be very time-consuming and quite tedious. But with templates, you can easily account for all Facebook ad campaigns — allowing you to track KPIs, monitor performance metrics, and optimize future campaigns’ results.
So, if you need some Facebook Ads report templates, We’ve curated 10 best templates. But first, we give you a list of features to look out for before you use anyone.
What Should You Look for in a Facebook Ads Report Template?
An effective Facebook ads report template should offer customization options, be user-friendly, and provide data visualization features that make it easy to interpret campaign metrics.
Whether you're tracking CTR or conversion rates, the suitable template should also integrate real-time data to enhance the accuracy of your reports. Here are key features to look out for in a Facebook Ad report template.

Discover Facebook Ads templates
With Rows you import live Ads data, automate analysis with AI and build dashboards in minutes.
Explore Ads Reports1. Integration with your Facebook account
This is the first and foremost feature to look out for in a Facebook ad report template because, with integration, you'll be able to access (live) data into your template, and avoid tedious copy/paste or file handling.
For example, Rows integrates with 50+ live data sources, letting you build self-updating reports.
2. Modern User Interface
For some dashboard templates, WYSIWYG, however, some templates are underwhelming in terms of ease of use and interaction. A well-designed interface enhances usability and ensures that insights are easily accessible and understandable.
Rows adopts a document-like approach, which offers a tidy view of tables and charts that can be reordered easily with drag and drop. Plus you can embed each element into Notion, Confluence or other HTML-ready destinations.
3. AI capabilities
Opt for a template that’s easy to customize and designed to highlight actionable insights easily. Here, AI plays a major role, helping ingesting and transforming data and surfacing business insights.
With Rows AI Analyst, you can:
Ask to import data directly from your Ad account. See it in action here:
Transform data, like merging different tables or aggregating it across a new dimension. Watch it below:
Even build an entire report, ready for your clients:
Read more on how to use AI for marketing in our Vibe Analytics Guide for CMOs
What Are the Top Facebook Ads Report Templates in 2026?
From Facebook advertising reports to conversion discrepancy reports, many templates abound to help you make sense of all the campaigns you run. We have curated our Facebook ad templates, some of which are also conversion discrepancies report templates.
With Rows templates, you can pull live data from your Facebook account into your spreadsheets without coding or engineering.
Additionally, we have an AI-powered feature called the AI analyst, which can analyze, summarize, transform, and enrich your Facebook ad report analysis. The cherry on top is that you can quickly sort through your spreadsheet and access key metrics that drive informed decisions.
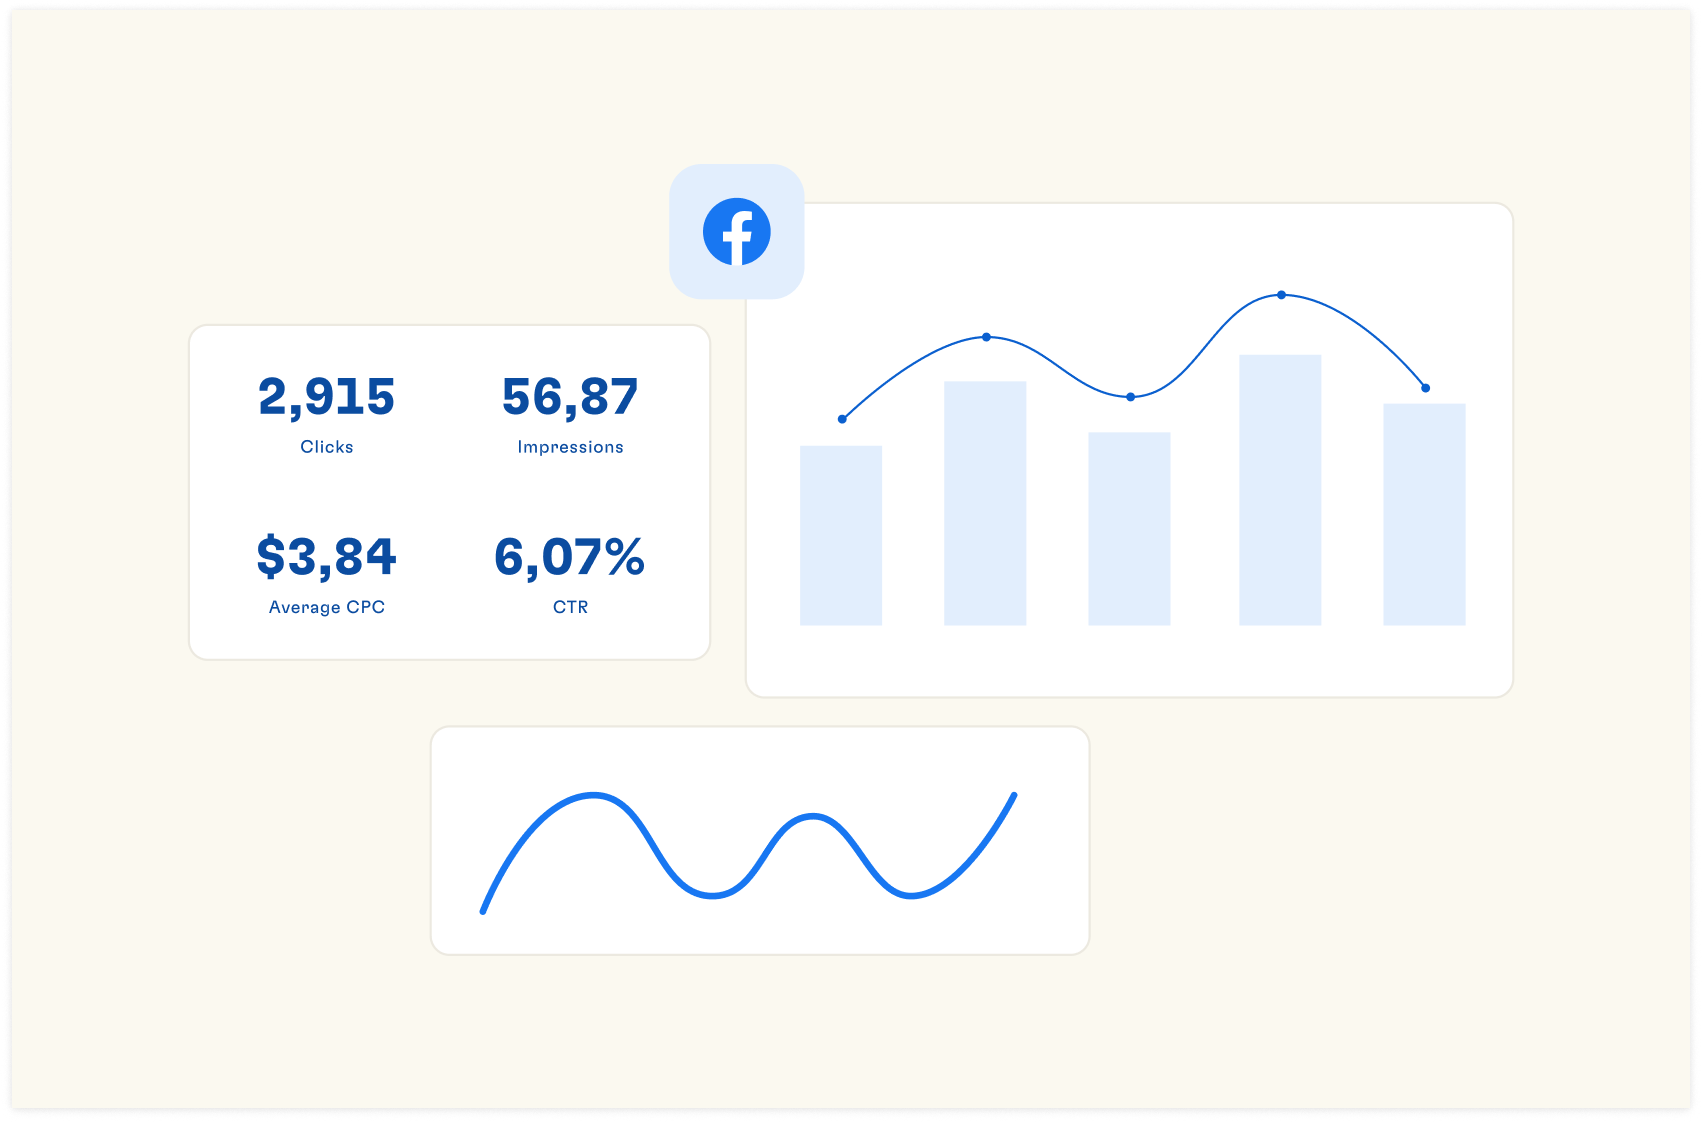
For example, with our template, you'll get a series of charts to measure metrics like the Average click-through rate. This metric is important as it is reported that the average click-through rate in Facebook ads for traffic campaigns across all industries is 1.57%. This is up from last year’s overall average of 1.51%. So, when you know what these metrics measure, you can easily spot KPIs.
Below are the curated templates:
1. Facebook ads campaign by Rows

Our Facebook ads campaign report template provides a detailed breakdown of your Facebook ads campaigns. It shows key performance indicators (KPIs) such as click-through rate (CTR), conversion rate, and return on ad spend (ROAS) to help you measure their success.
You can only find this data once you connect your Facebook account. Once your Facebook account is configured to your Rows account, your report template automatically illustrates your campaign performance summary, campaign objective breakdown, plus leads and purchases vs spend. To access the data, input your username and specify a date range.
Additionally, this template allows you to monitor audience demographics with detailed breakdowns of clicks by gender, age, country, and device.
Components of the template include:
Campaign performance summary: This table displays essential metrics like Clicks, CPC, CPM, CPA, CTR, Reach, Spend, Leads, Purchases, Cost per Order, Cost per Lead, and ROAS. It gives a comprehensive overview of each campaign's effectiveness and efficiency.
Campaign objective breakdown: This table shows Spend, Impressions, Leads, Purchases, and Cost per Order for different campaign objectives. It helps users understand how well each objective performs and allocate budget accordingly.
Leads and Purchases Vs. Spend chart: This visualization compares the number of leads and purchases against ad spending over time. It helps identify trends and the relationship between investment and results.
Clicks and spend by publisher chart: This chart shows clicks, cost per click, and cost per lead across different publishers. It helps optimize ad placement by identifying which platforms deliver the best results.
Spend by Objective chart: This bar chart visualizes budget allocation across different campaign objectives, allowing users to assess where their money is being invested quickly.
Weekly Spend by Objective: This chart tracks spending by objective over time, helping identify seasonal trends or changes in strategy effectiveness.
Daily summary: This table provides a day-by-day breakdown of key metrics like Impressions, Spend, Leads, Purchases, Cost per Order, and Cost per Lead. It helps identify specific days or periods of high or low performance.
2. Instagram ads campaign report by Rows

This template is designed to provide detailed insights into your Instagram advertising performance. It will help you understand how your Instagram ads have been performing and optimize your campaigns. You'll have all the necessary information, with sections dedicated to weekly performance summaries, campaign performance summaries, and objective breakdowns.
Our Instagram Ads Campaign Report Template includes the following:
Weekly Performance Summary: Track your weekly ad metrics such as Impressions, Spend, Leads, Purchases, Cost per Lead, and Cost per Order.
Campaign Performance Summary: Dive deeper into your campaigns with detailed metrics, including Campaign Name, Clicks, CPC, CPM, CPP, CTR, Reach, Spend, Leads, Purchases, Cost per Order, Cost per Lead, and ROAS.
Campaign Objective Breakdown: Understand the distribution of spending by objective.
Leads and Purchases vs. Spend Chart: Visualize the correlation between your spending and the results achieved.
Weekly Spend by Objective: Monitor how your budget is allocated across different objectives weekly.
4. Facebook ads conversions discrepancies Report by Rows

The Facebook Ads Conversion Discrepancies Report template is a powerful tool for marketers and data analysts to streamline advertising performance analysis. This dashboard compares the conversion data from your ad channels (Facebook Ads) with the conversions tracked by Google Analytics 4. By identifying discrepancies between these platforms, you can make data-driven decisions to enhance your marketing strategies and boost your ROI.
Components of the template include:
Google Analytics UTM Tracking: To start, input the UTMs you use for your Facebook Ads campaigns into the provided table. This will ensure accurate tracking and comparison of your ad performance data.
GA4 Conversion Event Naming: Next, specify the name of the conversion event as it is defined in your Google Analytics 4 account. This step is crucial for aligning the data from your ad channels with the data reported by GA4.
Discrepancy Analysis Report: This template's core component is the discrepancy report. Pick a date range for the analysis and get a report that measures and displays the discrepancies between conversions reported by your ad channels and those attributed by GA4.
Once your accounts are connected, the template will automatically fetch the necessary data and generate a discrepancy report. This automated process saves time and reduces the risk of manual errors.
4. Facebook Posts Report by Rows

Monitoring and analyzing Facebook pages' performance is essential to effectively leveraging them for advertising. However, monitoring the performance of your Facebook activity can be challenging. Navigating the official Facebook metrics platform is not intuitive, and the automatic alternatives are often expensive and complex to configure. That's why many people do it manually, exporting data into different spreadsheets and analyzing it inefficiently.
This Facebook Page Insights Report provides detailed metrics that help you understand how your audience interacts with your content. By analyzing these insights, you can make data-driven decisions to improve your social media strategy, enhance engagement, and achieve your marketing goals.
Below are some of the key metrics on the Facebook post report template.
Page Summary: This section displays key metrics like page views, new page likes, total reach, and post engagements, giving a quick snapshot of overall page performance.
Post Overview: This section shows post-engagement metrics, including comments, reactions, and shares. It helps identify which types of content resonate most with the audience.
Weekly reach by type: Bar chart displaying different kinds of reach (organic, paid, viral) over time. This visualization helps track the effectiveness of various content distribution methods.
Weekly engagement: Line graph showing engagement trends over time. It helps identify peaks in audience interaction and correlate them with specific content or campaigns.
Weekly negative feedback trend: Line graph tracking negative feedback over time. This helps monitor audience sentiment and quickly address any issues that may arise.
Followers over time period: This is a line graph showing follower growth. This metric is crucial for understanding audience expansion and the effectiveness of follower acquisition strategies.
Total reactions across top posts: Bar chart displaying the distribution of different reaction types (like, love, wow, etc.) across top-performing posts. This provides insights into emotional responses to content.
Top 10 Posts by Engagement: A table listing the most engaging posts and their performance metrics. This helps identify successful content themes and formats to inform future content strategy.
Top 10 Most Viral Posts: Similar to the above, but focusing on posts that generated the most shares and viral reach. This can guide strategies for creating shareable, viral content.
Comments growth over time period: This table shows the increase in comments over time. This metric is valuable for assessing audience interaction and conversation-sparking content.
5. Instagram page analytics dashboard

Before you consider running ads on your Instagram page, analyze the engagement rate. This Instagram Page Analytics dashboard can unlock deep insights into your page performance. This comprehensive template provides full data from the last 30 days, empowering you with detailed analytics and visualizations to optimize your social media strategy.
When you access these insights, you'll be better informed on actionable strategies to execute in your next Instagram advertising campaign. So, say you analyze your page and find that American citizens engage with your content more. This hints that America should be a target demographic, and then next time, you should run an advert.
The Instagram Page Analytics Dashboard includes the following main components:
Daily Performance Charts: Track your Instagram growth with daily charts showing impressions and new followers. Understand how your content resonates with your audience and adjust your strategy accordingly.
Engagement Over Time: Monitor overall page engagement through a dynamic chart that includes email contacts, profile views, text message clicks, and website clicks. This helps you pinpoint peak interaction times and refine your engagement tactics.
Post Insights: Gain a summary of your last posts, detailing impressions, comments, likes, and new followers. Stay informed about which posts drive the most engagement and which need improvement.
Top Performing Posts: Identify your most impactful content with a table showcasing the top 5 most liked posts. Leverage this information to replicate successful content strategies.
Recent Posts: A table of your five most recent posts keeps you updated and lets you track their performance in real time.
Demographics Breakdown: Detailed demographics, including age, gender, country, and city breakdowns, will help you better understand your audience and tailor your content to meet their preferences.
Post Performance Chart: Analyze individual post performance to see how each piece of content contributes to your overall growth and engagement.
Discover Facebook Ads templates
With Rows you import live Ads data, automate analysis with AI and build dashboards in minutes.
Explore Ads Reports
6. Facebook Ad Campaign for eCommerce Dashboard Template by Databox

If you run eCommerce ads on Facebook, then you need this template. While other templates offer a versatile overview of any Facebook Ad campaign, this one is built specifically for eCommerce.
With this template, you can measure the effectiveness of your ad campaign in generating revenue for your eCommerce business. In addition, you can see how much revenue your eCommerce business gets back for each dollar spent on advertising.
➡️ Download this template now!
7. Whatagraph Facebook Ad template

This template is similar to some of the above-listed templates. However, it comes with some advanced automation — automatically sending updated reports to team members. This Facebook Ads report template transforms data from Facebook Ads Manager into clear visualizations and actionable information by displaying metrics that matter and highlighting your agency’s expertise.
➡️ Download this template now!
8. Facebook Ads lead generation report template by Porter metrics

Not all Facebook advertising campaigns serve the same purpose. This template lets you explore everything you need to acquire leads in your Facebook Ads campaigns. You
Some generate leads; others compel buyers to purchase immediately. This template only works on Google Looker Studio.
➡️ Download this template here!
9. Facebook Ads Eight Weeks Performance Analysis by Two Minutes Report

Want to access a drilldown of your Facebook ads' performance over a specific period of time, say, two months? Then, this template will be helpful. It is an interactive dashboard that facilitates easy comparison and contrast of performances every week, rounding up to eight weeks.
➡️ Download this template here!
10. Facebook Ads high-level monthly reporting template

This Google Sheets report template built by Supermetrics starts with your high-level insights and then goes deeper with more detailed views. It covers everything, whether you want to examine specific demographics, detailed figures, or a campaign overview.
➡️ Download this template now!
Discover Facebook Ads templates
With Rows you import live Ads data, automate analysis with AI and build dashboards in minutes.
Explore Ads ReportsDo more with Data in less time: Use Rows Templates
By selecting the right template based on your specific goals, you can streamline your reporting process and make data-driven decisions that enhance your marketing success.
Rows templates are created so you can easily manipulate data, aggregate data without using long and complex formulas, and create and customize charts easily on one dashboard — Don't let a large pool of advertising data overwhelm your team.
With Rows, data comes to life. And the sweet part is that we have an AI analyst to do the trench work for you. If you or your team don’t have the time to try every product on our list, go to Rows.com, import data, automate your report, and see if it's the right match!