How to Check Instagram Analytics: Free Template for 2025


You're creating Instagram reels and carousels every now and then, using all the right hashtags, and running some ads and influencer campaigns. But how do you know if your Instagram strategy is really working?
The answer lies in your analytics. There are two options to check Instagram analytics these days:
Through Instagram native analytics — which is called “Instagram insights”.
Through social media analytics tools or third-party analytics tools.
Many Instagram business owners opt for option A because it's quick to find, but it can be a downside in the long run because of the following reasons —
No competitor insights: Instagram's analytics only shows your data. External tools let you benchmark against competitors and analyze their strategies.
Limited reporting: Instagram's reports are basic and hard to manipulate. More than often, you find yourself exporting data to a spreadsheet to run a quick analysis or plot some data on a line chart. External tools offer advanced reporting features, including flexible dashboards and charts .
Just analytics: Instagram focuses on analysis only. External tools often include scheduling, automation, and social listening to streamline your workflow.
And who says you can't use both options? Yes, you can. But leave it to us to walk you through everything you need to know about checking your Instagram analytics in 2025.
In addition, we are offering you a free template you can use to upgrade your Instagram analysis process.

A modern, flexible dashboard for Instagram data
Rows lets you sync your Instagram data, manipulate and visualize it with the ease of a spreadsheet.
Try it now (it's free)How to Use Rows to Check Instagram Analytics?
Now, you know how to check your Instagram analytics on the mobile app. The next step is to learn how to use Rows to check Instagram analytics.
At Rows, we are focused on going the extra mile with our spreadsheet service deliverables by providing data tracking tools and dashboards for business owners, creators, and marketers.
Our Instagram page analytics template is a comprehensive tracking tool for discovering key insights about your Instagram page and posts, such as engagement, impressions, and followers growth.
As I mentioned earlier — While Instagram’s native analytics are helpful, Rows Instagram page analytics tools offer advanced insights such as:
Competitor benchmarking: With our Instagram page analytics template, we can compare your competitors' page analyses. Instagram native analytics does not offer this because the “insights” page is for you only.
In-depth reporting, enabling you to go beyond the basics: With Rows Instagram page analytics dashboard template, you can create eye-catching and customized reports that can be shared easily with your social media management team or clients.
Advanced automation: Our template can automatically sift through your Instagram and pull live data into your spreadsheet — say you want to record the number of followers you get weekly; you can do that on Rows just by scheduling data refreshes on the followers’ trend chart
Now, let's get into how to use this template to check your analytics:
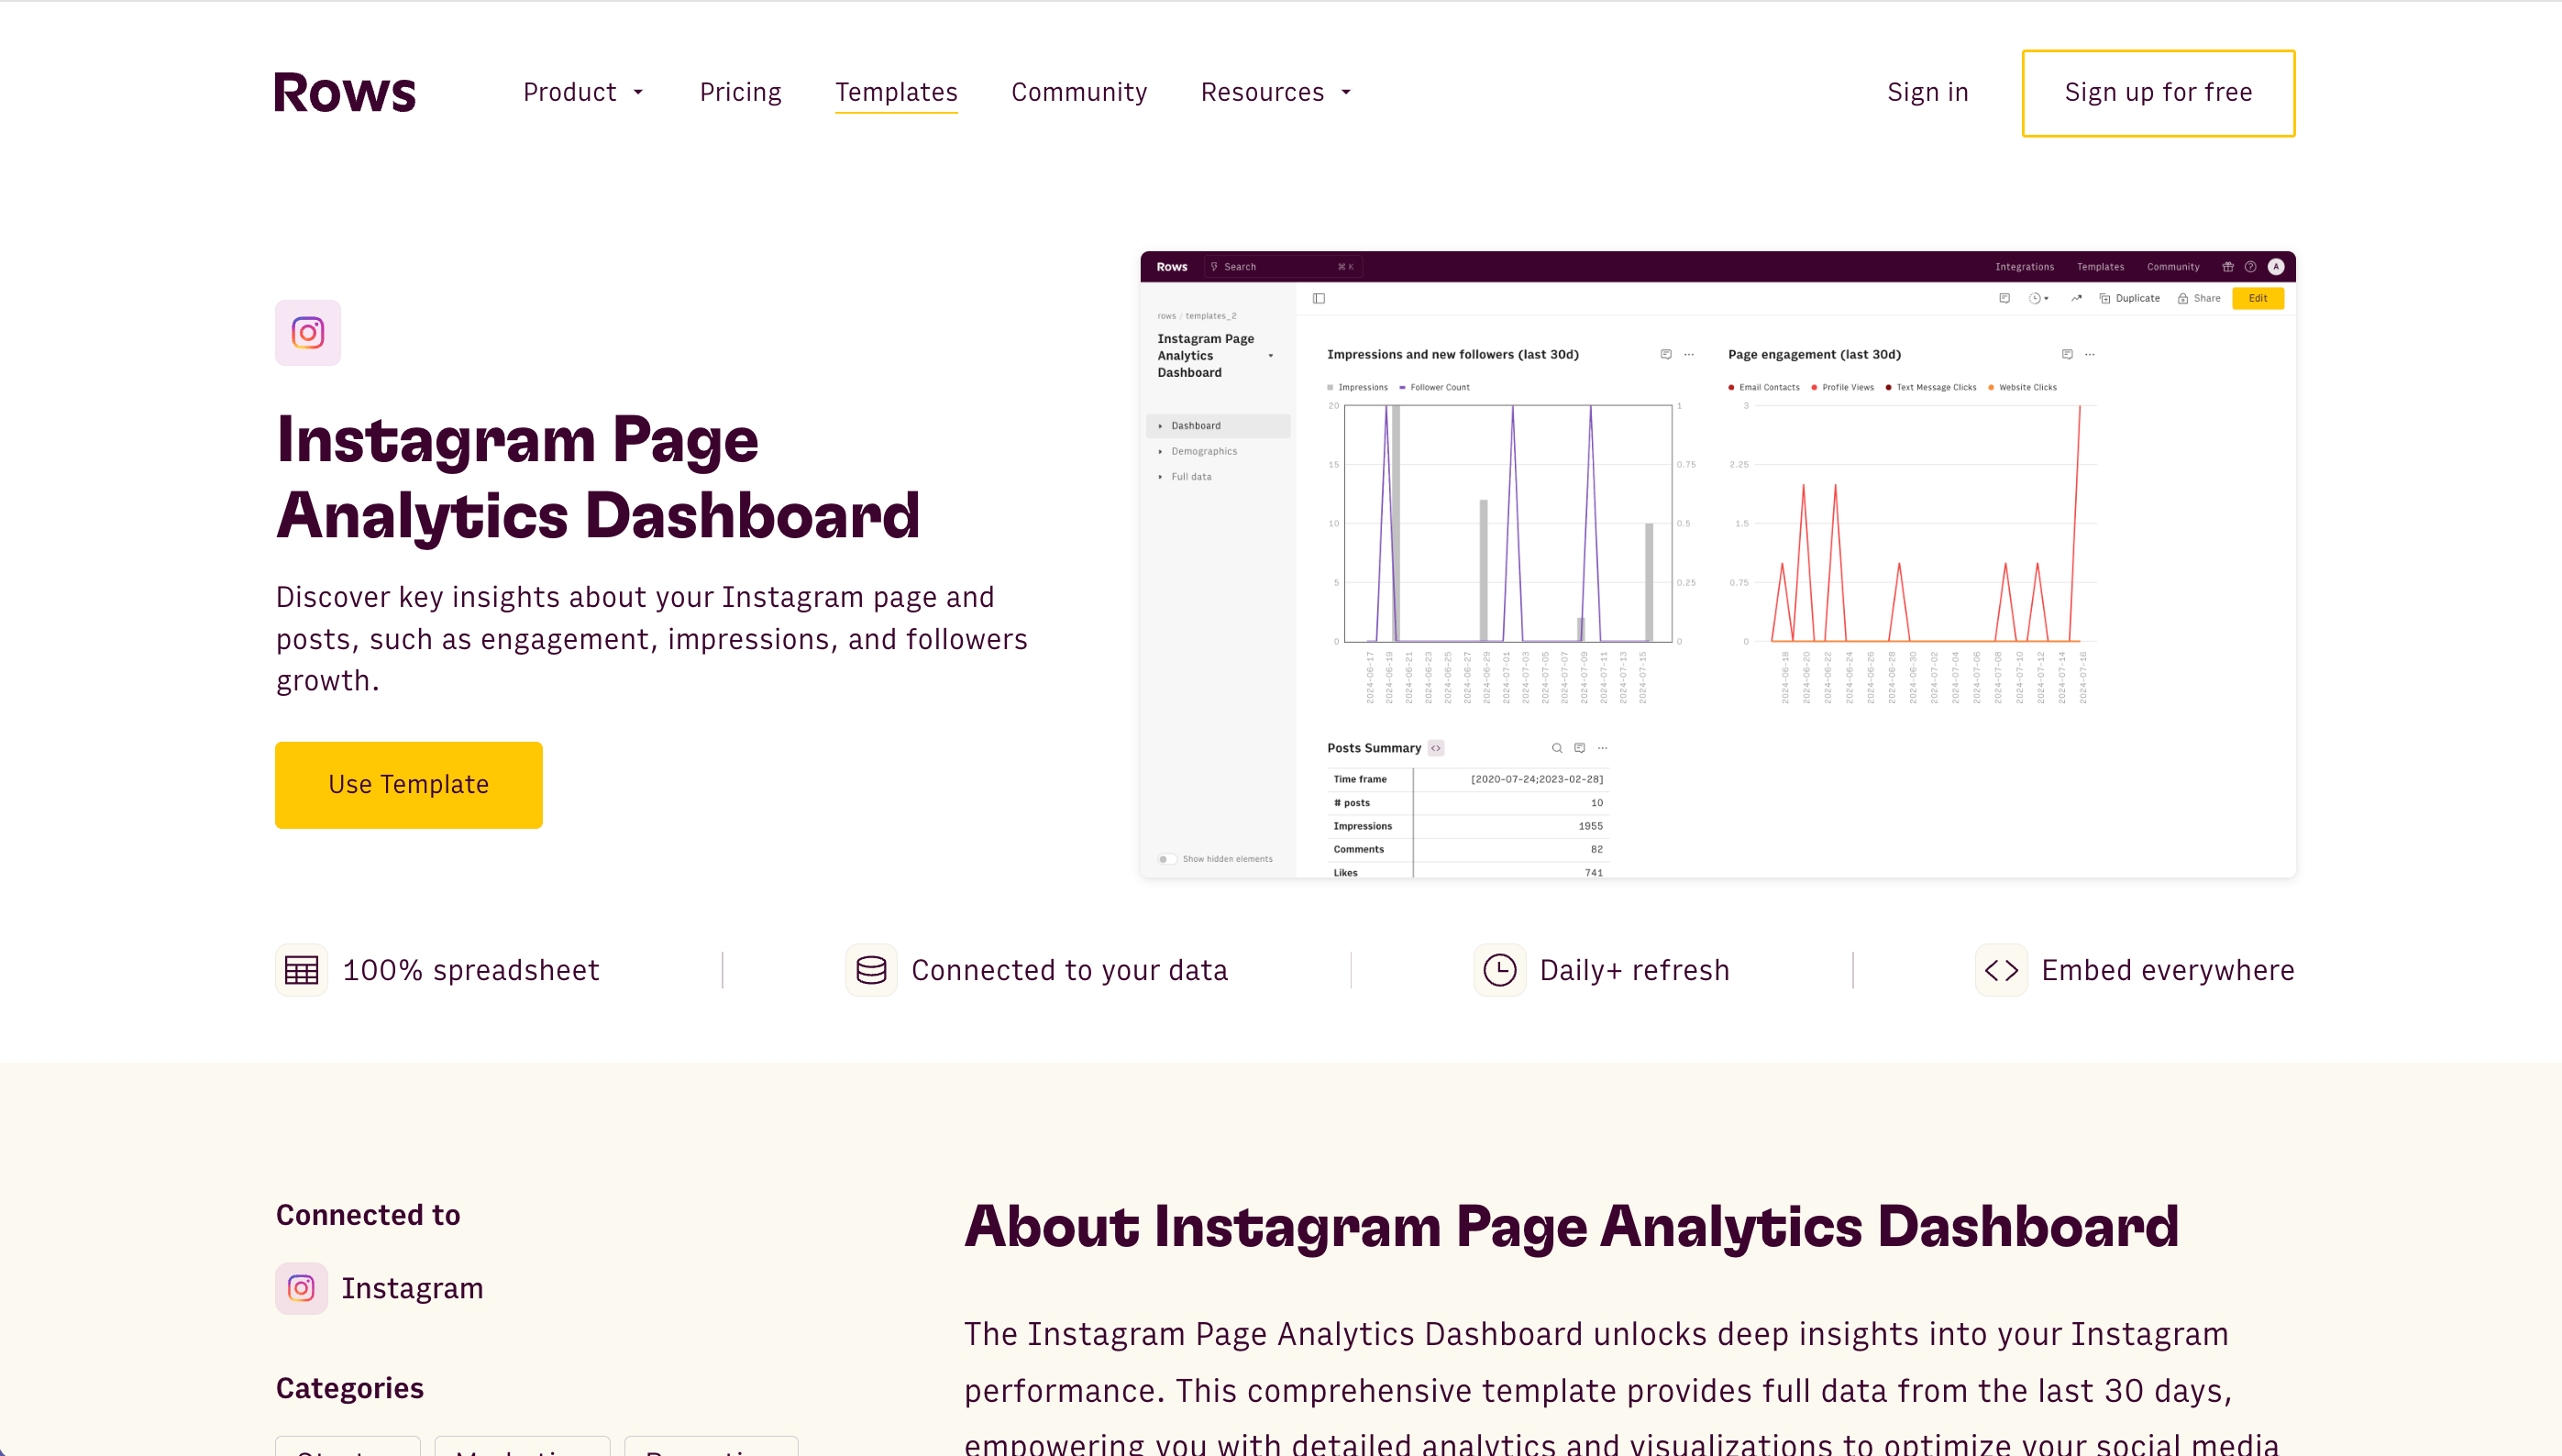
Step 1: Visit the Instagram page analytics Template page
Once done, click on “use template.”
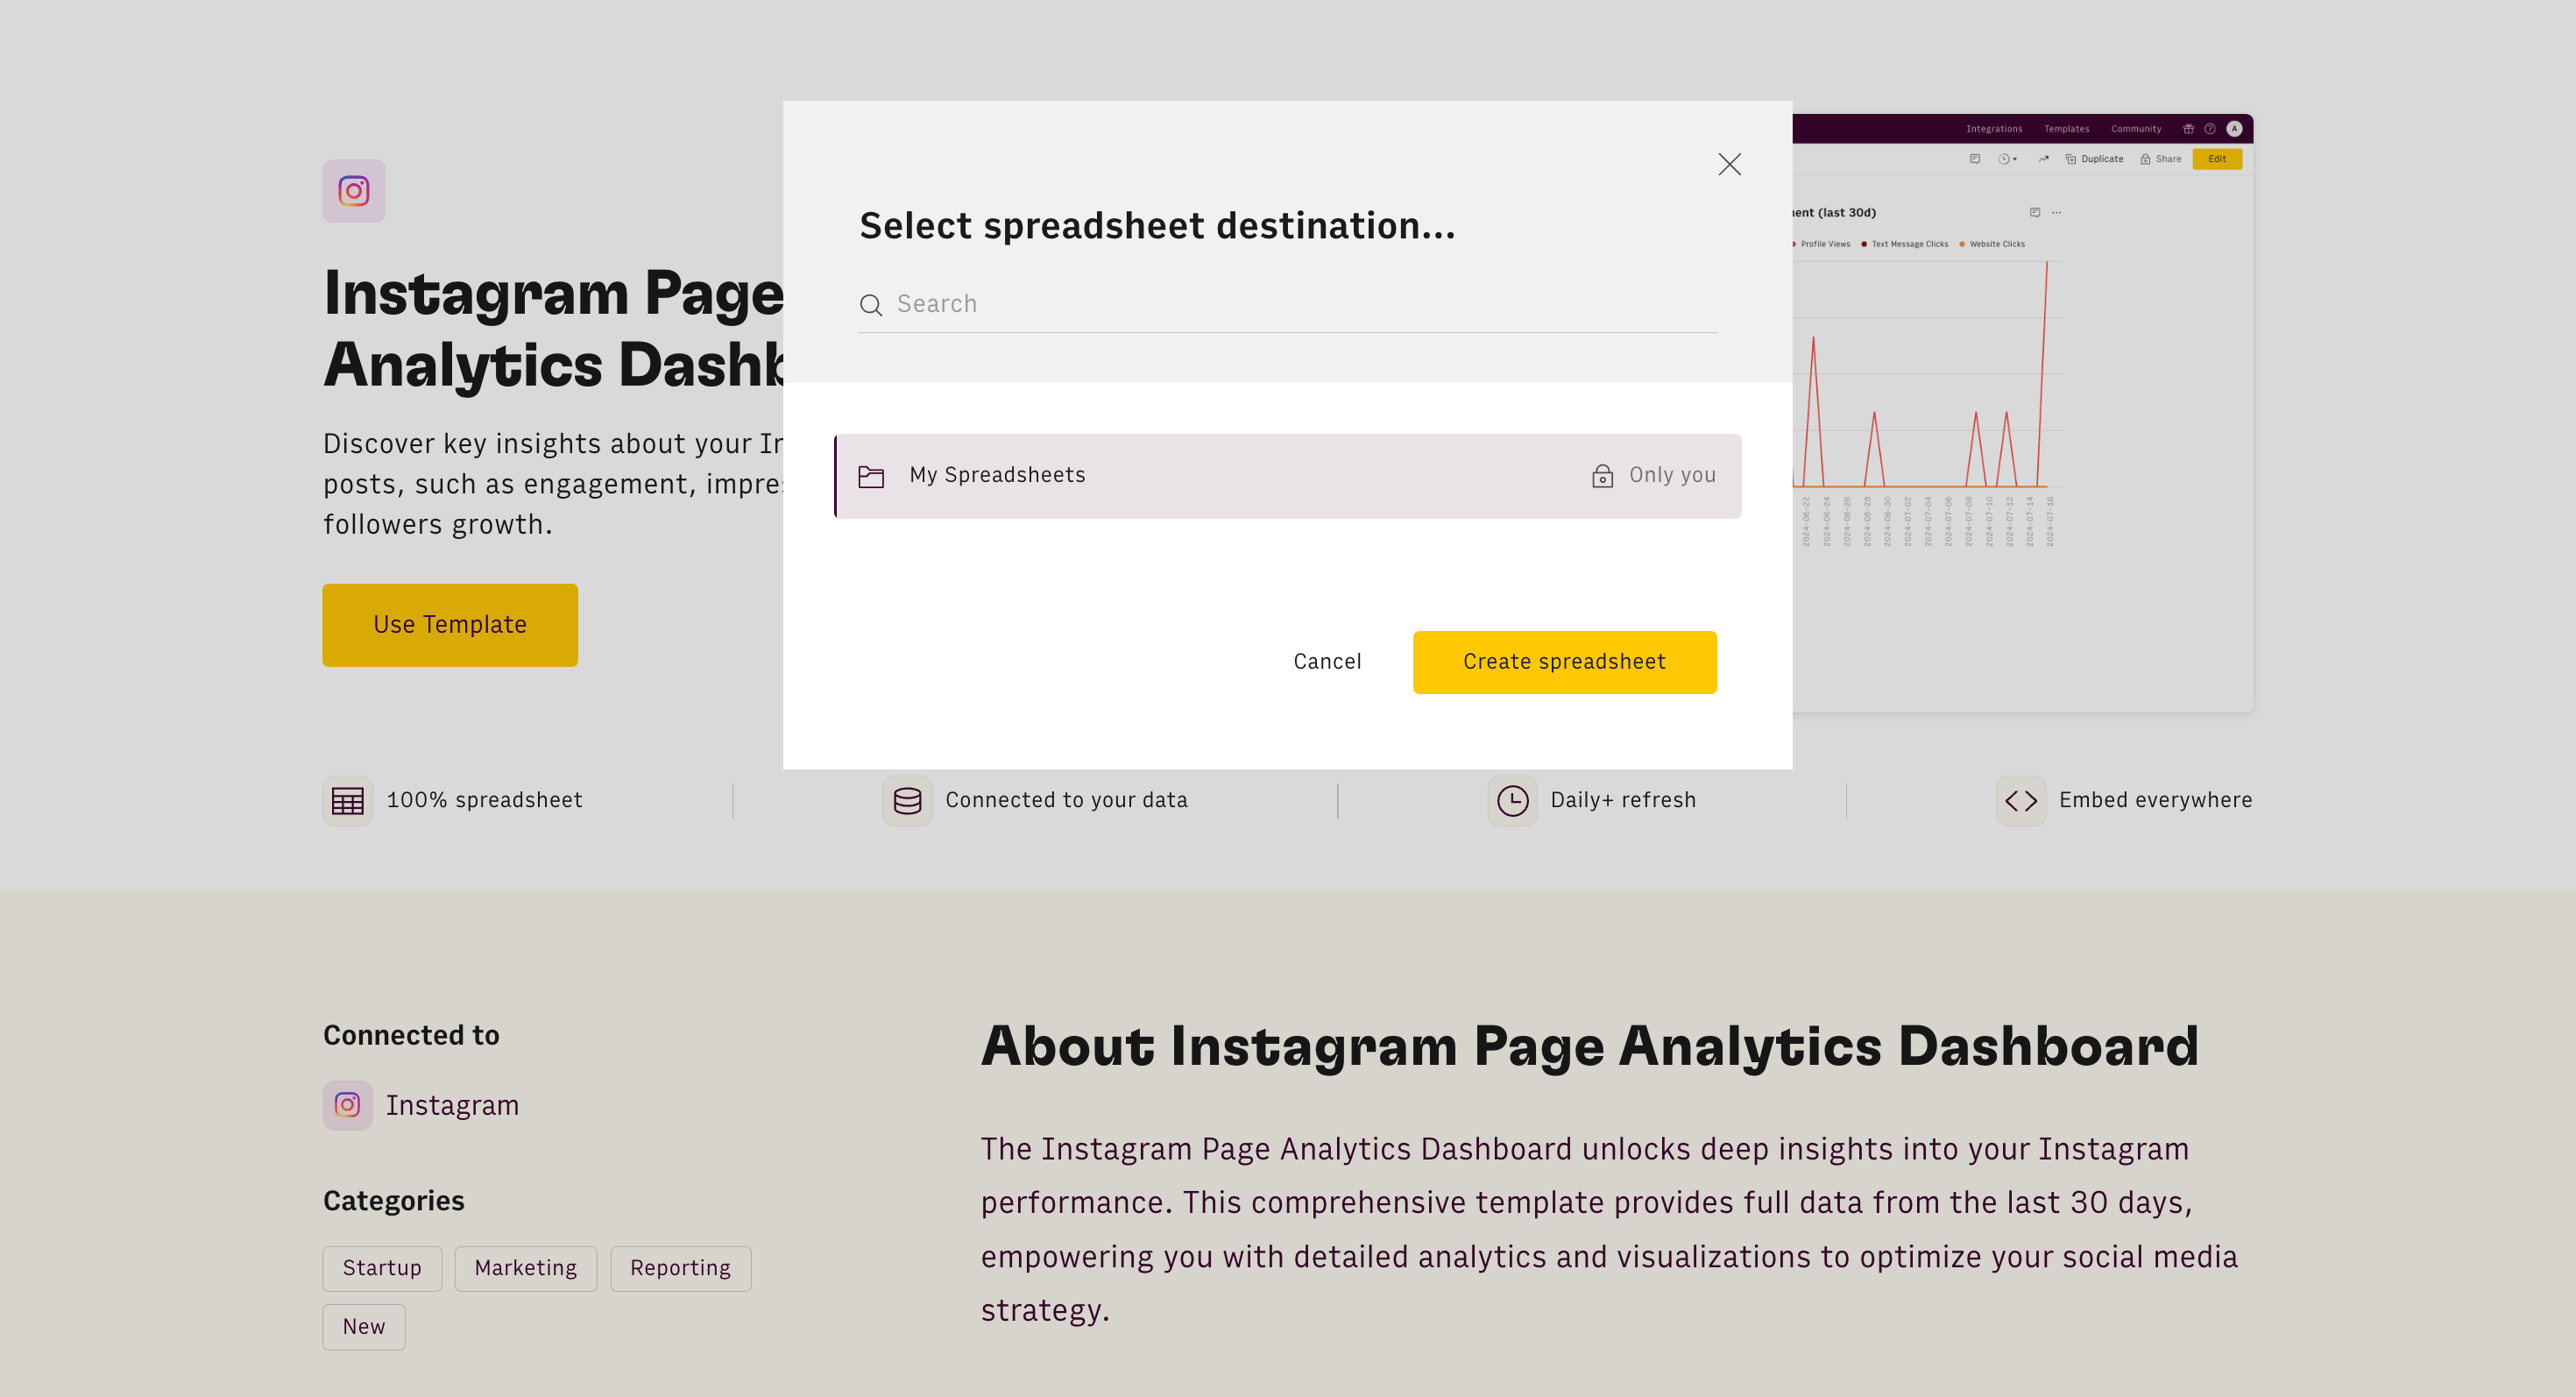
Step 2: Click ‘’create spreadsheet’’
This simply means creating a new workspace for your analytics workflow.
Step 3: Configure your Instagram account to Rows
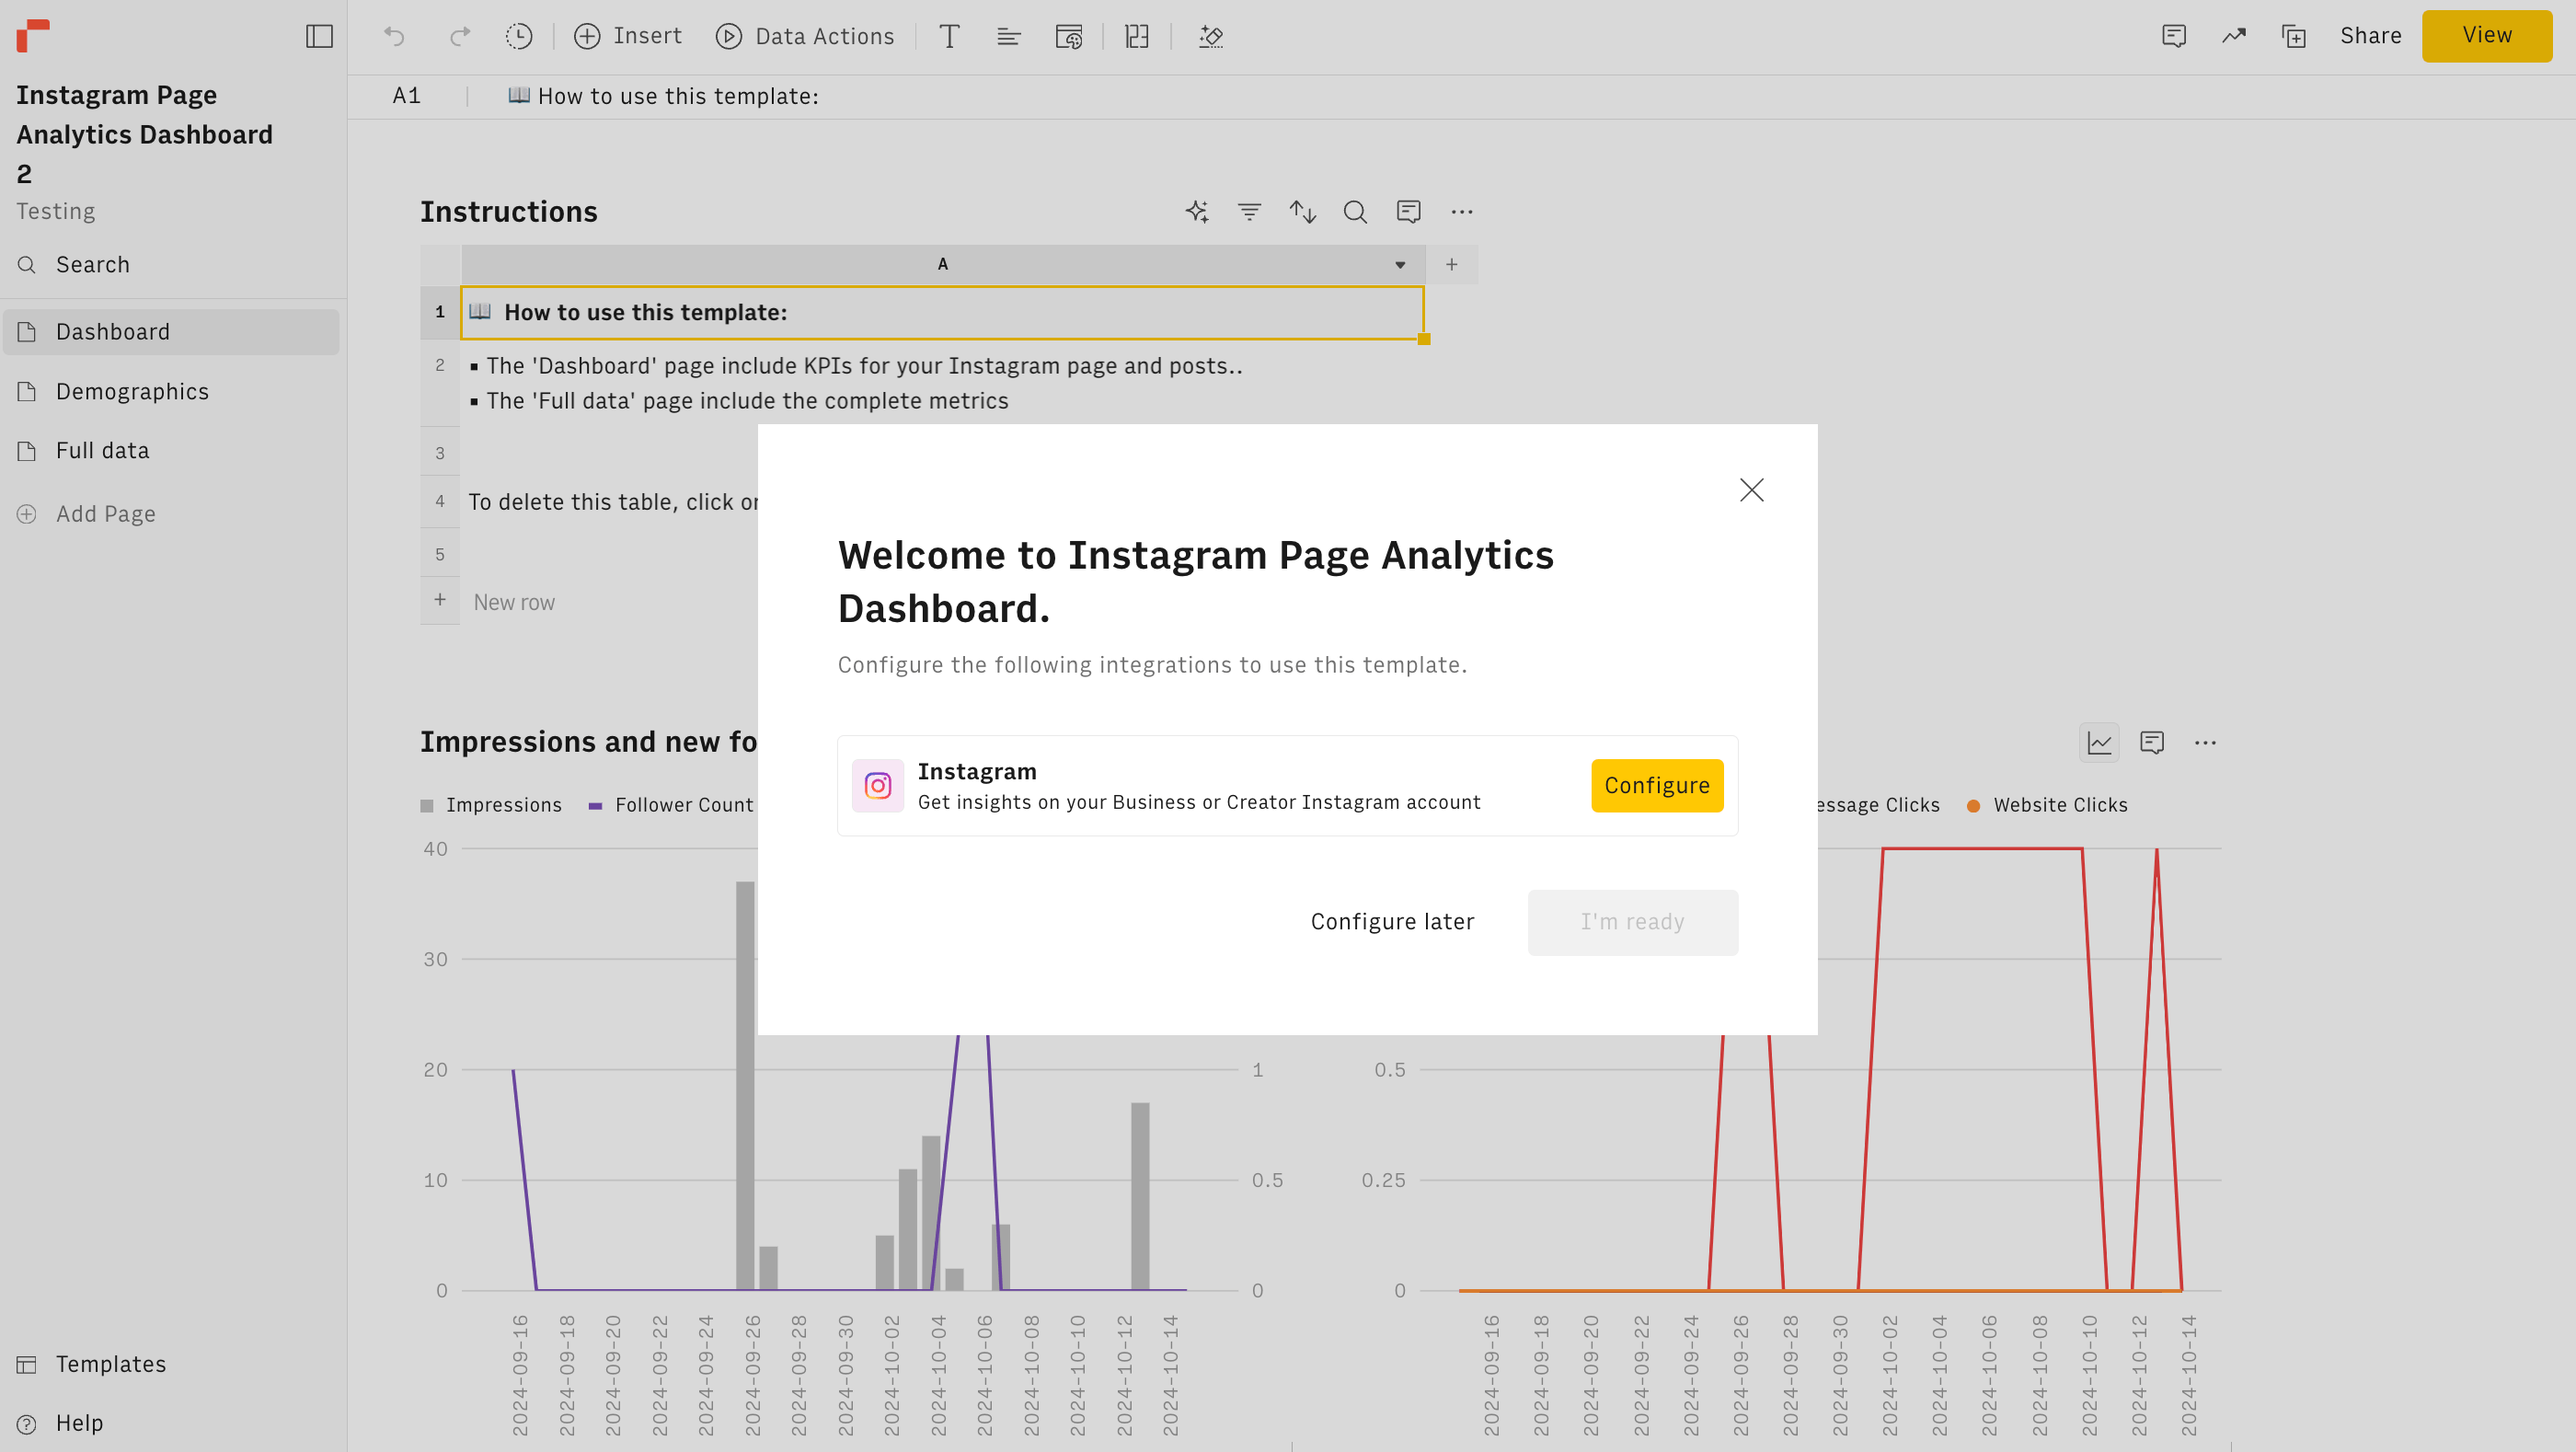
To access data from Instagram, you have to connect your Instagram account to Rows. So, click on “configure”. It doesn't require coding.
It can be a business or creator account— regular accounts are not supported.
An Instagram Creator account is designed specifically for influencers, public figures, content creators, and other professionals looking to grow and manage their presence on the platform. This type of account offers a range of tools that provide insights into follower demographics, content performance, and engagement trends, allowing creators to make data-driven decisions to optimize their content.
💡 If you have a regular account and you want to switch to an Instagram creator account, follow the steps below.
1. Open the Instagram app, go to your profile, and tap on the three horizontal lines in the upper right corner to access Settings 2. In Settings, select "Account" and then tap "Switch to Professional Account." 3. Choose the "Creator" option for tailored analytics and tools designed for influencers and content creators 4. Customize your profile by selecting a relevant category, like Blogger or Artist, and connect to your Facebook page if needed. 5. Once set up, you’ll have access to insights on followers, posts, and audience behaviour to help track and grow your influence.
There are three major data categories in our Instagram page analytics tool
The dashboard view
This shows a comprehensive overview of metrics through charts and spreadsheet tables.
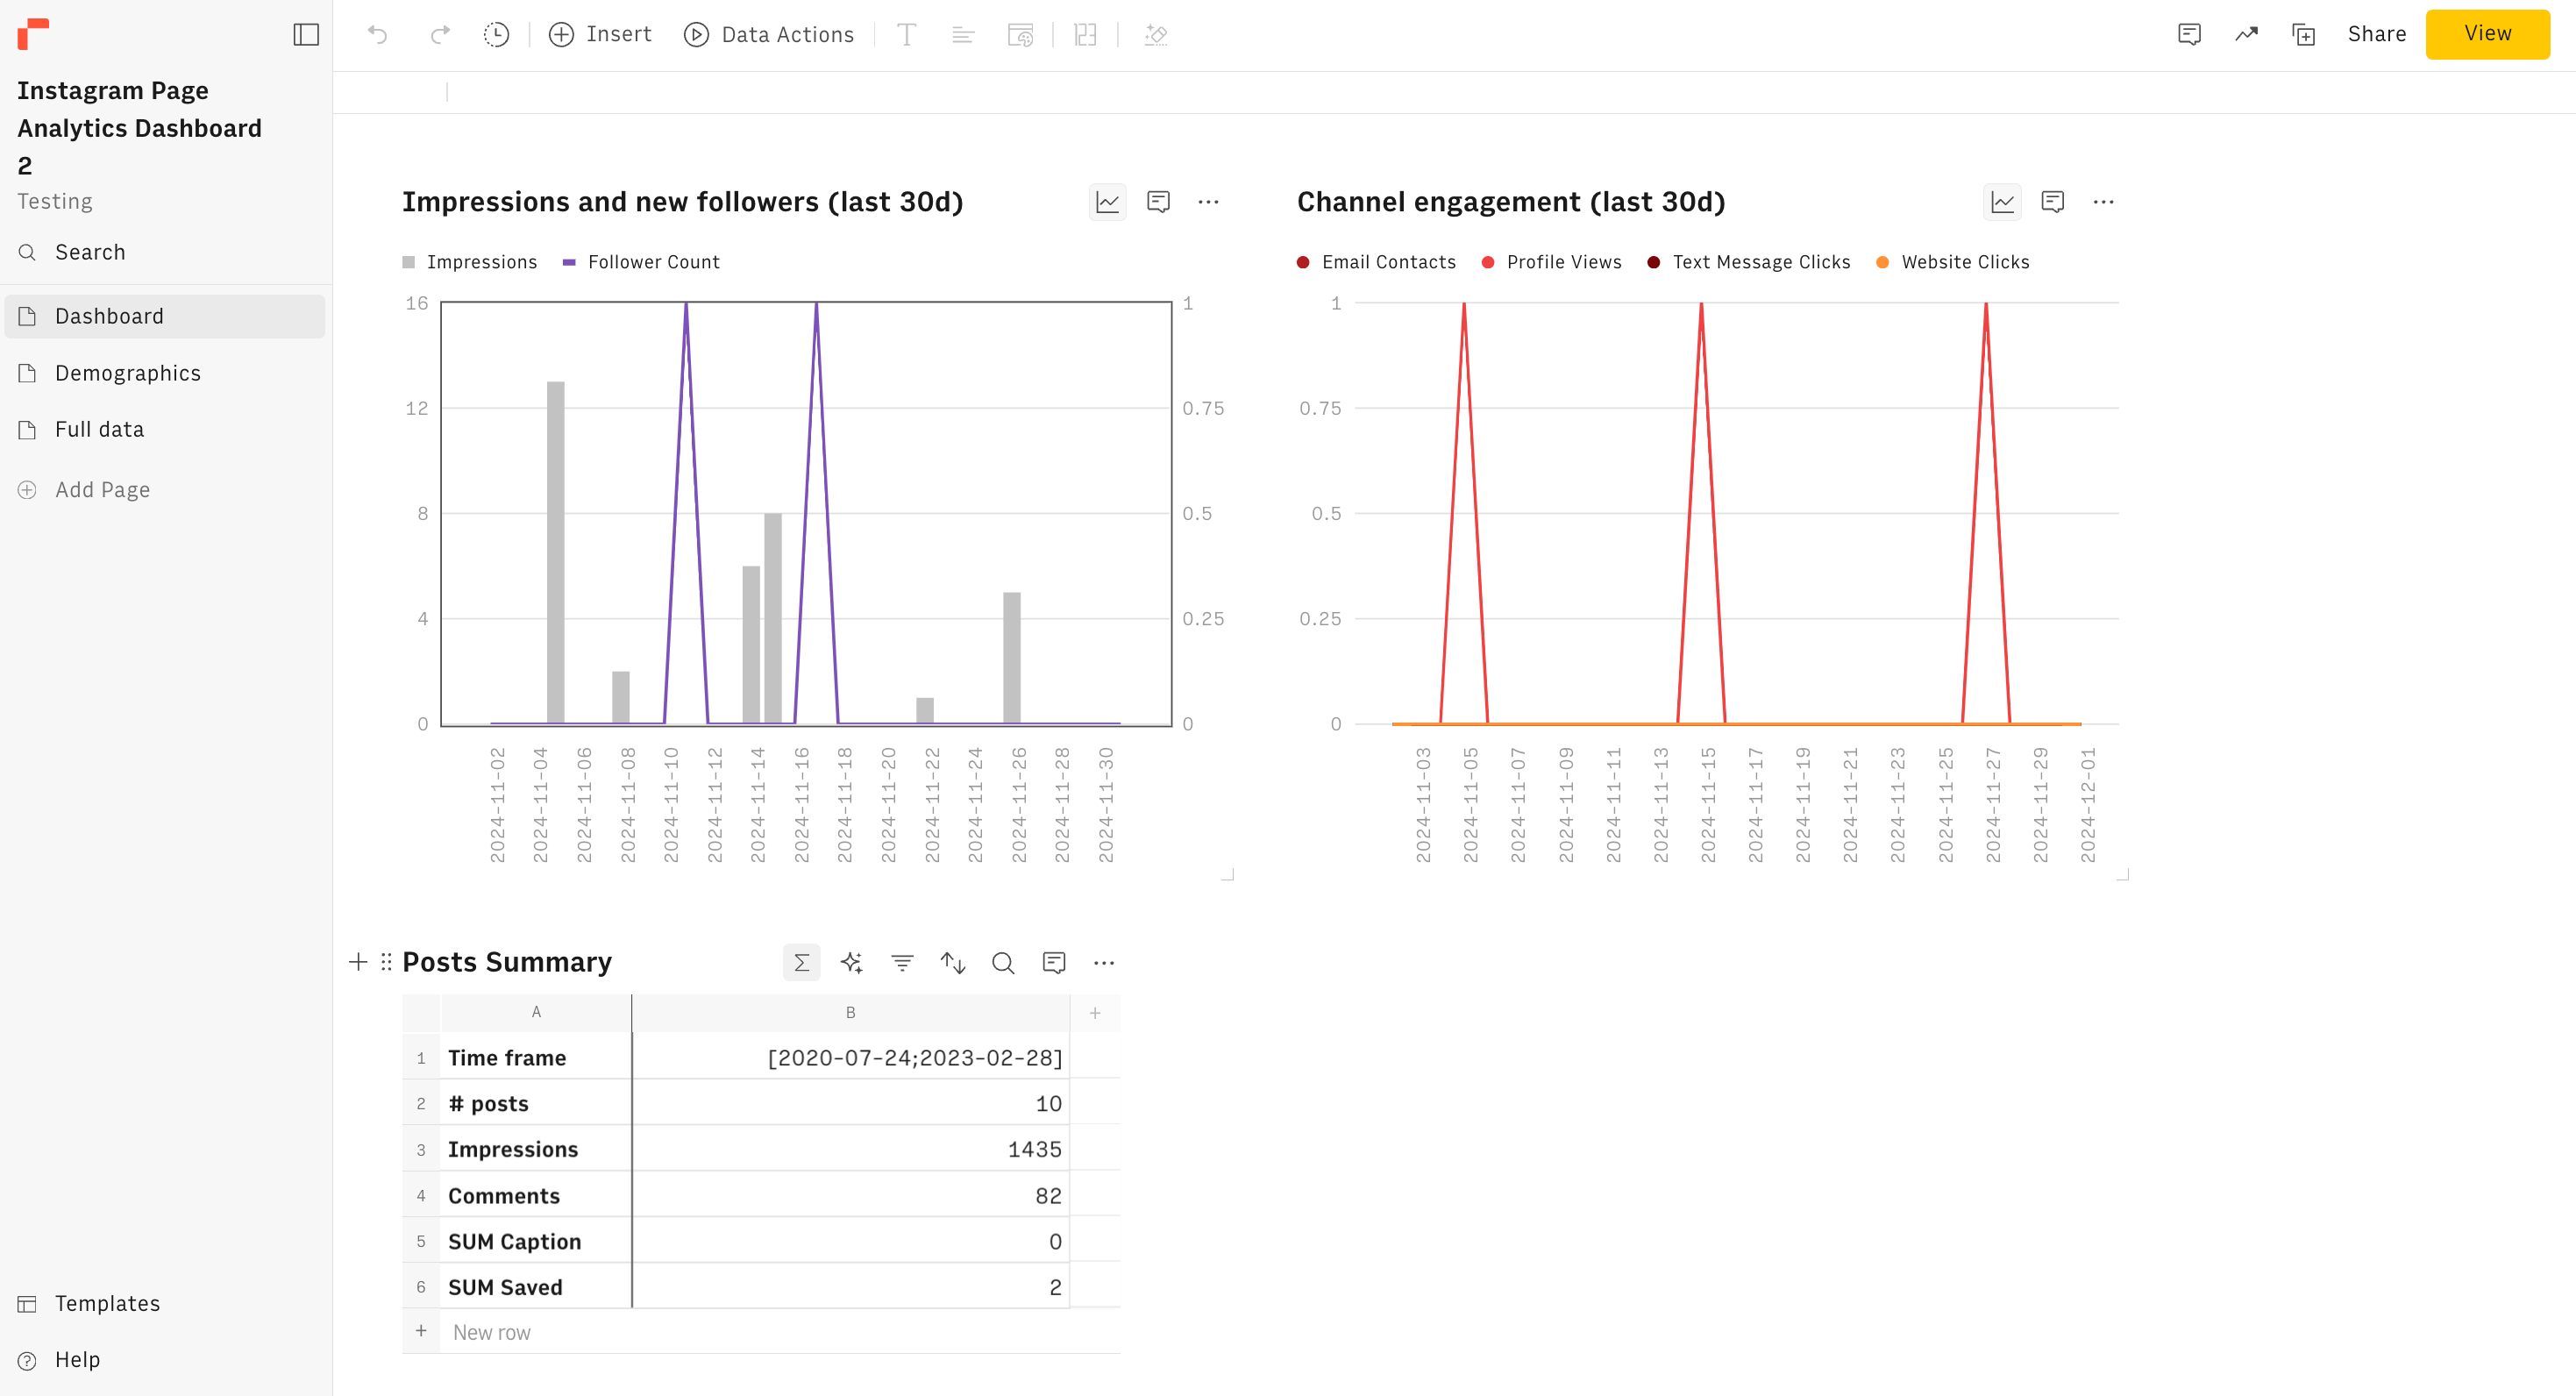
2. Demographics data This dashboard tab shows a visual representation of your audience insight analysis, including age distribution, geographic distribution, and gender distribution.
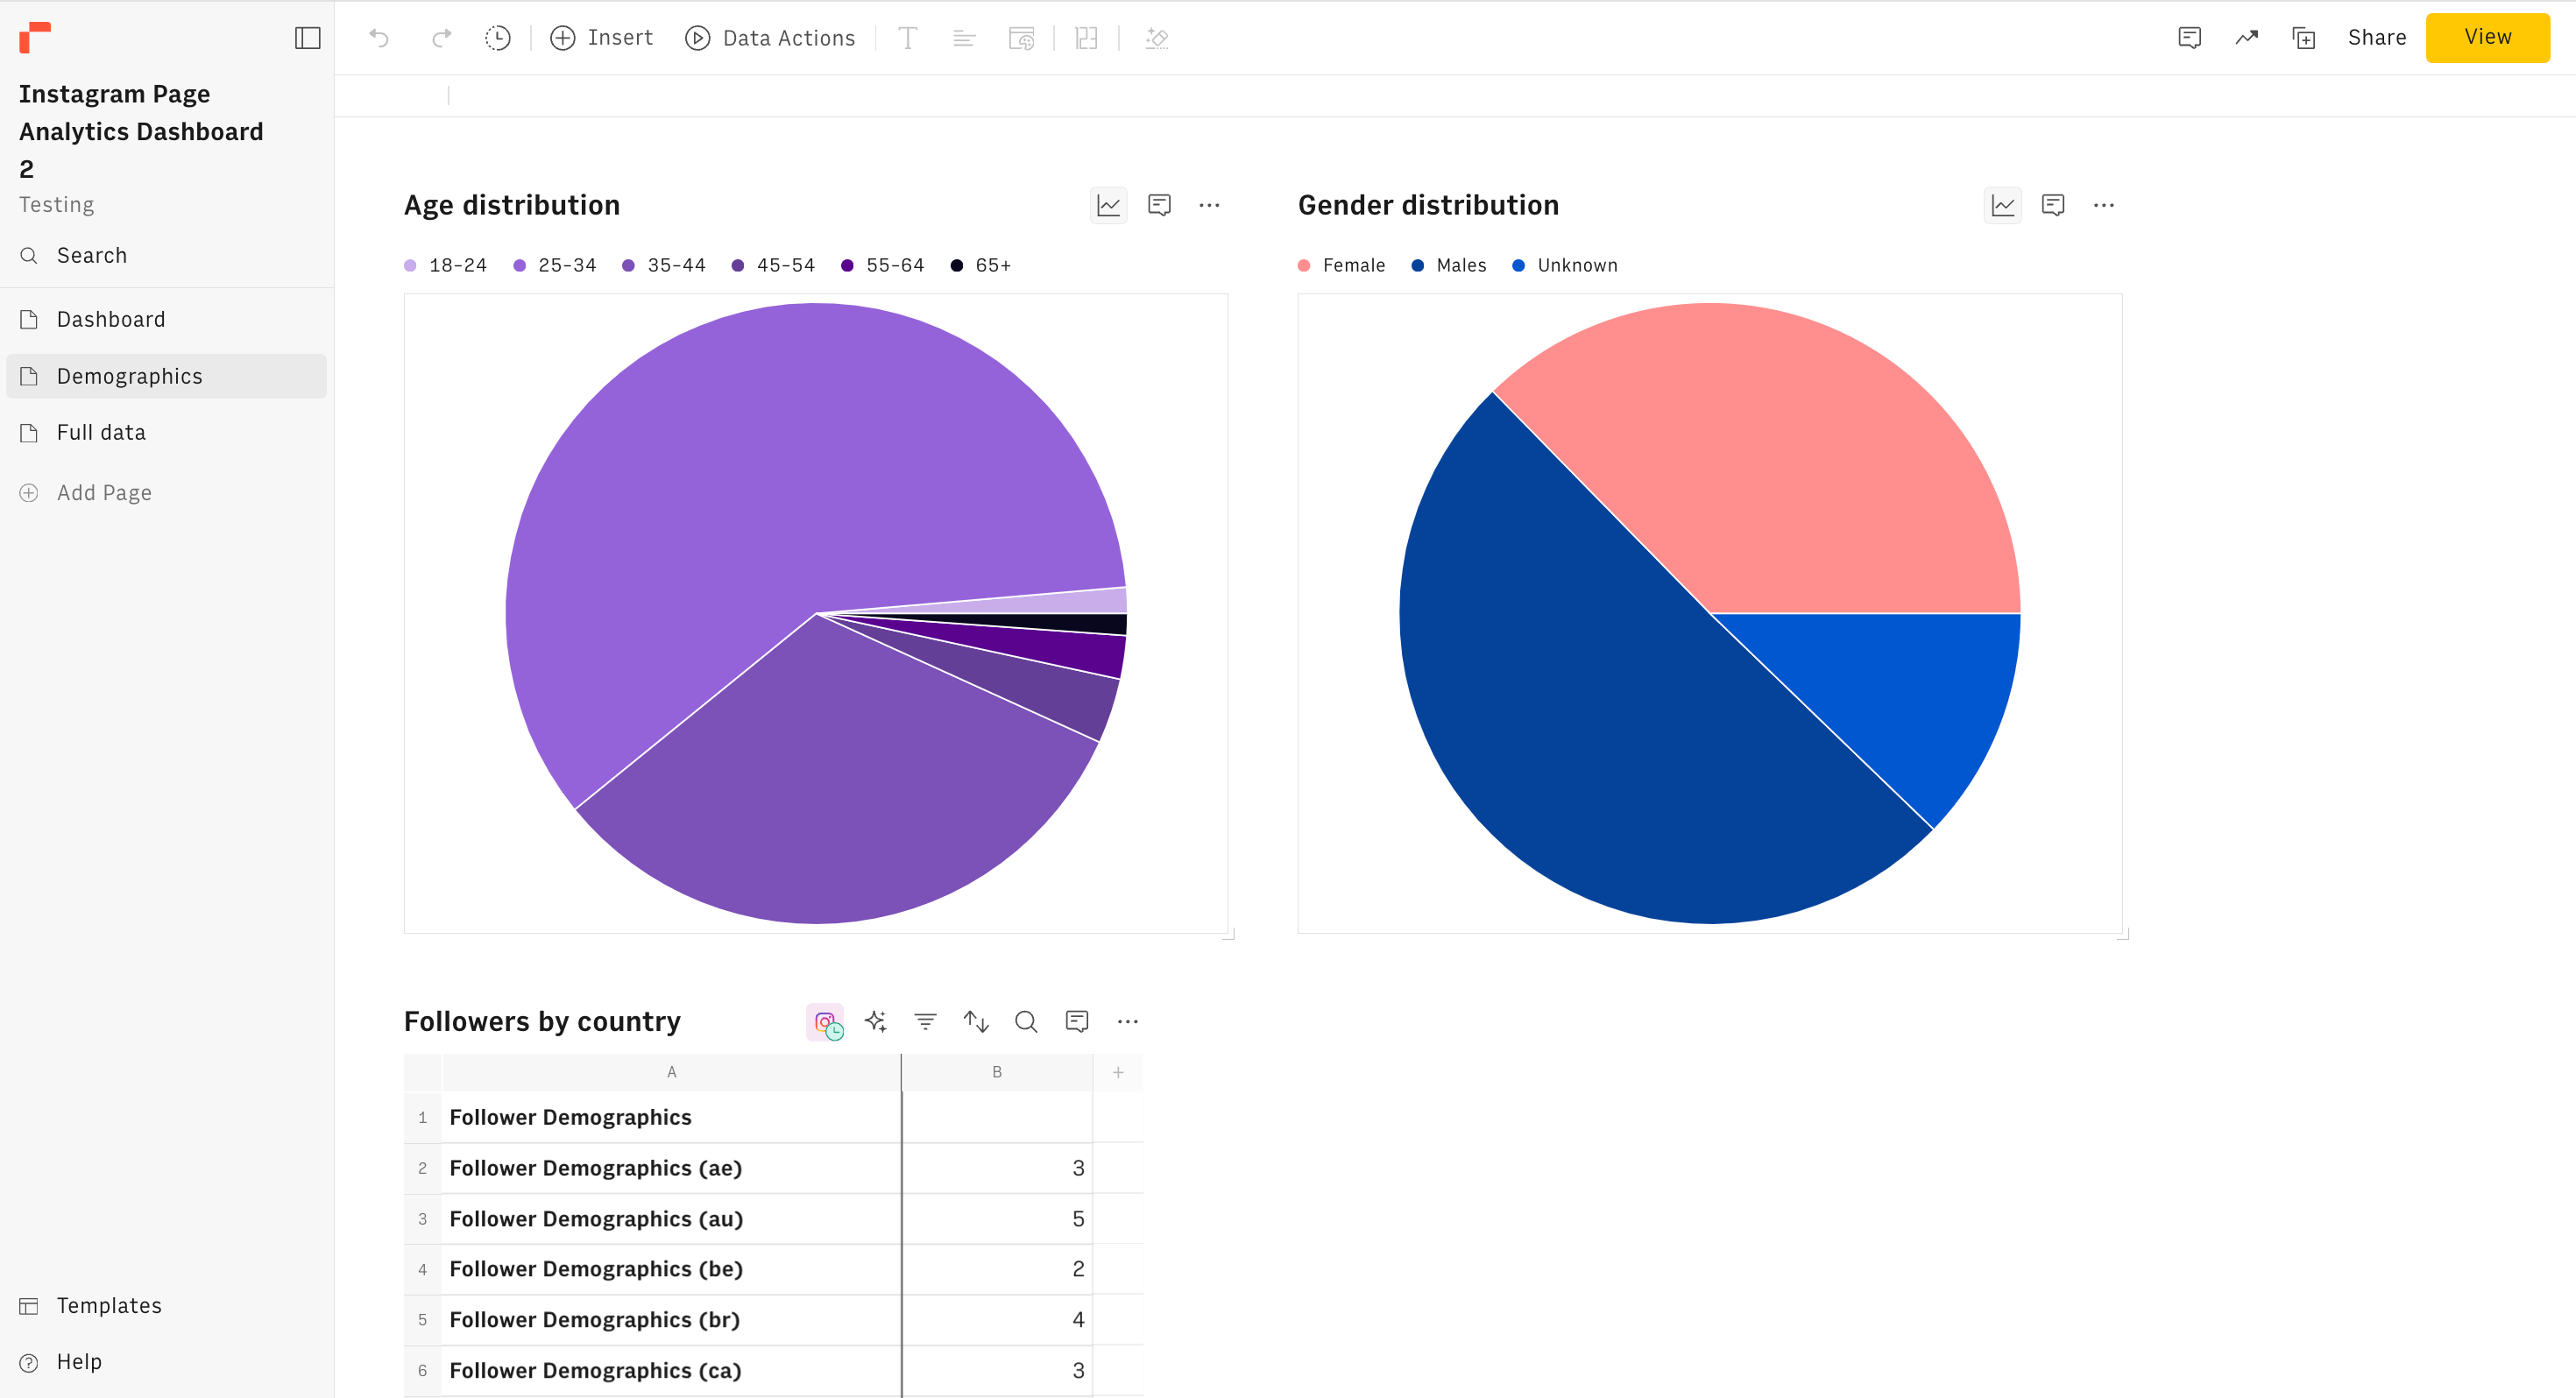
3. The full data shows the holistic overview of post-performance, channel performance, and channel interactions. Unlike what Instagram analytics gives you, our tool makes it more special because it appears all in one table.
In general, the Instagram Page Analytics Dashboard includes the following main metrics:
Daily Performance Charts: Track your Instagram growth with daily charts showing impressions and new followers. Understand how your content resonates with your audience and adjust your strategy accordingly.
Engagement Over Time: Monitor overall page engagement through a dynamic chart that includes email contacts, profile views, text message clicks, and website clicks. This helps you pinpoint peak interaction times and refine your engagement tactics.
Post Insights: Gain a summary of your last posts, detailing impressions, comments, likes, and new followers. Stay informed about which posts drive the most engagement and which need improvement.
Top Performing Posts: Identify your most impactful content with a table showcasing the top 5 most liked posts. Leverage this information to replicate successful content strategies.
Recent Posts: A table of your 5 most recent posts keeps you up to date and enables you to track their performance in real time.
Demographics Breakdown: Detailed demographics, including age, gender, country, and city breakdowns, will help you better understand your audience and tailor your content to meet their preferences.
Post Performance Chart: Analyze individual post performance to see how each piece of content contributes to your overall growth and engagement.
We have other Instagram trackers like:
ICYMI: How to Track Instagram Followers: A Comprehensive Guide [2025]

A modern, flexible dashboard for Instagram data
Rows lets you sync your Instagram data, manipulate and visualize it with the ease of a spreadsheet.
Try it now (it's free)How Do You Access Instagram Analytics on the App?
You can access Instagram analytics via the Instagram app. It's easy. All you need to do is use the account insights page to view your audience's engagement with your posts.
Before you access Instagram analytics, you must have a business or creator account. If you don't have one, you need to make the switch. You can make the switch using the following steps:
Go to your profile and tap the three lines in the top right corner.
Tap "Settings and Privacy," then "Account Type and Tools."
Tap "Switch to Professional Account" and follow the on-screen instructions.
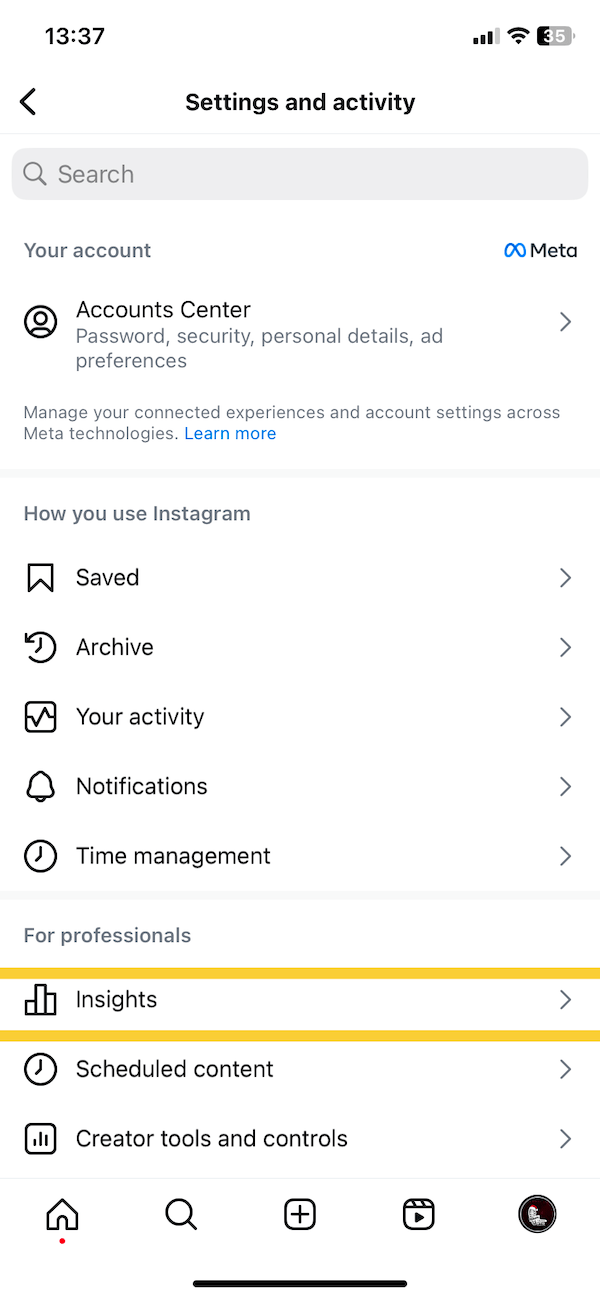
To access Instagram insights, follow the steps below:
Step 1: Open your Instagram app and go to your profile. (Tap the profile icon in the bottom right corner.)
Step 2: Tap the "Professional Dashboard" button. (It's usually located near the top of your profile, below your bio.)
Step 3: Go to insights! You'll find key metrics like accounts reached, content interactions, and audience demographics.
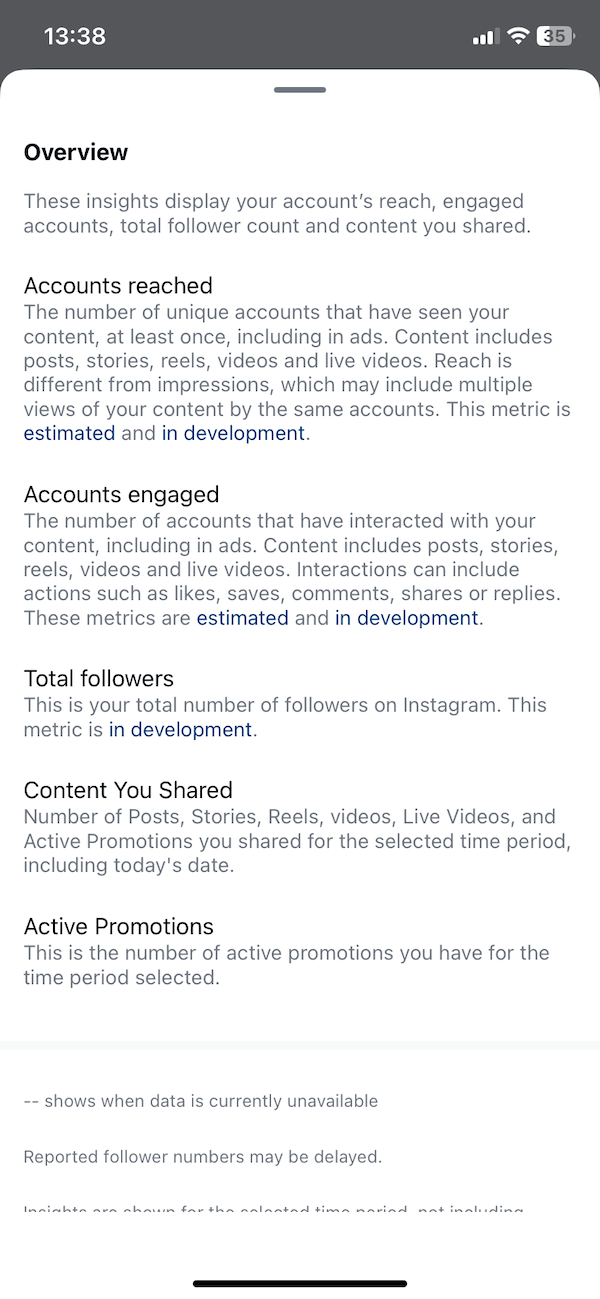
Once you click on insights, you'll see an “overview” page that contains a summary of your:
Views: This shows the number of accounts you've reached over a particular period — followers and non-followers inclusive. It also shows the percentage of content type that has the most reach and views. This tells you how many unique accounts saw your post. Think of it as the size of the crowd your content performed for.

Interactions: Here's where the juicy stuff lives. This metric tracks how people engaged with your post: likes, comments, saves, shares, and even clicks on your website link. It's a measure of how well your content resonates with your audience. This shows the number of accounts that engaged with your content over a particular period of time.

Total followers: your total follower count provides a valuable overview of your audience size and growth trajectory. It's a quick indicator of how many people have chosen to connect with your brand and receive your content in their feeds.
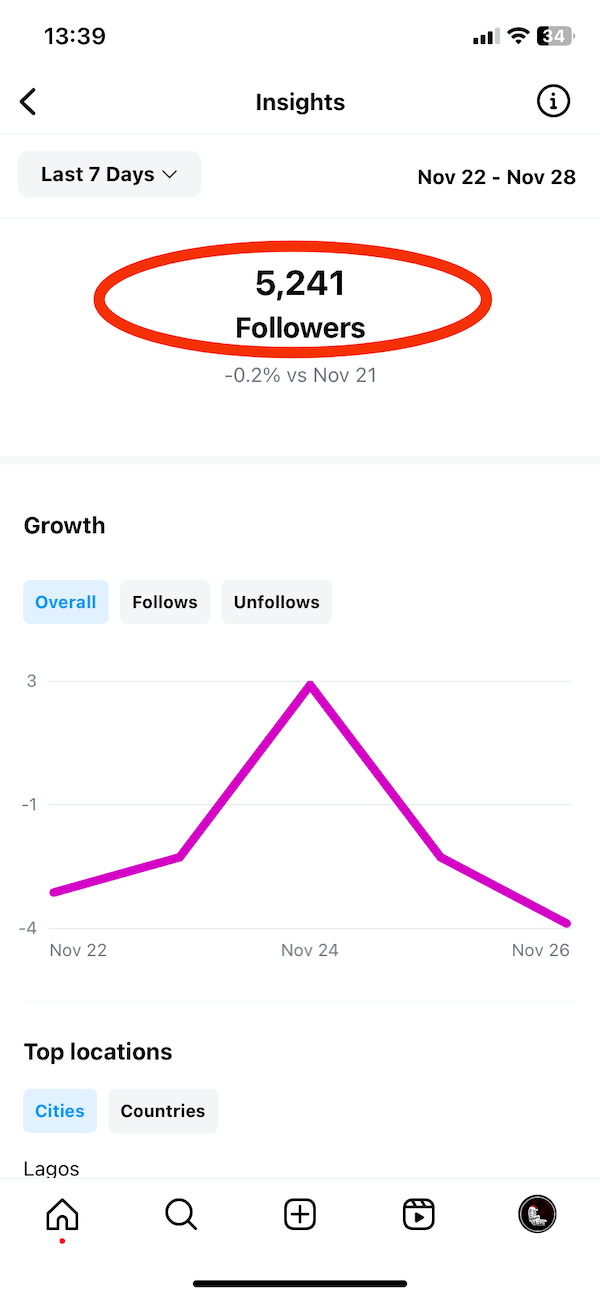
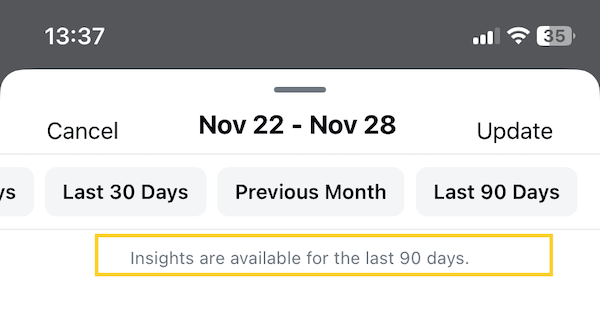
At the top of the overview page is a tab icon showing the days or month you want to review.
Click on it and you'll see some options ranging from — 7 days to last 90 days. This means, the farthest you can access on your dashboard are posts posted on the last 90 days.
Below is an overview of the summary of metrics on the Instagram insights page.
What Metrics Should You Focus On When Checking Instagram Analytics?
We all love seeing those likes and comments roll in. It's a dopamine hit. It tickles something in our heads. It's too sweet. But let's be real: to build a thriving presence on Instagram, you need to look beyond the surface.
Knowing what metrics to check for will save you a lot of hassle. Tracking the wrong metrics is very expensive—it forces you to spend money and energy on the wrong content distribution channels.
Here are some relevant metrics you should focus on when checking Instagram analytics:
Reach and Impressions
This is the foundation of your analytics discovery. How many people are actually seeing your content? Track your reach to understand how far your message is spreading. The goal is to widen your reach, so if you notice a sub-par rate of reach within a period of time — you may need to tweak your strategy.
Engagement Rate
This metric goes beyond vanity metrics. It's about true interaction. Are people commenting, sharing, or saving your posts? A high engagement rate signals your content is resonating, sparking conversations, and building genuine connections. To increase engagement rate, work on creating valuable and memorable content.
Audience Insights
Who are these people engaging with your content? What’s their geographic location? What interests them the most, and what makes them buy, react, orr share? This knowledge is gold for crafting targeted content that speaks directly to their needs and desires.
Follower Growth
Consistent follower growth indicates that your content is attracting and retaining an audience. Tracking this metric is dicey — because often, Instagram can be buggy and you can lose your followers in a twinkle of an eye. What's more? Bots exist! So, you may have more followers than normal.

A modern, flexible dashboard for Instagram data
Rows lets you sync your Instagram data, manipulate and visualize it with the ease of a spreadsheet.
Try it now (it's free)
What Are Common Mistakes to Avoid When Checking Instagram Analytics?
There are many mistakes you can make that can affect your Instagram growth in the long run. I have picked the most important ones. Let's dive in at it —
Failing to understand the “why” behind analytics
Data without context is meaningless. Don't just observe trends; dig deeper to understand the "why" behind them. Why did a particular post perform exceptionally well? What factors contributed to a dip in engagement? These insights are key to informed decision-making.
2. Failing to access historical data
Trends emerge over time. Don't just look at the past week or month — this is one of the banes of using Instagram insights because it can only give you 90 days of data. So, analyze your performance over longer periods to identify patterns, seasonal fluctuations, and long-term growth trajectories using a tool like Rows.
3. Failing to overlook vanity metrics
It's easy to fixate on likes and followers, but they don't always tell the full story. Prioritize metrics that align with your business goals. If you're aiming to drive website traffic, track link clicks.
4. Failing to understand your audience
Making assumptions about your audience is very expensive. Who is your audience, really? Don't make assumptions. Dive into the demographics data to understand their age, gender, location, and interests. This knowledge is crucial for tailoring your content to resonate with the right people.
Start using Rows to Check your Instagram Analytics.
Now that you've learned how to check Instagram analytics, the next step is to set up our dashboard.
All you need to do is set up a new account on Rows and viola! You are ready to go. Once done, go to the Instagram page analytics template page and start using the template.


