10 Best AI Tools for Data Analysis [2026, Jan update]


Ten years ago—data analysis was like painstakingly piecing together a puzzle with a limited toolkit, often relying on manual manipulation and static dashboards.
Fast forward to today, with the AI revolution, it's like having a super-smart assistant that not only helps you find the missing pieces—but also reveals hidden patterns and predicts the future picture in split seconds.
Now, AI is like our superpower—it is helping us find answers faster and see things we never even knew to look for, even from a large pool of data.
But you know how the market reacts—now, we have many AI tools for data analysis. And I'm sure you're overwhelmed by the sheer number of options. You're not alone.
That's where this guide comes in. We've compiled 10 of the best data analysis tools on the market based on some relevant evaluations and experience in the data analysis industry.
What should you look for in an AI tool for Data Analysis?
With AI transforming how we work with data, it's worth being selective about which tools actually solve real problems versus those that just add another login to manage.
Here's what separates genuinely useful AI data tools from the rest:
Comprehensive Data Ingestion
Modern data doesn't live in one place—it's scattered across CSVs, PDFs, images, databases, cloud storage, and various SaaS tools. A strong AI data analysis tool should be able to ingest all of these sources without requiring you to standardize or transform everything first. This kind of flexible integration is what transforms a specialized tool into your actual go-to solution, rather than just another utility you use occasionally.
Iterative Analysis Capability
Many "chat with data" products promise a revolutionary experience where you don't need formulas or code. That's valuable, but the real test is what happens next. Can you build on your initial analysis? Refine your questions? Layer insights on top of each other? Or does each query feel like starting from scratch? The best tools provide a backbone for iterative exploration—where each question builds context and the system learns what you're trying to understand, rather than treating every interaction as isolated.
Scalability and Performance
The tool needs to handle your actual data volumes without choking. If you're working with large datasets, you need something built for scale—not a prototype that works beautifully on sample data but grinds to a halt on real workloads. Consider whether it can process your data efficiently, whether it's optimized for different analysis types (forecasting, clustering, predictive modeling), and whether it will grow with your needs or become a bottleneck.
Data Security and Privacy
Where does your data actually go when you upload it? Is it processed locally, or sent to external servers? Does the vendor comply with relevant regulations like GDPR? What happens to your data after analysis—is it retained, used for training, or immediately discarded? These aren't paranoid questions; they're basic due diligence, especially if you're working with customer data, financial information, or anything remotely sensitive.
Review of 10 Best AI Tools for Data Analysis
Generative AI holds immense potential for data analysis, but choosing the right tool requires careful consideration. Here's a review of the 10 best AI Data analytics tools.
1. Rows

Rows is your new AI Data Analyst. It combines the backbone of a spreadsheet with the power of ChatGPT to to give business people full autonomy over their data. Just ask in plain language and Rows will handle the rest, whether that's spreadsheet operations, data import or transformations, or running Python code to do code-level analyses.
AI Analyst
Rows AI works across four key capabilities:
Spreadsheet-native operations Standard spreadsheet tasks are supported both as regular commands and via AI —pivots, conditional formatting, new columns, charts—happen through conversation instead of clicking through menus or writing formulas.
Example prompts:
→ "Build a pie chart showing share of profit by product"
→ "Add conditional formatting rule to column D: red if <100, yellow if <150 and green if >150"
Data Ingestion Pull data directly from documents or connected tools without wrestling with configurations or manual copying-pasting.
Example prompts
→ "Import all transactions from my N26 account and classify them as: marketing, software, travel, other"
→ "Pull keyword data from the last 90 days from Google Search Console"
Multi-step plans String together multiple dependent steps—build a dashboard, create a calculator from scratch, or execute a series of operations where each step builds on the last.
Example prompts:
→ "Add a column classifying keyword position into brackets: [1-3], [4-10], [10+], then create a pivot showing average CTR by bracket"
→ "Build a simple dashboard showing the performance of sales people in the last quarter"
Code-level analysis When you need statistical analysis, machine learning, or custom visualizations that go beyond standard charts, Rows can write and execute Python code to get there.
Example prompts:
→ "How does my revenue change if my margin increases by 5%?" (what-if analysis)
→ "How many orders do I need to hit $100k, $500k, and $1M in revenue?" (goal-seek)
→ "Calculate correlation between keyword position and clicks, then show statistical significance"
→ "Run a k-means clustering model to segment customers by purchase behavior and visualize the clusters"
→ "Create a Sankey diagram showing traffic flow from source → landing page → conversion"
Instead of switching between tools or learning specialized syntax, you describe the analysis you want and the AI Analyst figures out how to execute it: it scans your dataset, understands the key variables, and provides what you need.
To access AI in Rows you can either
click on the ✨ icon, at the bottom right corner of your viewport: this will open a chat UI panel that will work across your spreadsheet. You can ask questions in two modes, Build or Chat, based on whether you want to actually creating elements or just have in-line answers.
use the ✨ icon at the top right corner of each element: a contextual menu with a few shortcut will open right away allowing you to perform quick actions like summarizing the content or beautify a table
Watch below side-by-side comparisons with Excel and Google Sheets:
Extract data from documents and images
As mentioned above, Rows can ingest data directly from documents and images—not just as static imports, but as structured, editable tables.
It works with PDFs and multiple image formats (JPEG, PNG, HEIC...)
You can process batches at once rather than uploading files one by one.
All extracted data can get merged into a single table you can immediately work with, stay on separate tables or get appended to an existing one.
You can also add custom extraction instructions to pull exactly what you need. A very common use case is invoices management. By adding the prompt
"Extract date, vendor name, VAT amount, total amount, and description", Rowswill scan all documents and return a consolidated table with those specific fields—no manual data entry, no error, or formatting issues
Instructions can be enhanced automatically and saved for later. Watch the demo below:
What's more? 50+ data integrations
As anticipated above, Rows comes with 50+ built-in data sources integrations in various domains, many of which are supported in the AI Analyst, meaning that you can simply ask AI to pull data from your ideal source and it will take care of the rest.
Example of prompts:
SEO data: "
Pull page data from the last 30 days from Google Search Console, including only pages that contain /blog/"Finance data: "
Pull all transactions from my HSBC account and classify them into: software, marketing, travel expenses, revenue"Marketing data: "
Use GA4 data to rank the top sources of traffic from mobile in Brazil in the last 30 days"
See it in action below:
Here's a division of the built-in integrations in Rows:
Marketing: GA4, GSC, Facebook, Instagram, Tiktok
Finance: Stripe and Plaid (+12,000 supported banks)
Productivity software: OpenAI, Notion, Slack, Email, Translate
Data warehouse: MySQL, BigQuery, PostgreSQL, Snowflake, Amazon Redshift
Discover the full catalog here.
You also have the possibility of creating custom connections via our HTTP functions.
💡 Pro tip: When the tool you’re working with isn’t listed in our catalog, HTTP functions allow you to connect to any RESTful API, GraphQL endpoint, or other HTTP-based data sources, regardless of their structure or authentication methods. On Rows, GET, POST, PUT, and PATCH make the catalog of integrable tools virtually infinite. Try them our in our HTTP tester.
Or watch the demo below:
Read more: 10 Best Data aggregation tools in 2025.
Pricing
Rows offers a generous free plan where you can onboard unlimited members, up to 10 guests and execute up to 50 integration tasks per month. But it also offers three different paid plans for accessing premium features:
Plus: 8$/month/member, up to 25 guests, limited AI usage, unlimited integration tasks & manual data refresh.
Pro: 79$/month + 8$/member, up to 100 guests, 200 prompts per month, unlimited integration tasks & daily data refresh.
Enterprise: Custom price for advanced APIs usage and workflows.
2. Alteryx
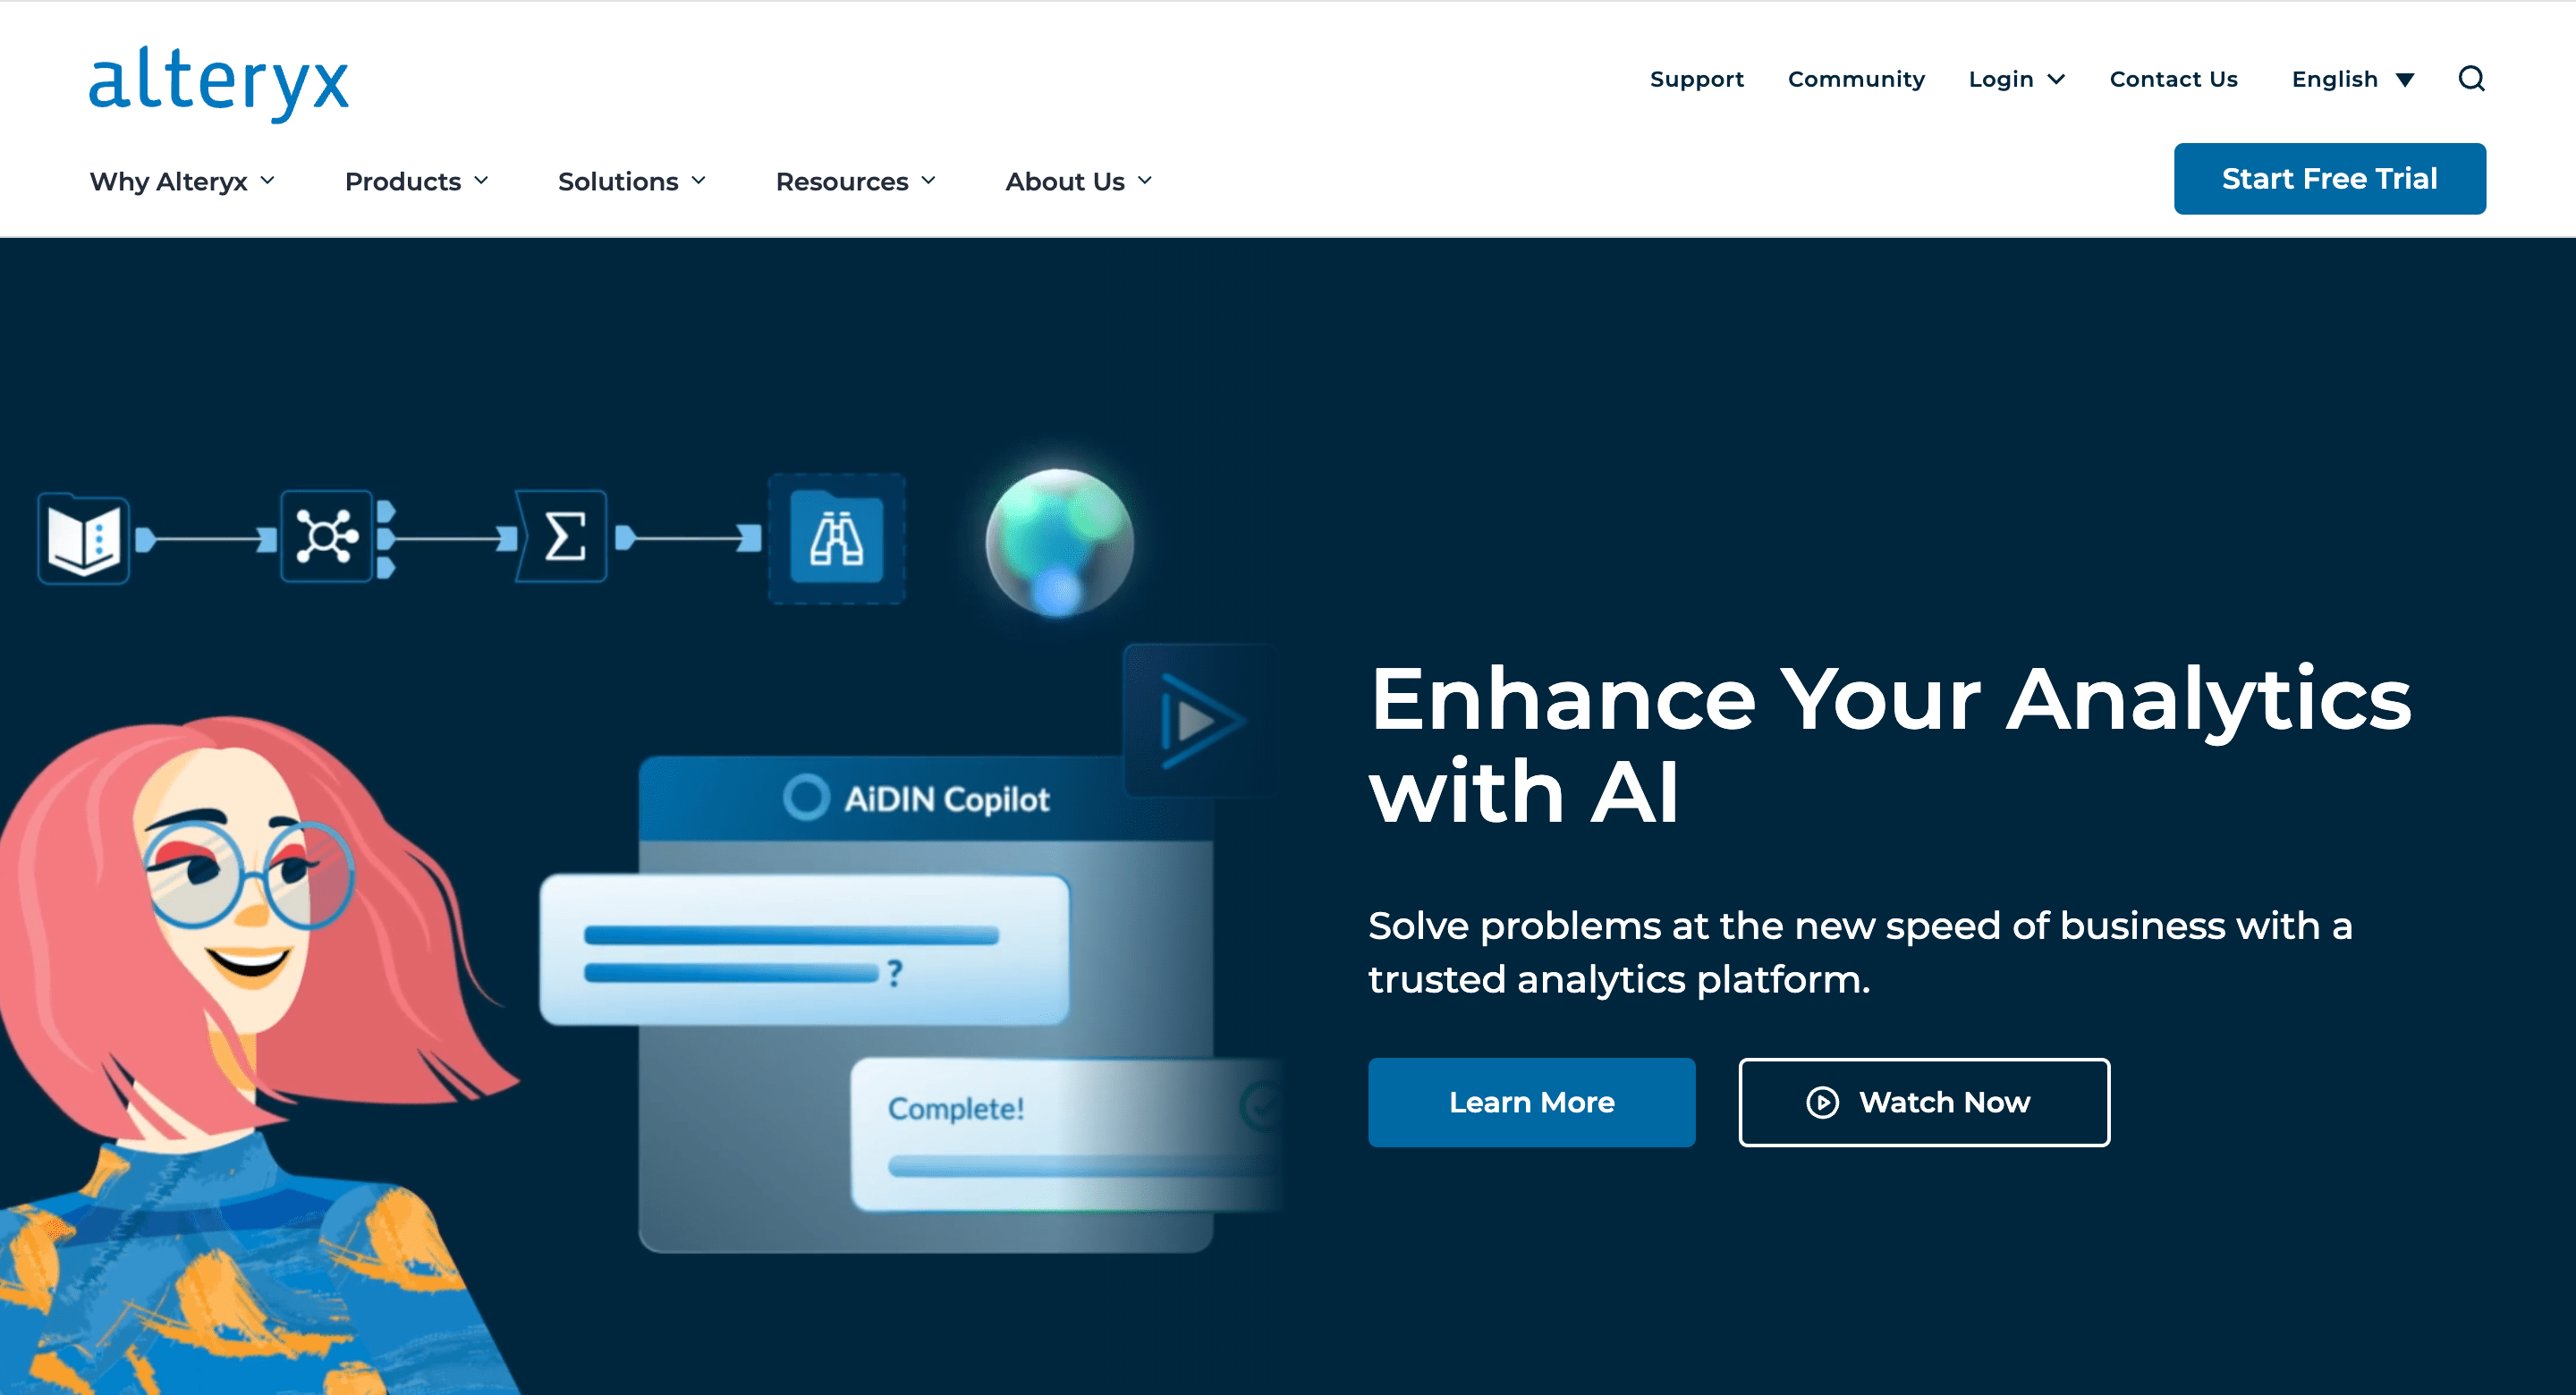
Alteryx is a data analytics and visualization platform that offers a wide range of tools to help businesses analyze data.
Alteryx offers Auto Insights, a feature powered by its AiDIN AI engine, to provide automated insights from data and uncover patterns and relationships you might otherwise miss.
In addition, it provides tools for analyzing location-based data, enabling users to gain insights from spatial patterns and relationships. This feature is particularly useful for businesses with geographically dispersed operations or those dealing with location-specific data.
Top features:
AiDIN Copilot
Automated machine learning
Predictive modeling tools
Feature engineering
Pros and cons
✅ Intuitive user interface
✅ Workflow automation
❌ Pricing opacity
❌ Dependency on open source
Pricing: Pricing details are not available on their website.
3. Microsoft BI
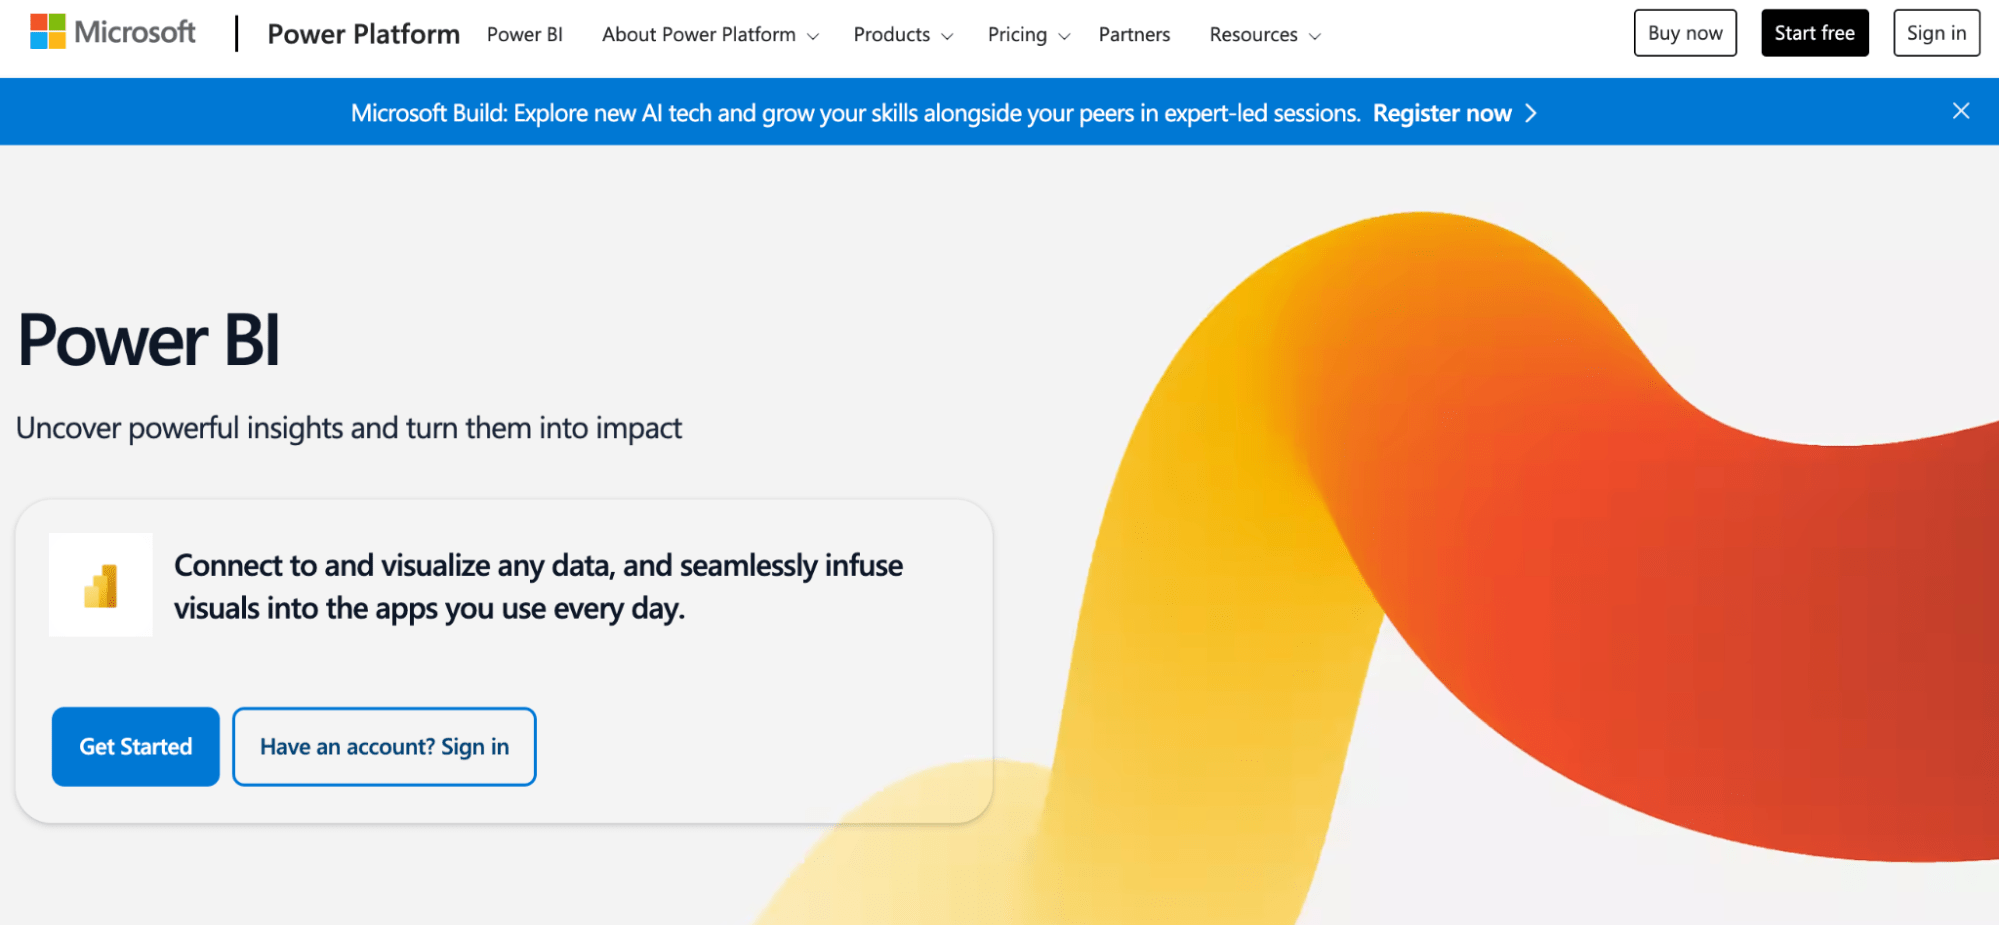
Microsoft Power BI is a business intelligence platform that provides tools for aggregating, analyzing, visualizing, and sharing data.
Microsoft Power BI uses AI to simplify data analysis, providing features like automated insights, key influencer analysis, and anomaly detection. This helps users quickly identify trends, patterns, and outliers in their data without needing deep technical expertise.
For example, if a user imports a dataset with sales data, Smart Data Discovery can automatically generate charts and graphs showing sales trends over time.
Key features:
AI insights
Q/A with natural language
Automatic anomaly detection
Azure cognitive services integration
Pros and cons:
✅ Excel integration
✅ Regular updates
❌ Steep learning curve
❌ DAX function complexity
Pricing: Price starts at $10 per month.
4. Tableau
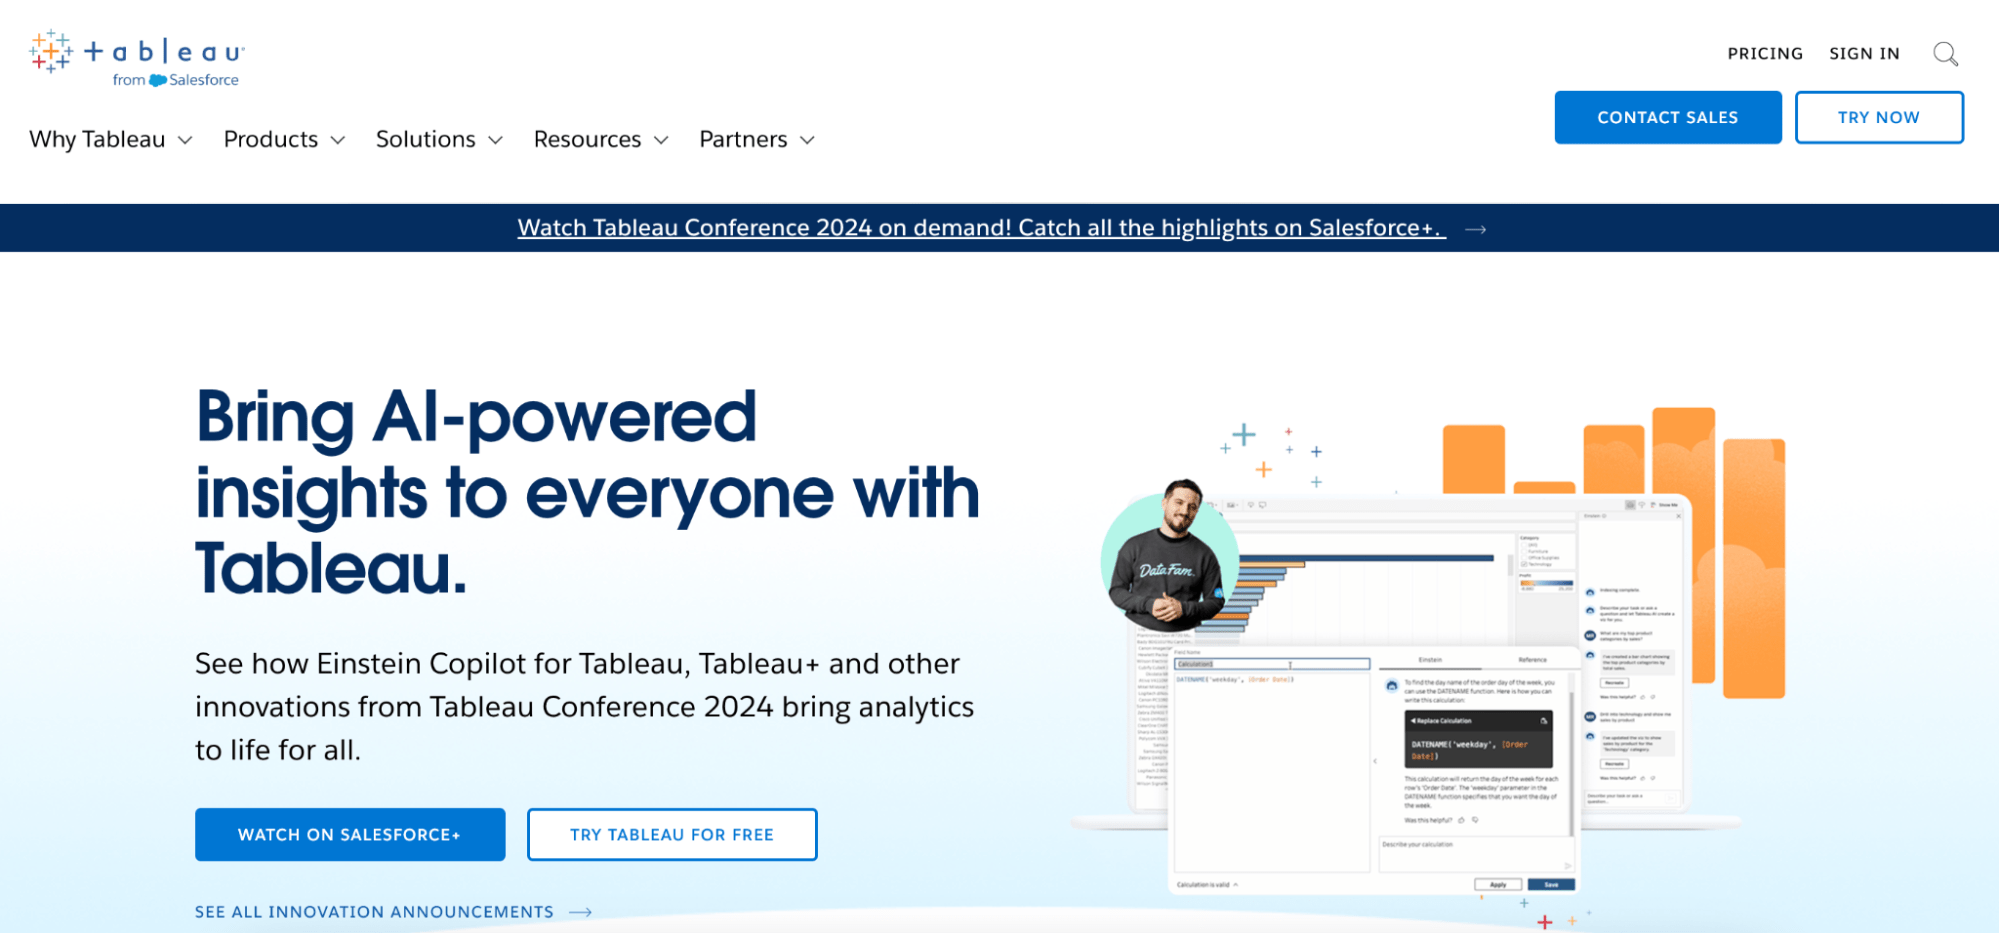
Tableau is a popular data visualization tool that's become a staple for data analysts, scientists, and business users alike. It's known for its drag-and-drop interface that makes it easy to connect to various data sources, create interactive dashboards, and explore data visually to uncover insights.
One of the key components of Tableau AI is Tableau Pulse, which utilizes AI to offer personalized and automated experiences tailored to each user's key performance indicators (KPIs).
Key features:
Einstein discovery
Predictive forecasting
Automated insights
Data prep suggestions
Pros and cons
✅ Data visualization
✅ Broad data source connectivity
❌ Security limitations
Pricing: Starter plan at $15 per month.
5. Sisense AI
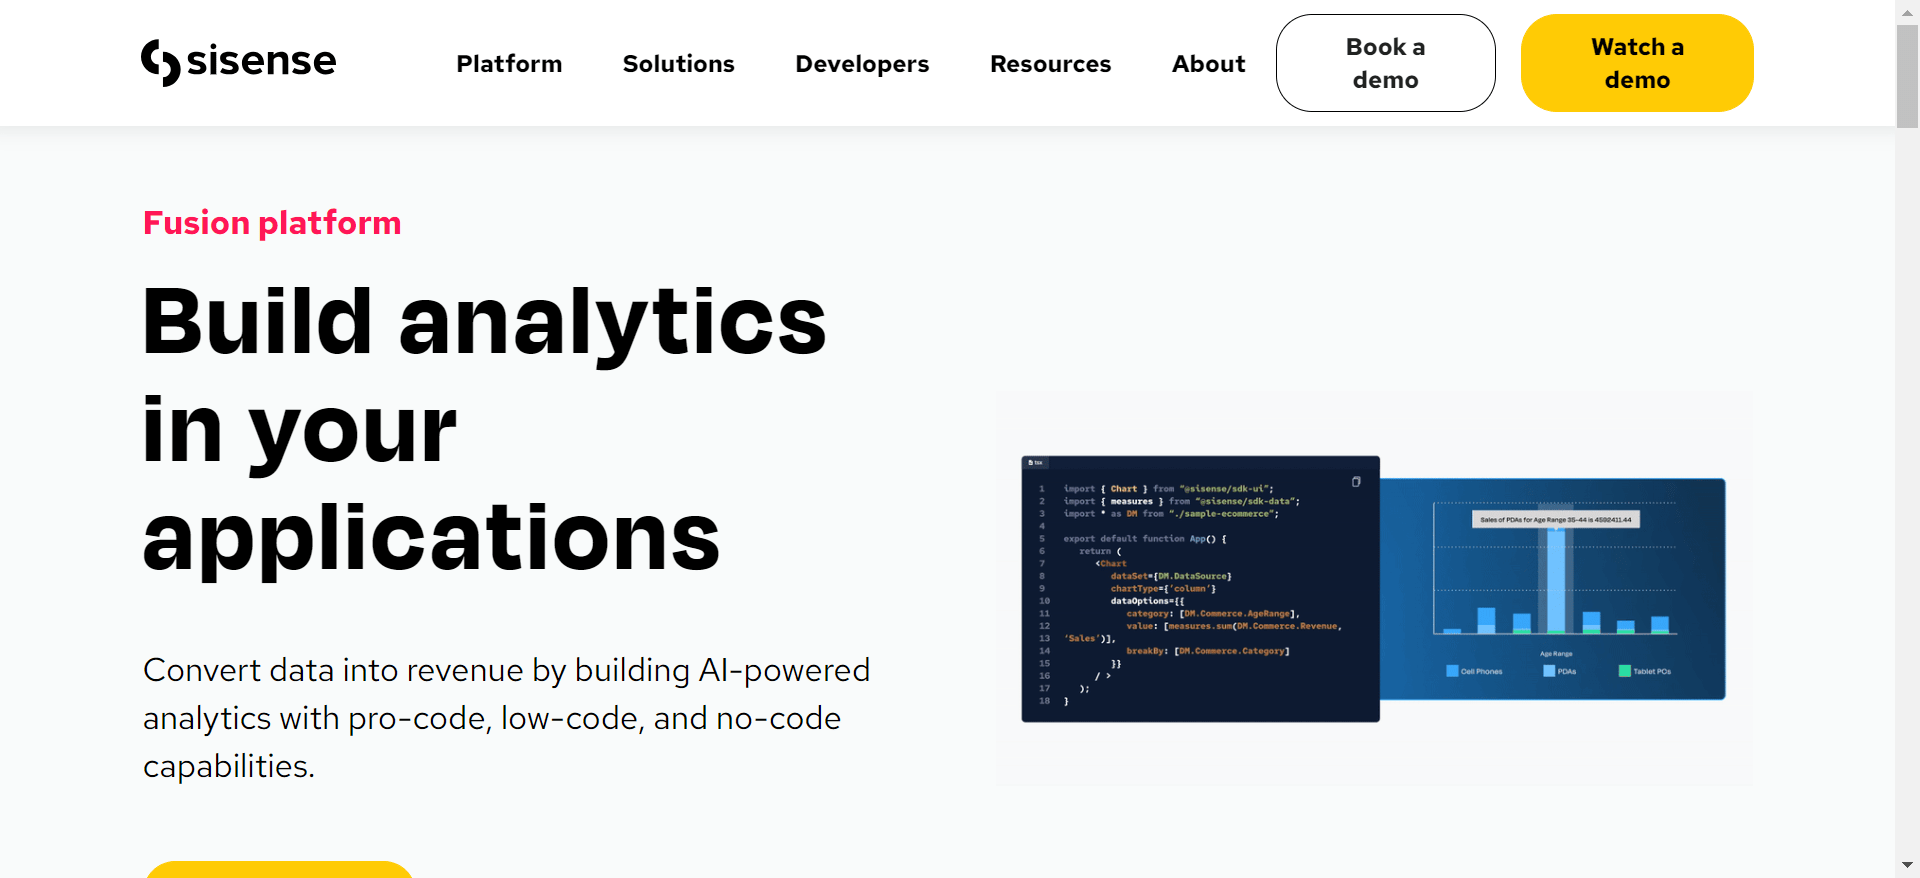
Sisense uses AI to provide features like natural language querying, automated insights, and smart visualizations.
This allows users to ask questions of their data in plain English, uncover hidden patterns, and gain a deeper understanding of their business without needing to write complex code or formulas.
Sisense's NLQ feature, "SimplyAsk," allows users to create reports from scratch using only natural language. This means that users can ask questions of their data in plain English, without needing to know any special syntax or coding.
Key features:
AI exploration
Sisense Fusion
Narrative insights
Predictive insights
Sisense chatbot
Pros and cons:
✅ Cloud based option available
✅ Easy to use
❌ Steep learning curve
Pricing: There's no available pricing on the site.
6. Domo
Domo is a tool that specializes in business intelligence and data visualization. Domo's AI can automate repetitive tasks, such as data cleansing and report generation, freeing up your team to focus on more strategic work.
Key features:
AutoML
AI text analysis
AI anomaly detection
Data science workspace
Pros and cons:
✅ Real time data access
✅ Customization option
❌ Limited advanced analytics
Pricing: Domo operates on a consumption-based pricing.
7. Polymer search
Polymer is a robust data analytics tool designed for users across various sectors, including e-commerce and marketing. Polymer's AI can automatically generate dashboards based on your data, saving you time and effort. Key features include AI-generated dashboards that provide instant insights and embedded analytics for seamless integration into existing applications, enhancing productivity.
Key features:
No-code data exploration
Predictive analytics
AI-powered dashboards
Pros and cons
✅ User friendly interface
✅ Real time data syncing
❌ Limited customization options
Pricing: Starter plan at $50/month.
8. Quid
Quid is a powerful data analytics platform that leverages advanced AI and natural language processing to transform vast amounts of unstructured data into actionable insights. It excels in real-time analysis of consumer sentiment, market trends, and competitive landscapes, integrating data from social media, news, and proprietary sources to enhance decision-making.
Quid's AI summarizes key themes and sentiments from vast amounts of text, allowing you to quickly grasp the essence of complex topics.
Key features:
Generative AI Integration
Anomaly detection
Data automation
Pros and cons:
✅ Centralised management
✅ Audience analysis
❌ Lacks advanced features
❌ Very pricey
Pricing: Starter plan at $4995 per month.
9. RapidMiner
RapidMiner is a prominent data science platform designed to facilitate comprehensive data analytics through a user-friendly interface.
RapidMiner includes AutoML capabilities that automatically find the best machine learning models for your data and predict outcomes. This allows users with limited data science experience to build high-quality models without needing to manually code or fine-tune algorithms.
Key features:
Automated machine learning
Automated data preparation
Real-time scoring
Pros and cons:
✅ Collaboration features
✅ Excellent transparency
❌ Steep learning curve
Pricing: Not stated on their page.
10. Julius AI
Julius AI is an AI-powered data analyst that aims to make data science accessible to everyone, regardless of their technical skills. It can analyze and visualize data, generate reports, and even build forecasting models, all through a simple chat interface.
Julius AI simplifies the interpretation of large datasets, offering intuitive visualizations and predictive analytics, making it an indispensable tool for both novice and expert data analysts.
Key features:
Predictive forecasting
Automated data analytics
NLP
Pros and cons:
✅ Easy to use
✅ Dashboard design
❌ Can be slow in processing
Pricing: Basic plan starts at $20 per month.
Conclusion
All the platforms on this list can scale your data analytics operations in so many ways.
At Rows, we are here to help you make the most out of data with robust AI features and automation features.
Whether you are a marketing manager, SEO growth advisor, or C.R.O., Rows is perfect for your reports. So what next? Go to Rows.com, import data, automate your report, and see if it's the right match!