Google Analytics 4 User Acquisition Report
Get a breakdown of your website User Acquisition by the First User Default Channel Group and over time.

 100% spreadsheet
 Connected to your data
 Daily+ refresh
 Embed everywhere
About Google Analytics 4 User Acquisition Report
The Google Analytics 4 (GA4) User Acquisition Report template is your ultimate tool for gaining in-depth insights into your website’s user acquisition over the past 90 days. This comprehensive report captures essential metrics and visualizations, empowering you to make data-driven decisions and optimize your marketing strategies effectively.
Key Features:
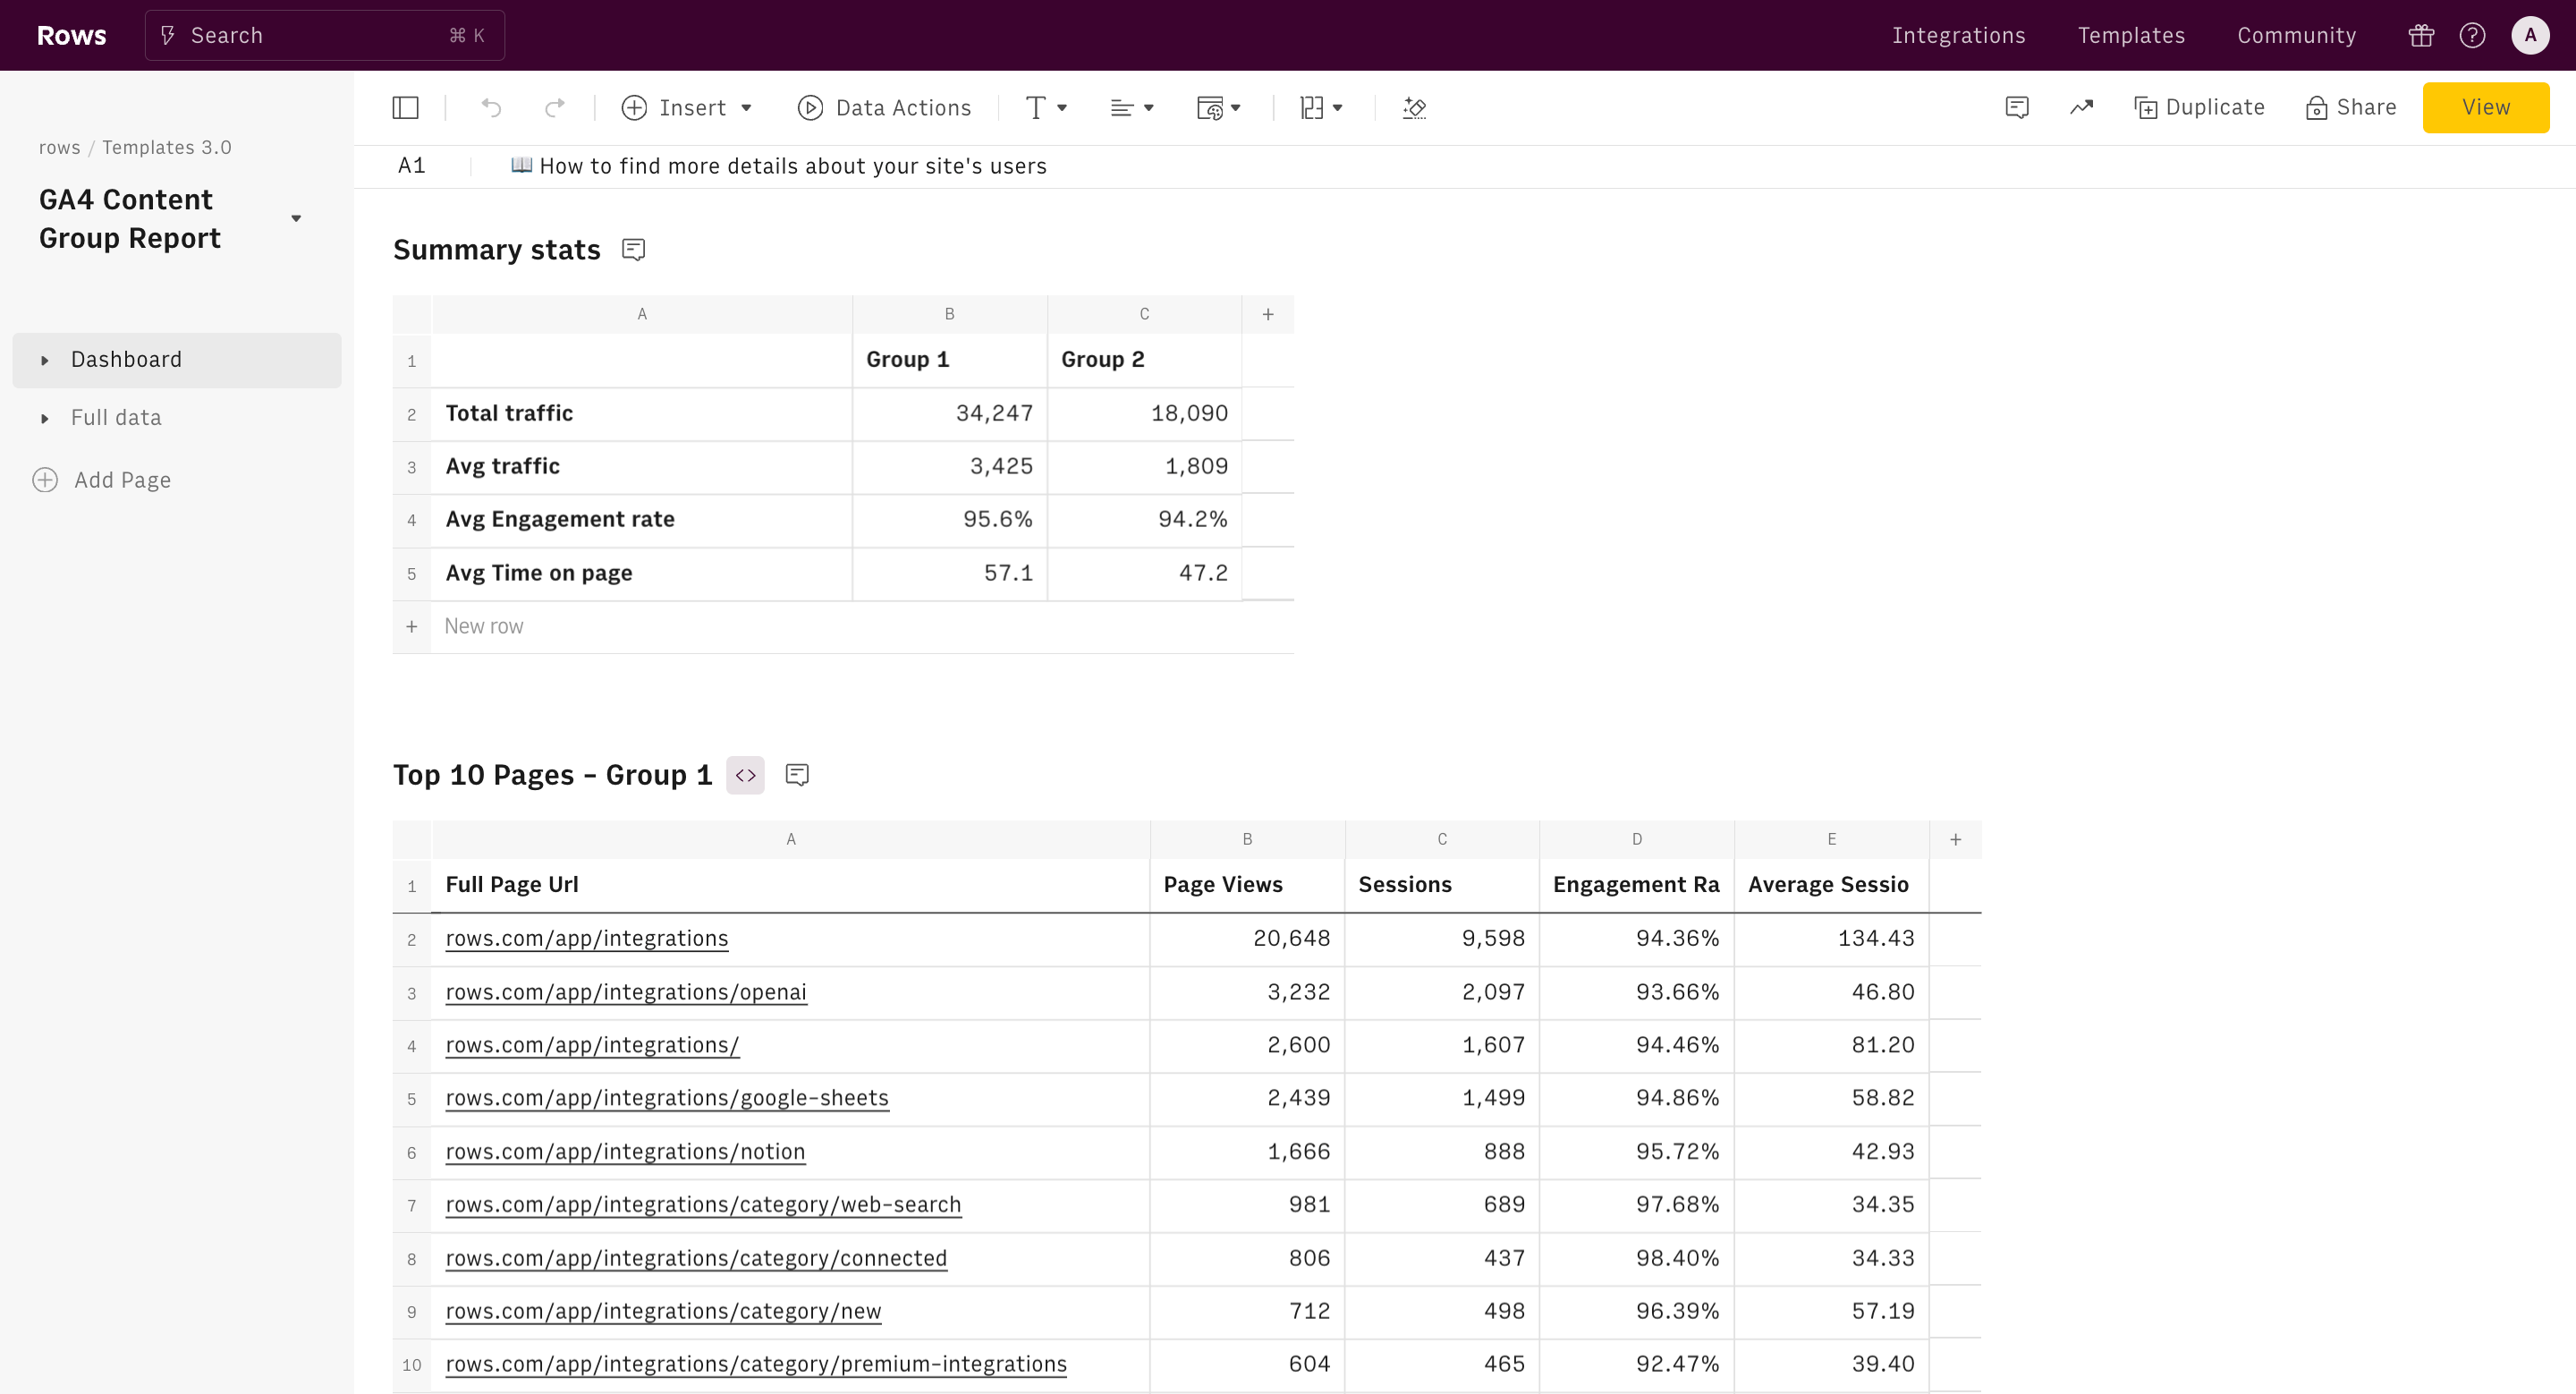
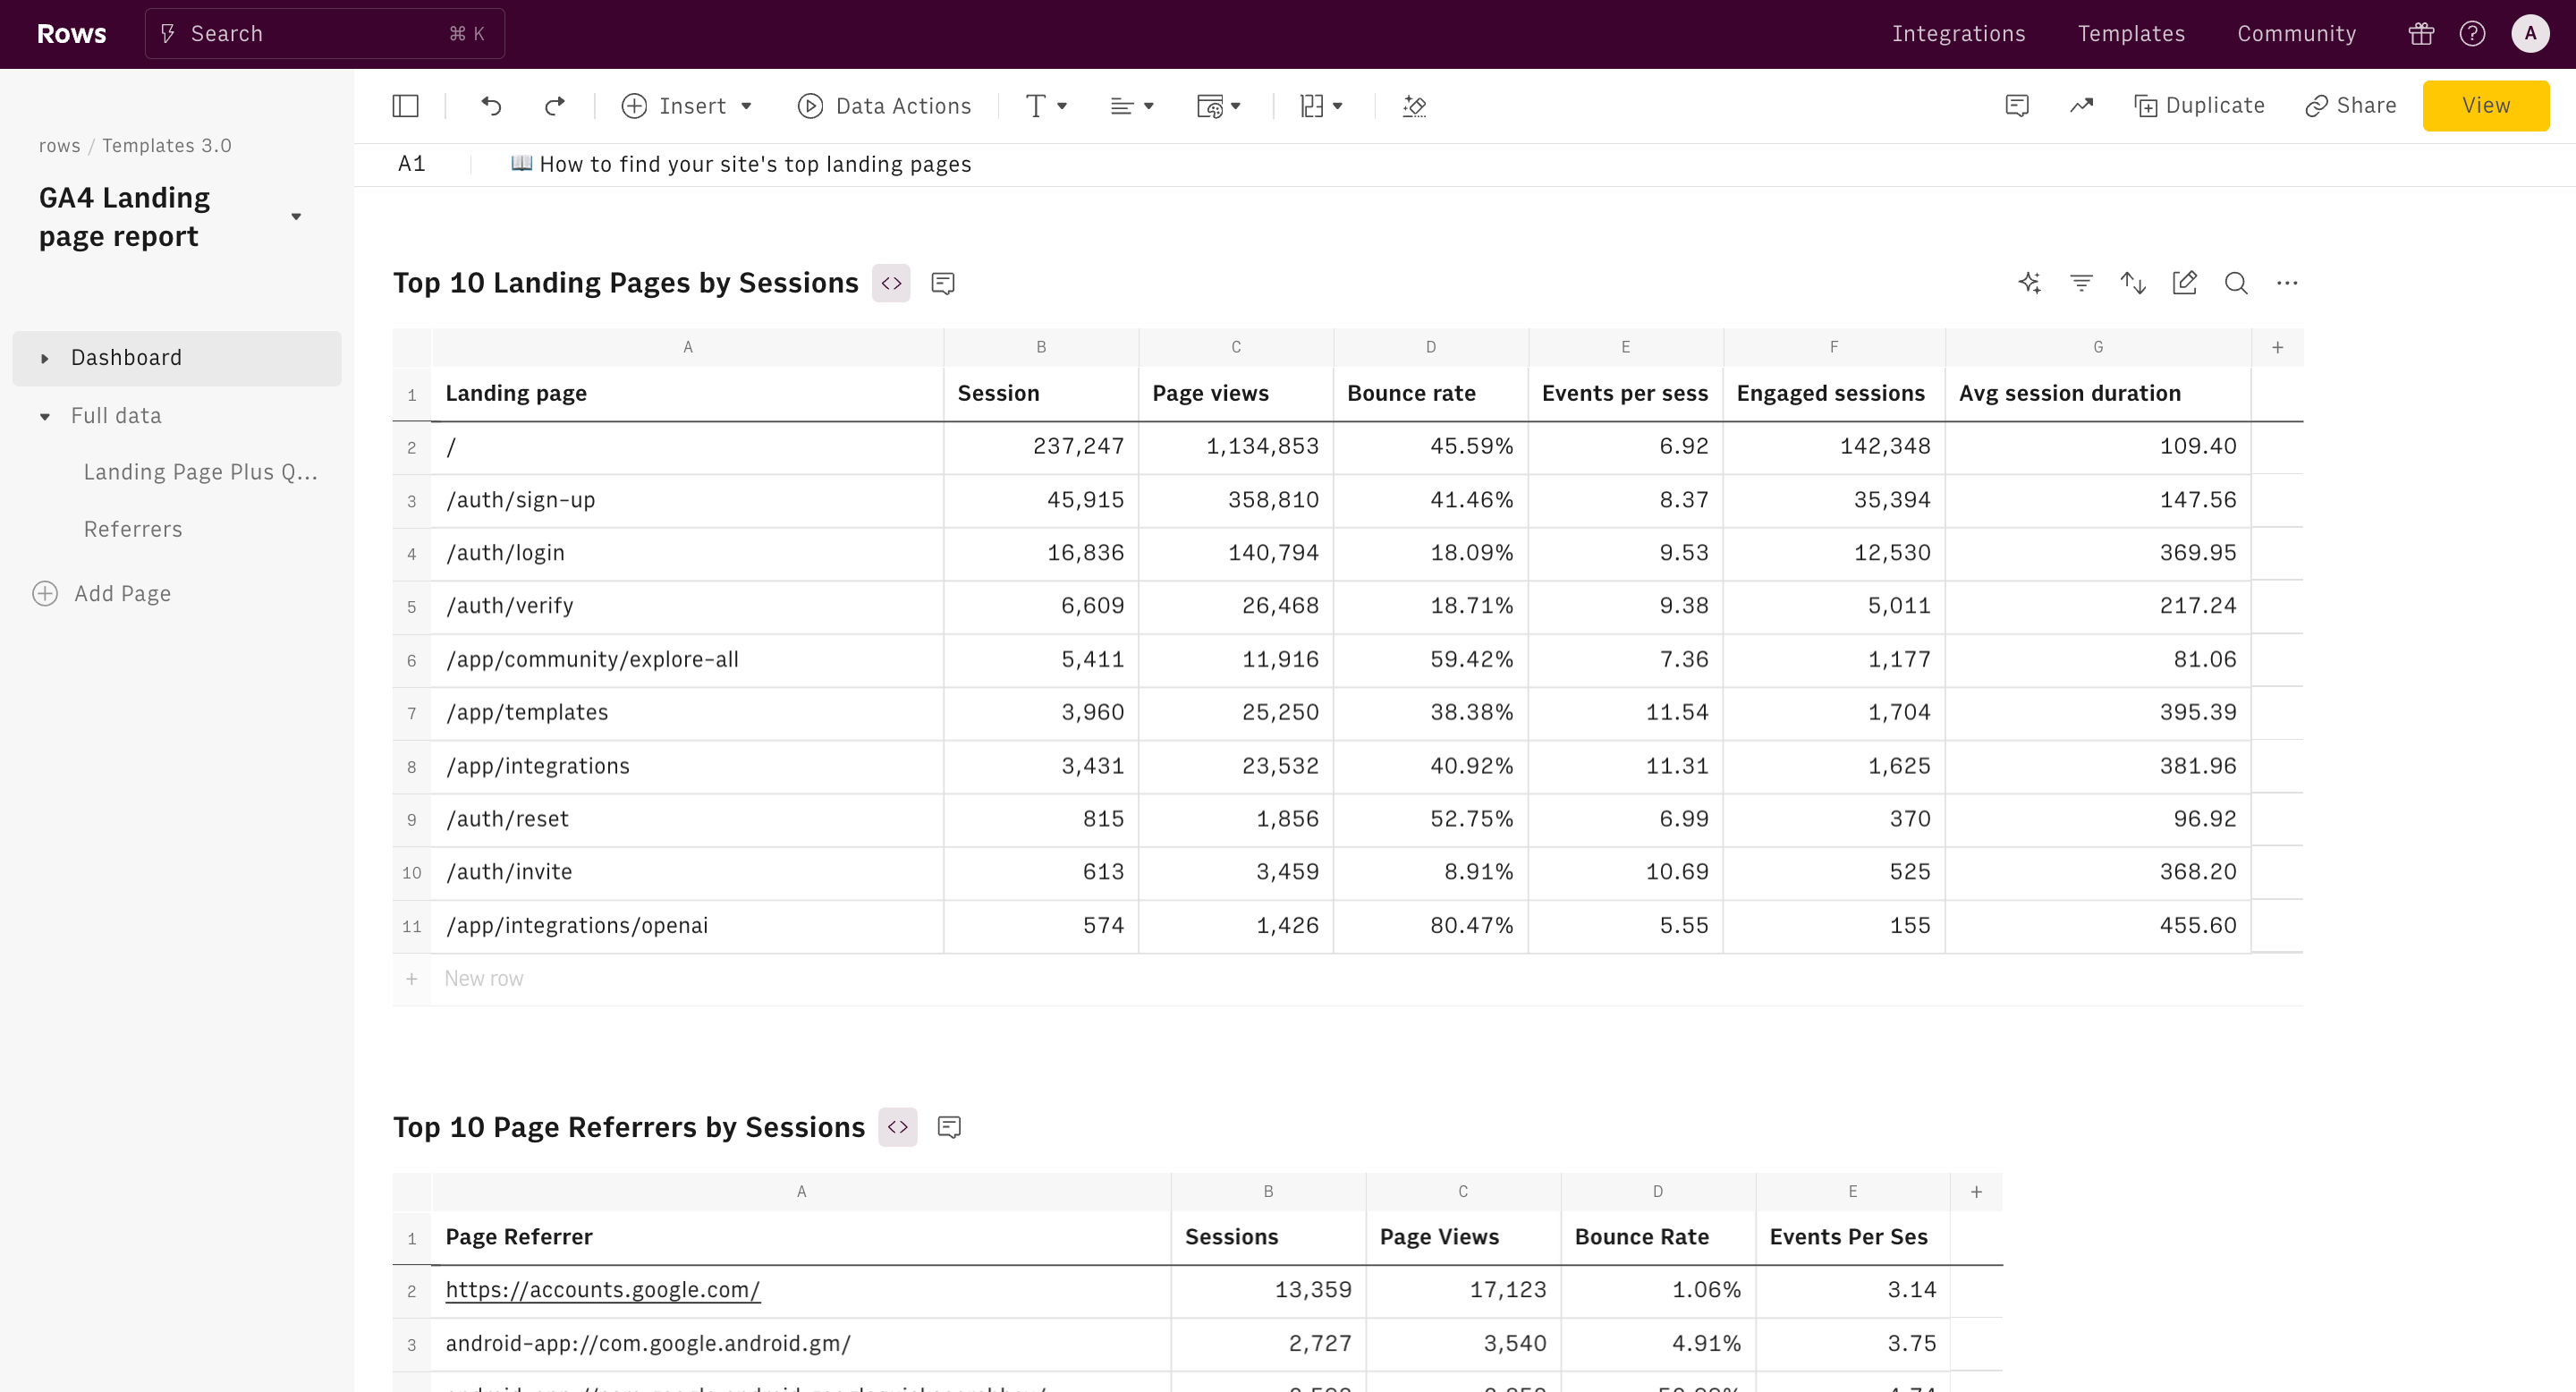
- Detailed User Metrics Table: Analyze key performance indicators such as new users, active users, engagement sessions, average engagement duration, and conversions, categorized by the first user default channel group.
- Weekly Breakdown: Gain a week-by-week perspective with the same detailed metrics, segmented by first user default channel group and by yearWeek, to track trends and seasonal impacts.
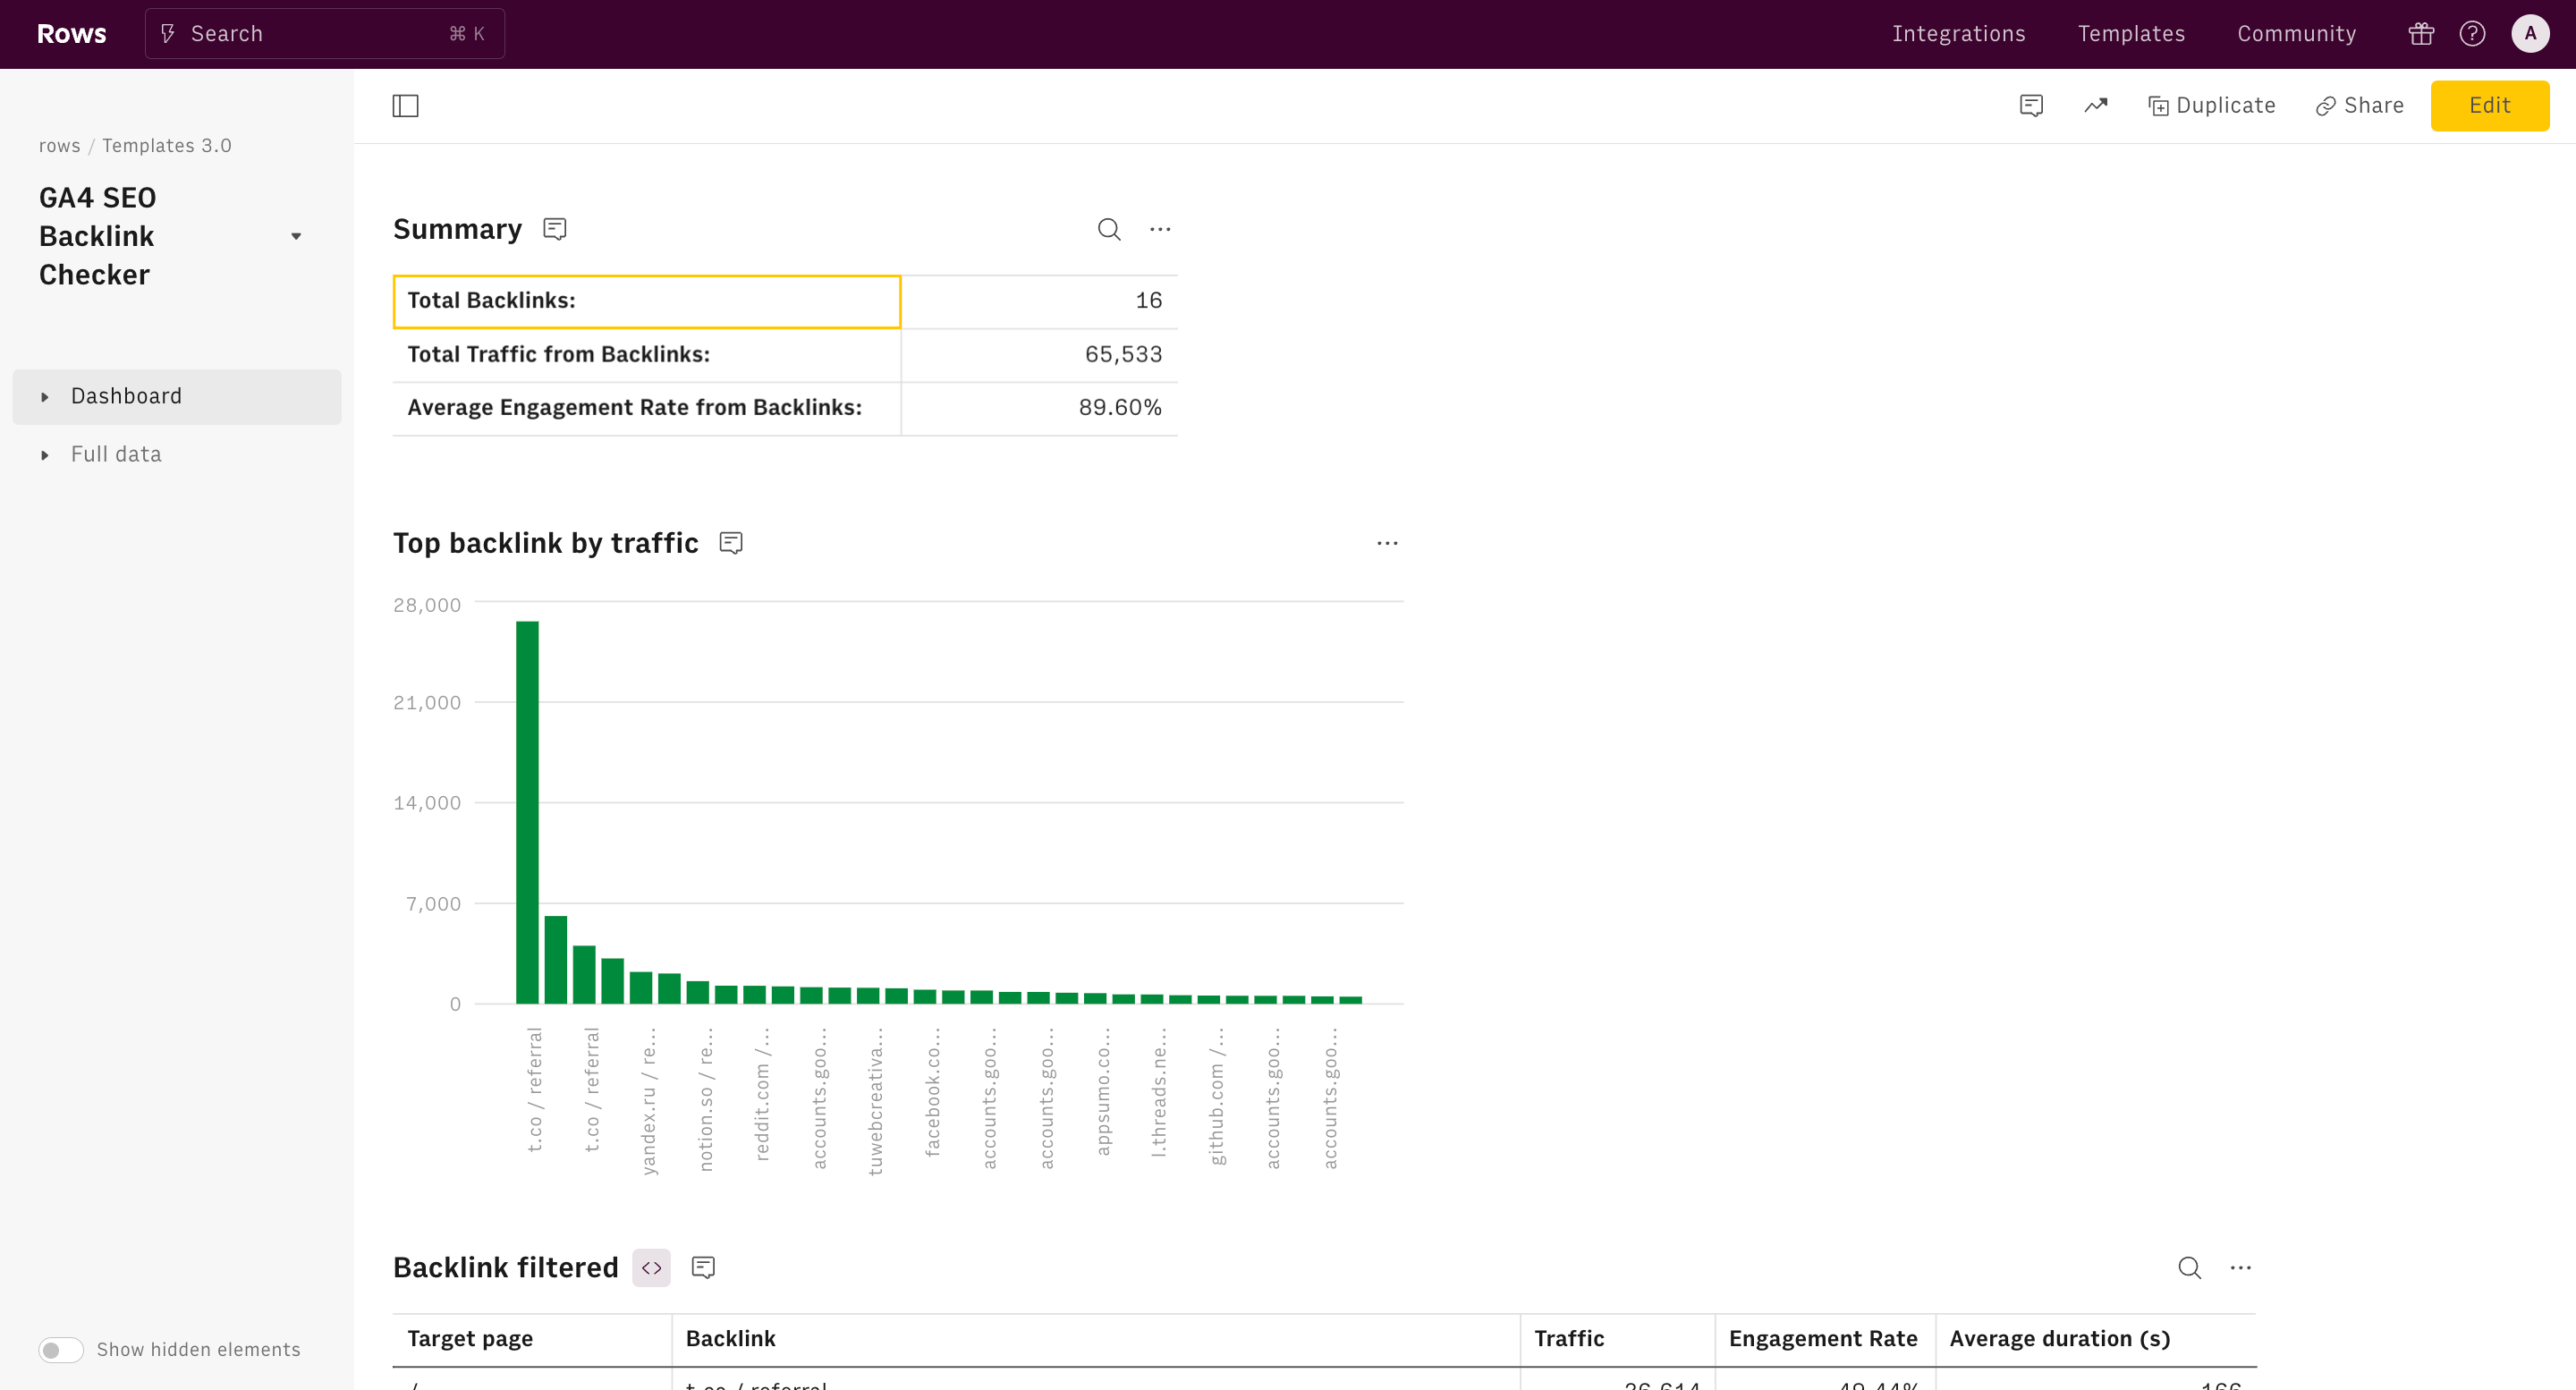
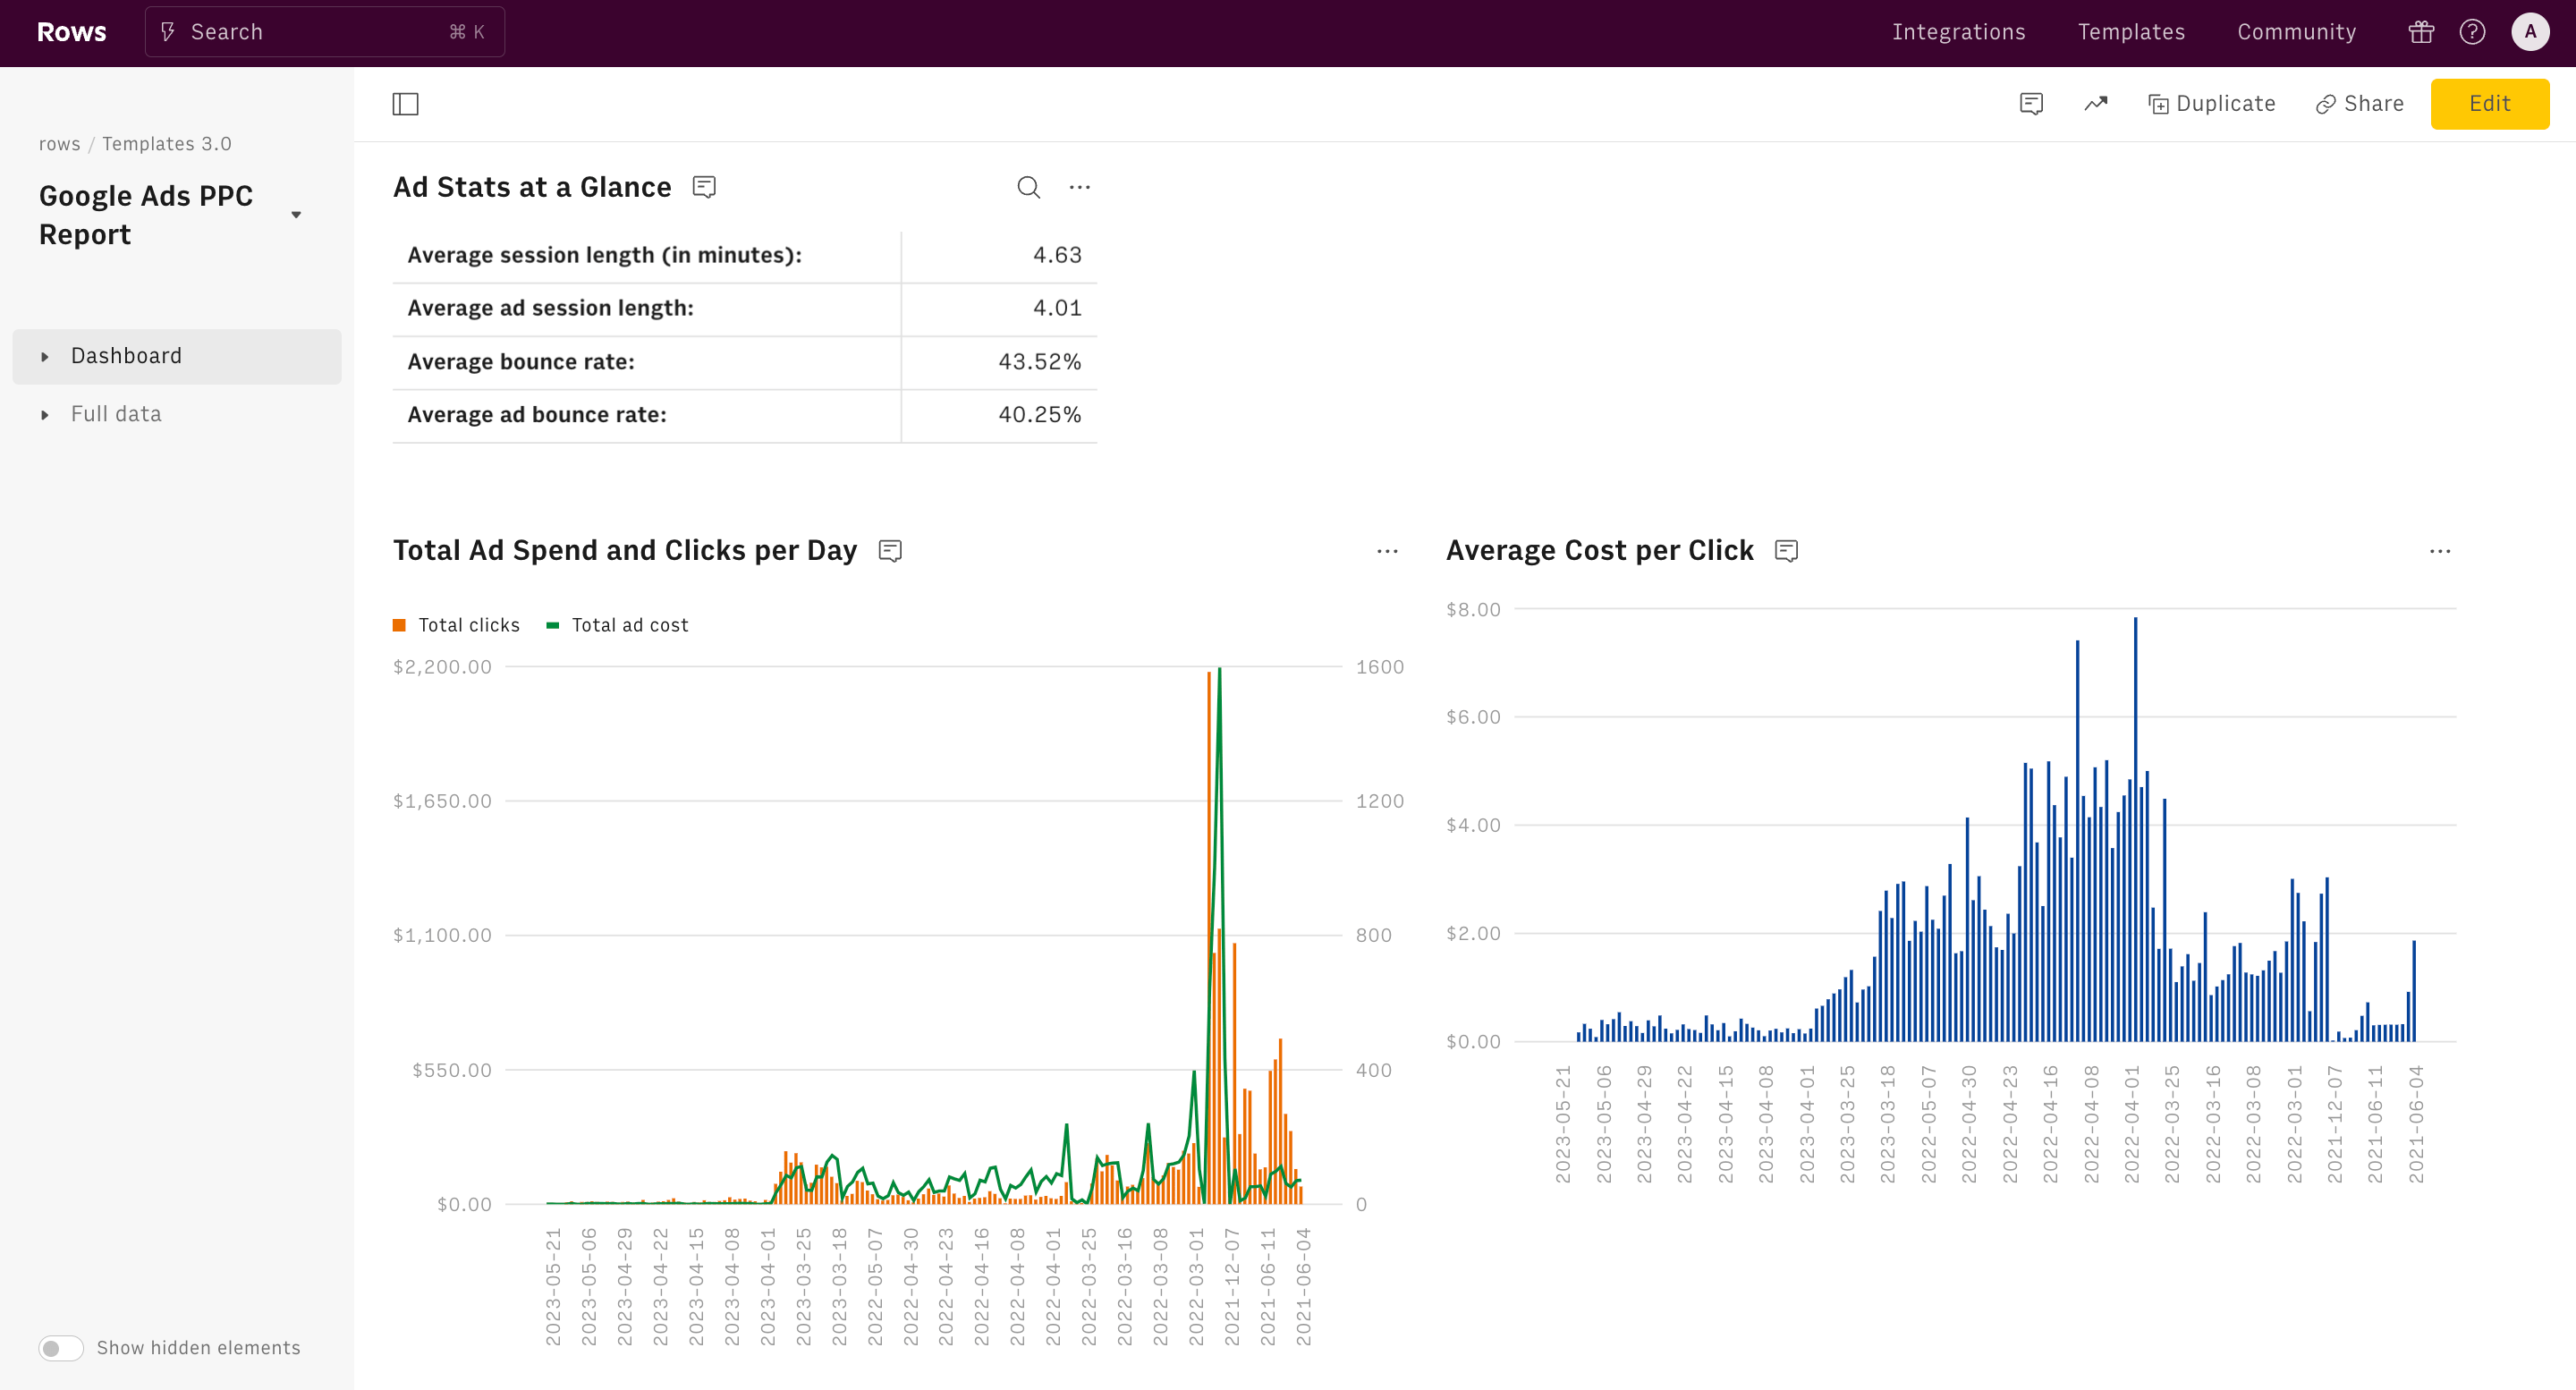
- Top Channel Group Bar Chart: Visualize the top-performing first user default channel groups with an intuitive bar chart, highlighting the channels driving the most engagement and conversions.
- Trend Analysis Line Chart: Monitor the performance of different user acquisition channels over time with a line chart, providing a clear view of how user engagement evolves weekly.
Practical Use Cases:
This GA4 User Acquisition Report template is ideal for:
- Digital Marketers: Optimize marketing campaigns by identifying the most effective acquisition channels and adjusting strategies accordingly.
- Business Analysts: Conduct detailed analysis to understand user behavior patterns and make data-backed recommendations.
- E-commerce Managers: Track the performance of different marketing channels to maximize ROI and improve customer acquisition strategies.
- Content Creators: Identify which content drives the most traffic and engagement, allowing for more targeted content creation.
Ideal Persona:
This template is perfect for data-driven professionals who need to monitor and analyze user acquisition channels regularly. Whether you're a digital marketer aiming to refine your strategies, a business analyst seeking to uncover insights, or an e-commerce manager focusing on maximizing ROI, this report provides the essential tools and data visualizations needed to drive success.
Unlock the full potential of your GA4 data with our User Acquisition Report and make informed decisions to elevate your business performance.
How it works


How it works
Get started
Click on 'Use template' and start using it right away. No forms, no signup. Your data first.
Connect your Google Analytics account
Once landed on the spreadsheet, follow the instructions to connect the required integration and pick your account.
Customize the template and schedule refresh
Once the integration has been connected, all tables will update automatically with your own data. Click on 'Edit Source' to change the retrieved data and automate the data refresh. You can then insert a chart or a pivot table, add a column or personalize formats, using all the regular functions and shortcuts that make spreadsheets great.
Embed tables and charts
Click on the option menu to embed tables and chart on your Notion, Confluence or any other iframe-ready documents.


Questions and answers
Can I use Rows for free?
More than a Google Analytics 4 User Acquisition Report
Rows is your new AI Data Analyst. It lets you extract from PDFs, import your business data, and analyze it using plain language.
Signup for free

Import your business data
Extract from PDFs and images, import from files, marketing tools, databases, APIs, and other 3rd-party connectors.
Know moreAnalyze it with AI
Ask AI✨ any question about your dataset - from VLOOKUPs to forecasting models - and surface key insights, trends, and patterns.
Know moreCollaborate and Share
Seamlessly collaborate and share stunning reports with dynamic charts, embed options, and easy export features.
Know more