Cohort analysis
Build your cohort analysis to track user retention over time.

 100% spreadsheet
 Connected to your data
 Daily+ refresh
 Embed everywhere
About Cohort analysis
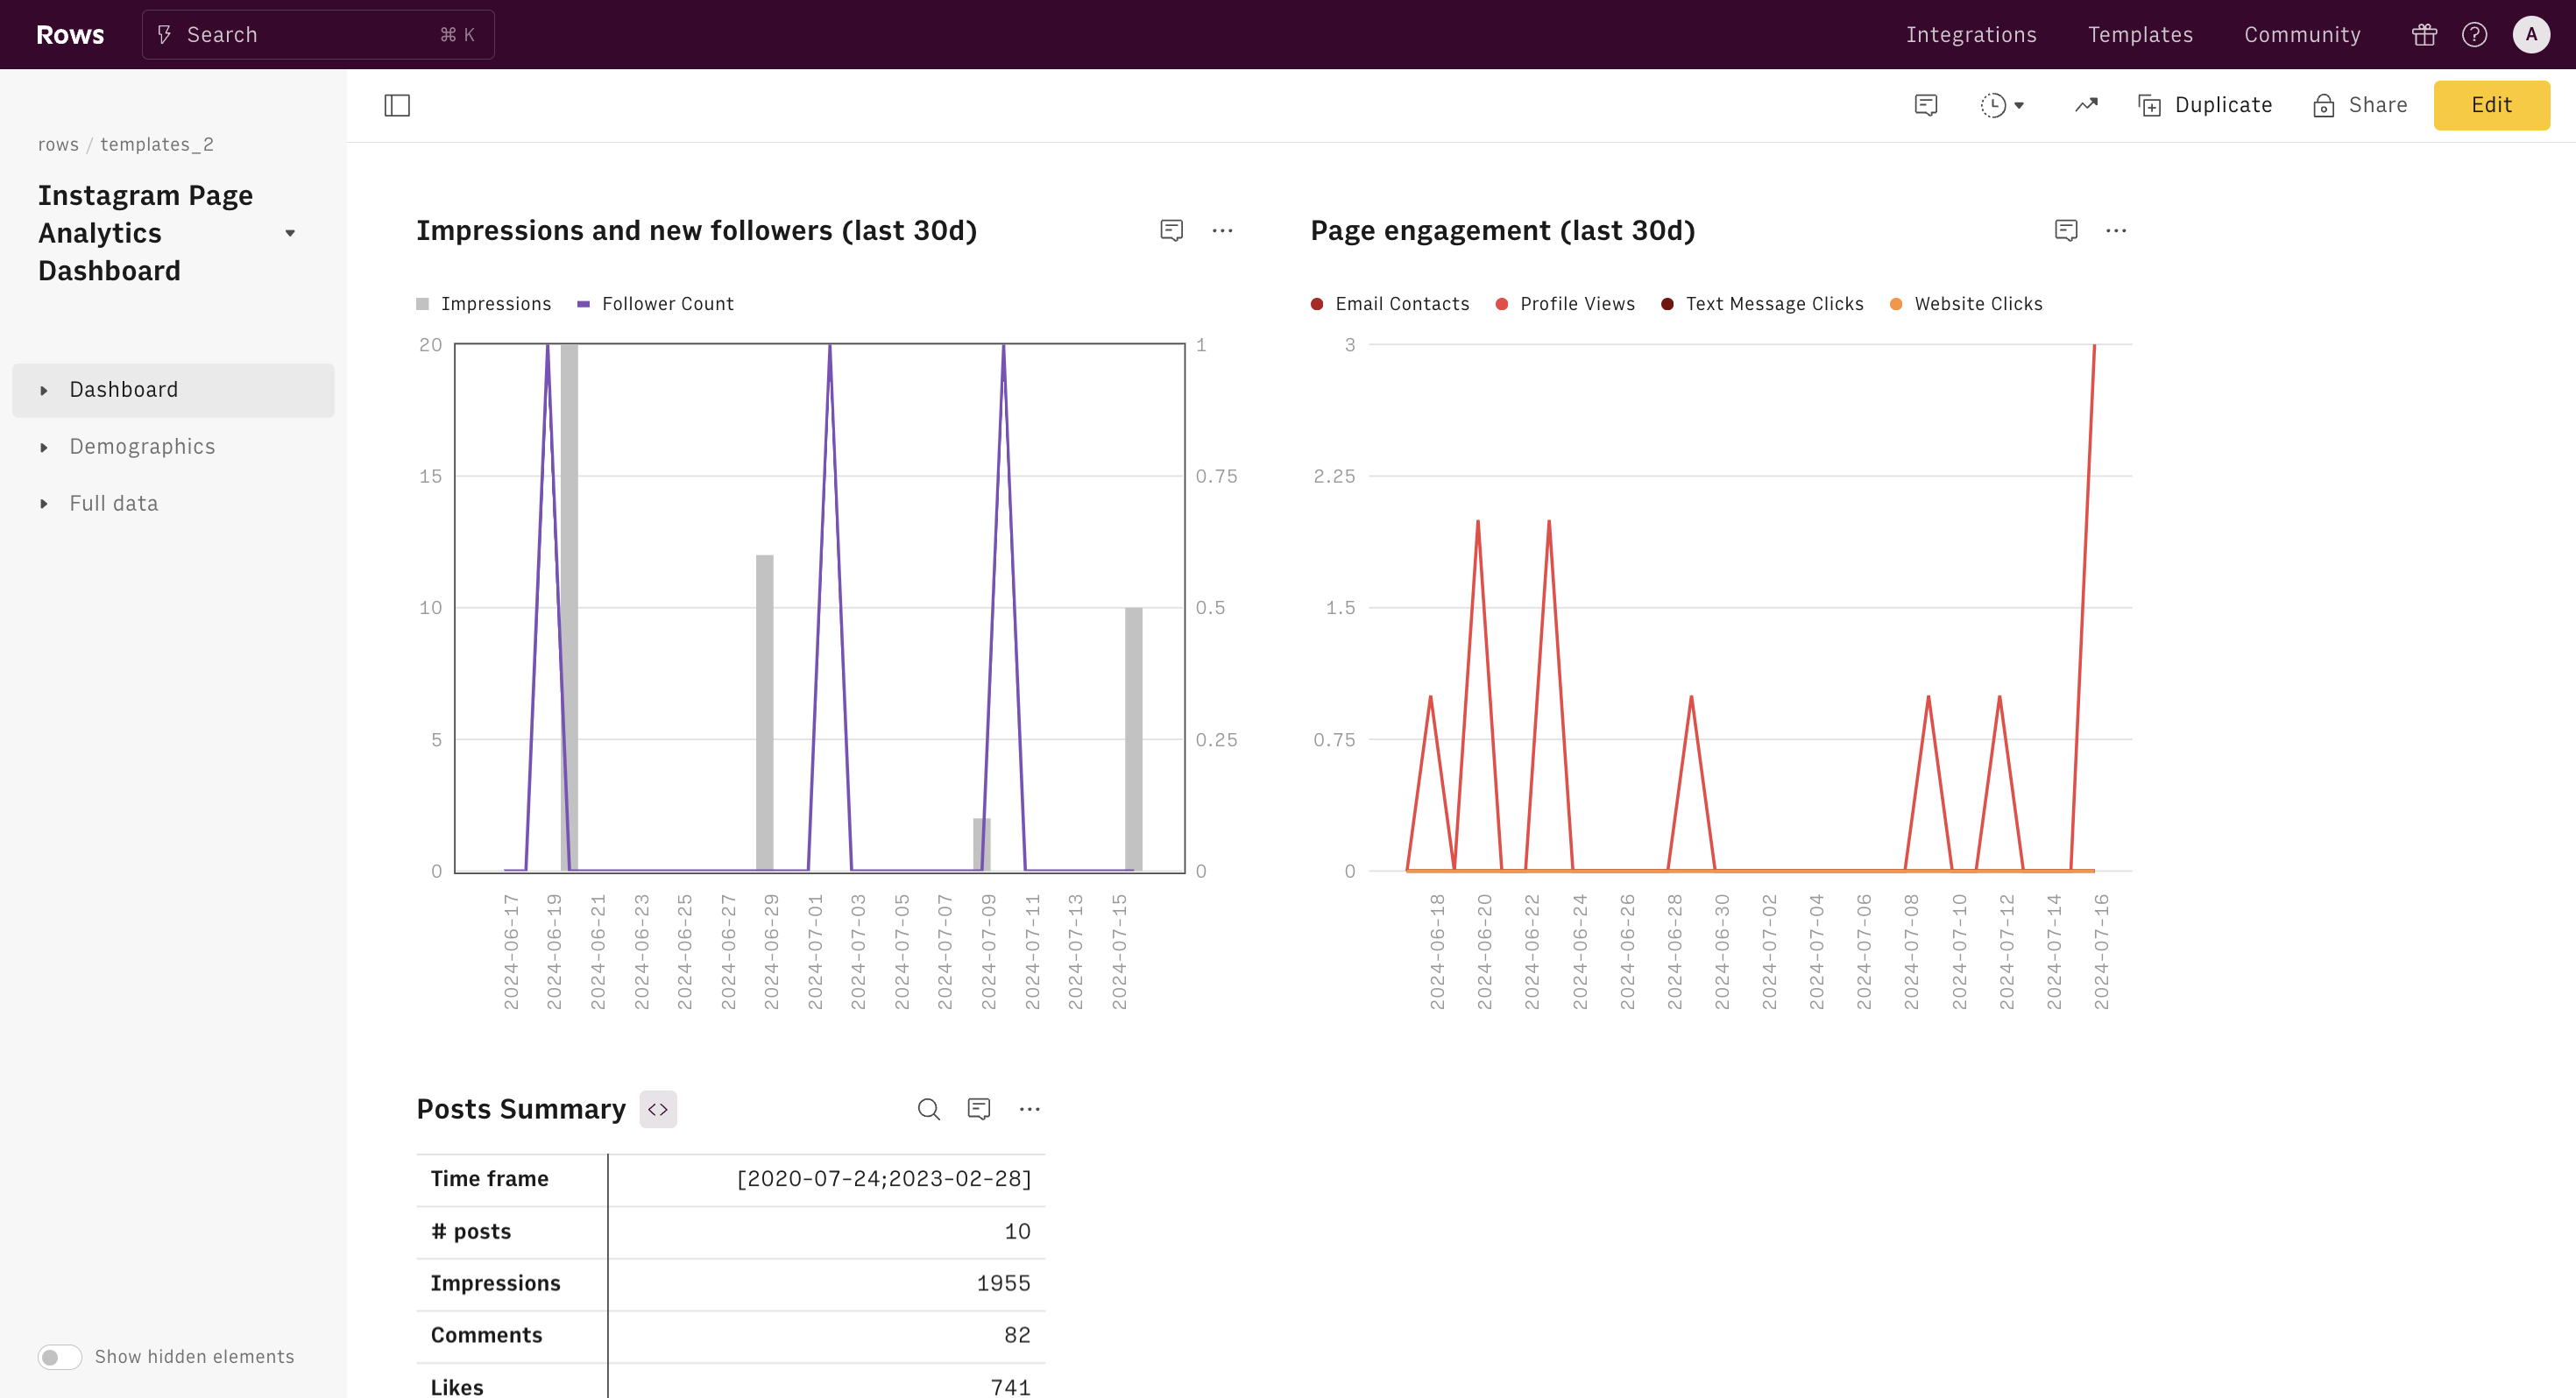
Cohort analysis is a method that allows you to track the behavior of subsets of customers that share common characteristics – referred to as cohorts – over time. In the digital world, marketers and founders use it to monitor user retention over time or compute the lifetime value (LTV) of a product.
This template employs cohorts to help you compute your customers' retention and churn rate, starting from a simple list of sales.
- List your users' purchases in the 'Sales data' table
- The spreadsheet will automatically build cohorts and track how they evolve.
How it works
How it works
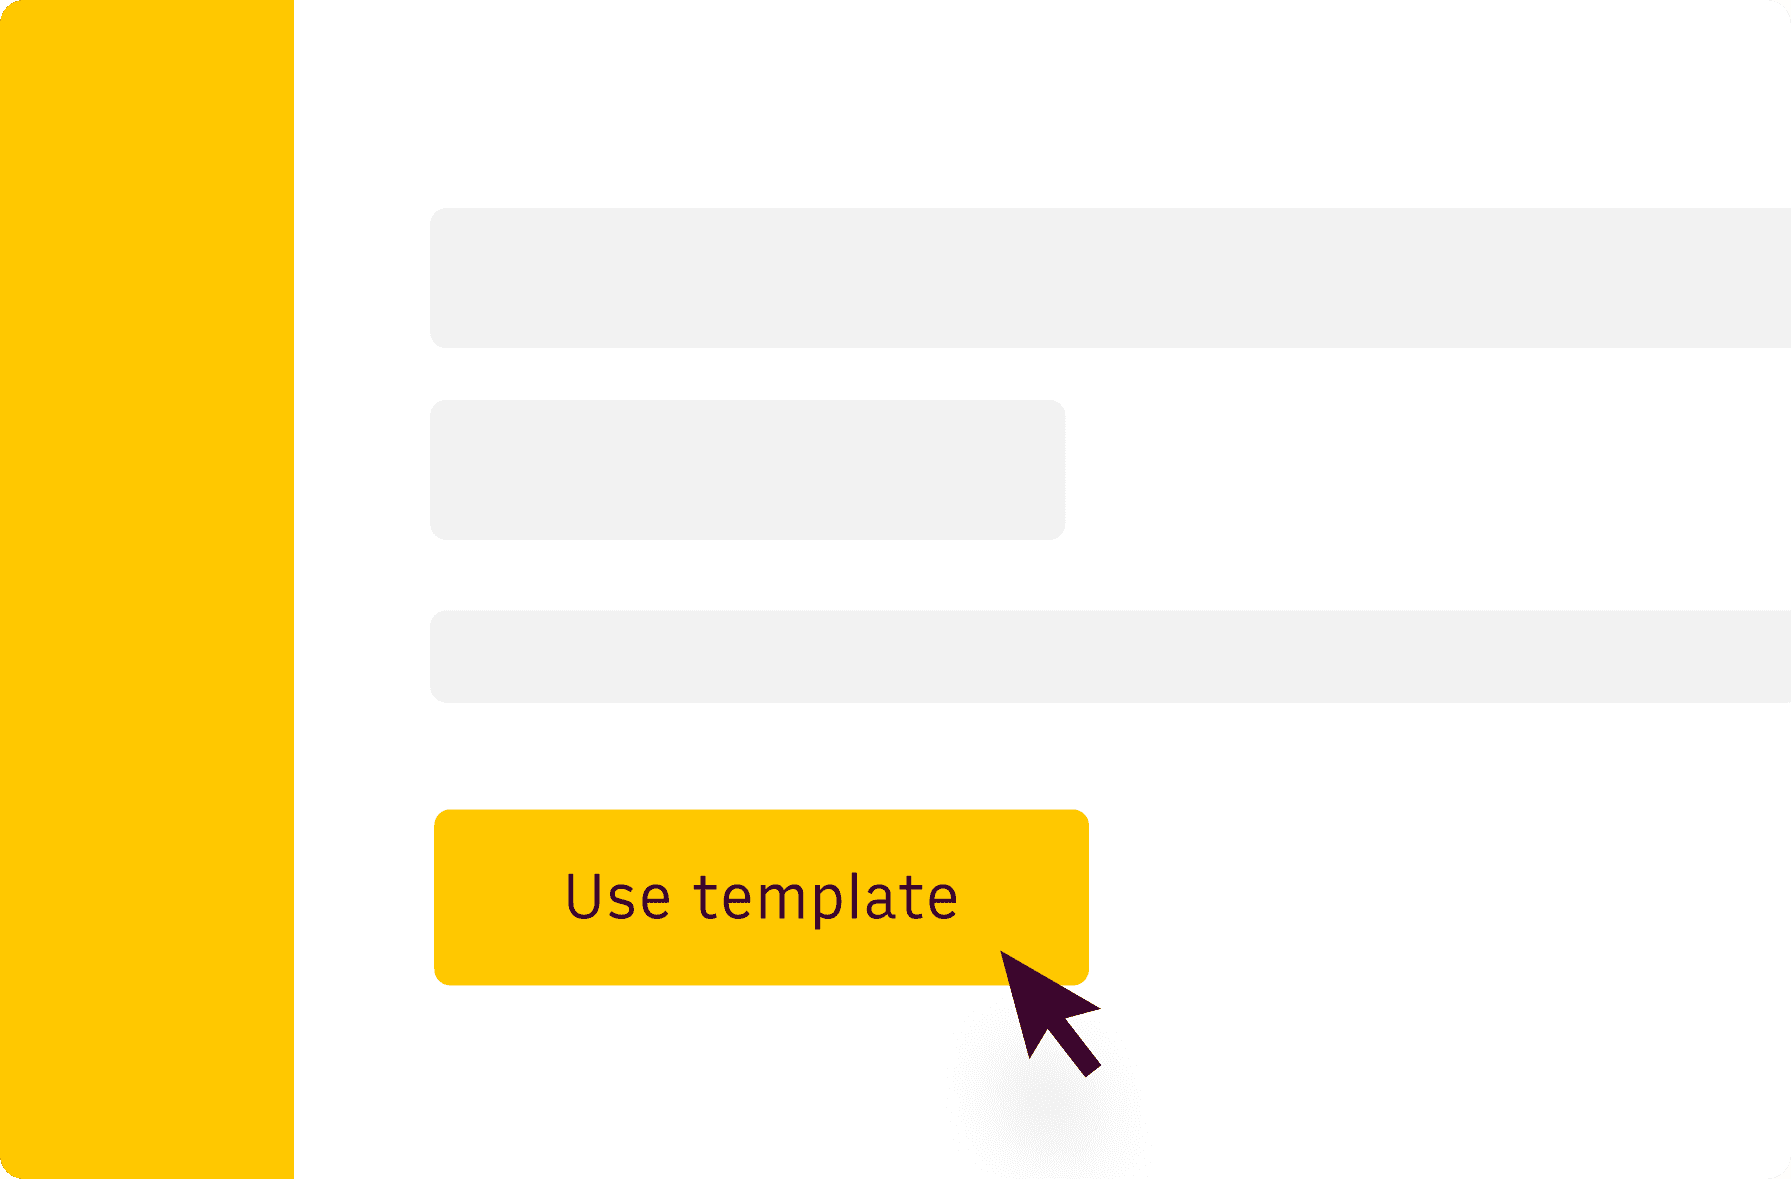
Get started
Click on 'Use template' and start using it right away. No forms, no signup. Your data first.
Customize the template
Add rows and columns to existing tables, personalize formats, insert a pivot or plot data on charts. Feel home with all the regular functions and shortcuts that make spreadsheets great.
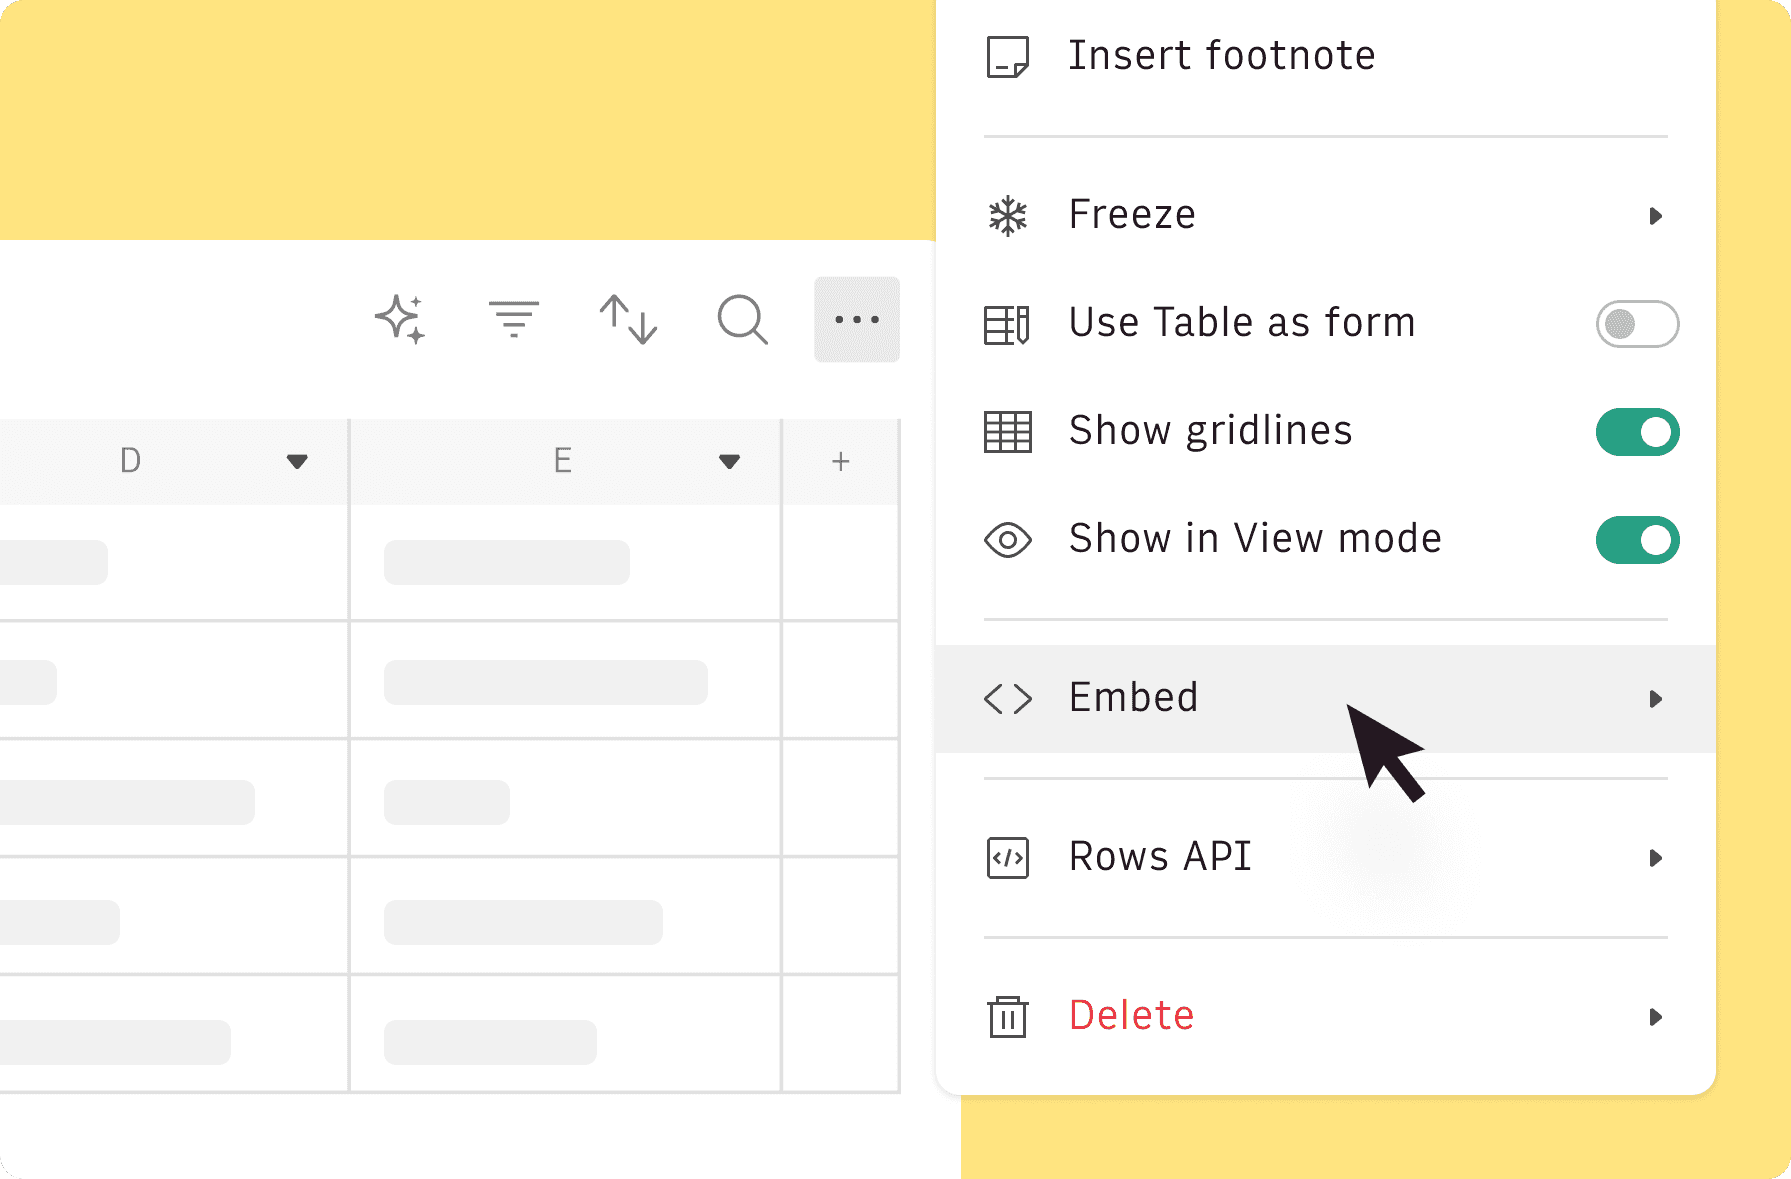
Embed tables and charts
Click on the option menu to embed tables and chart on your Notion, Confluence or any other iframe-ready documents
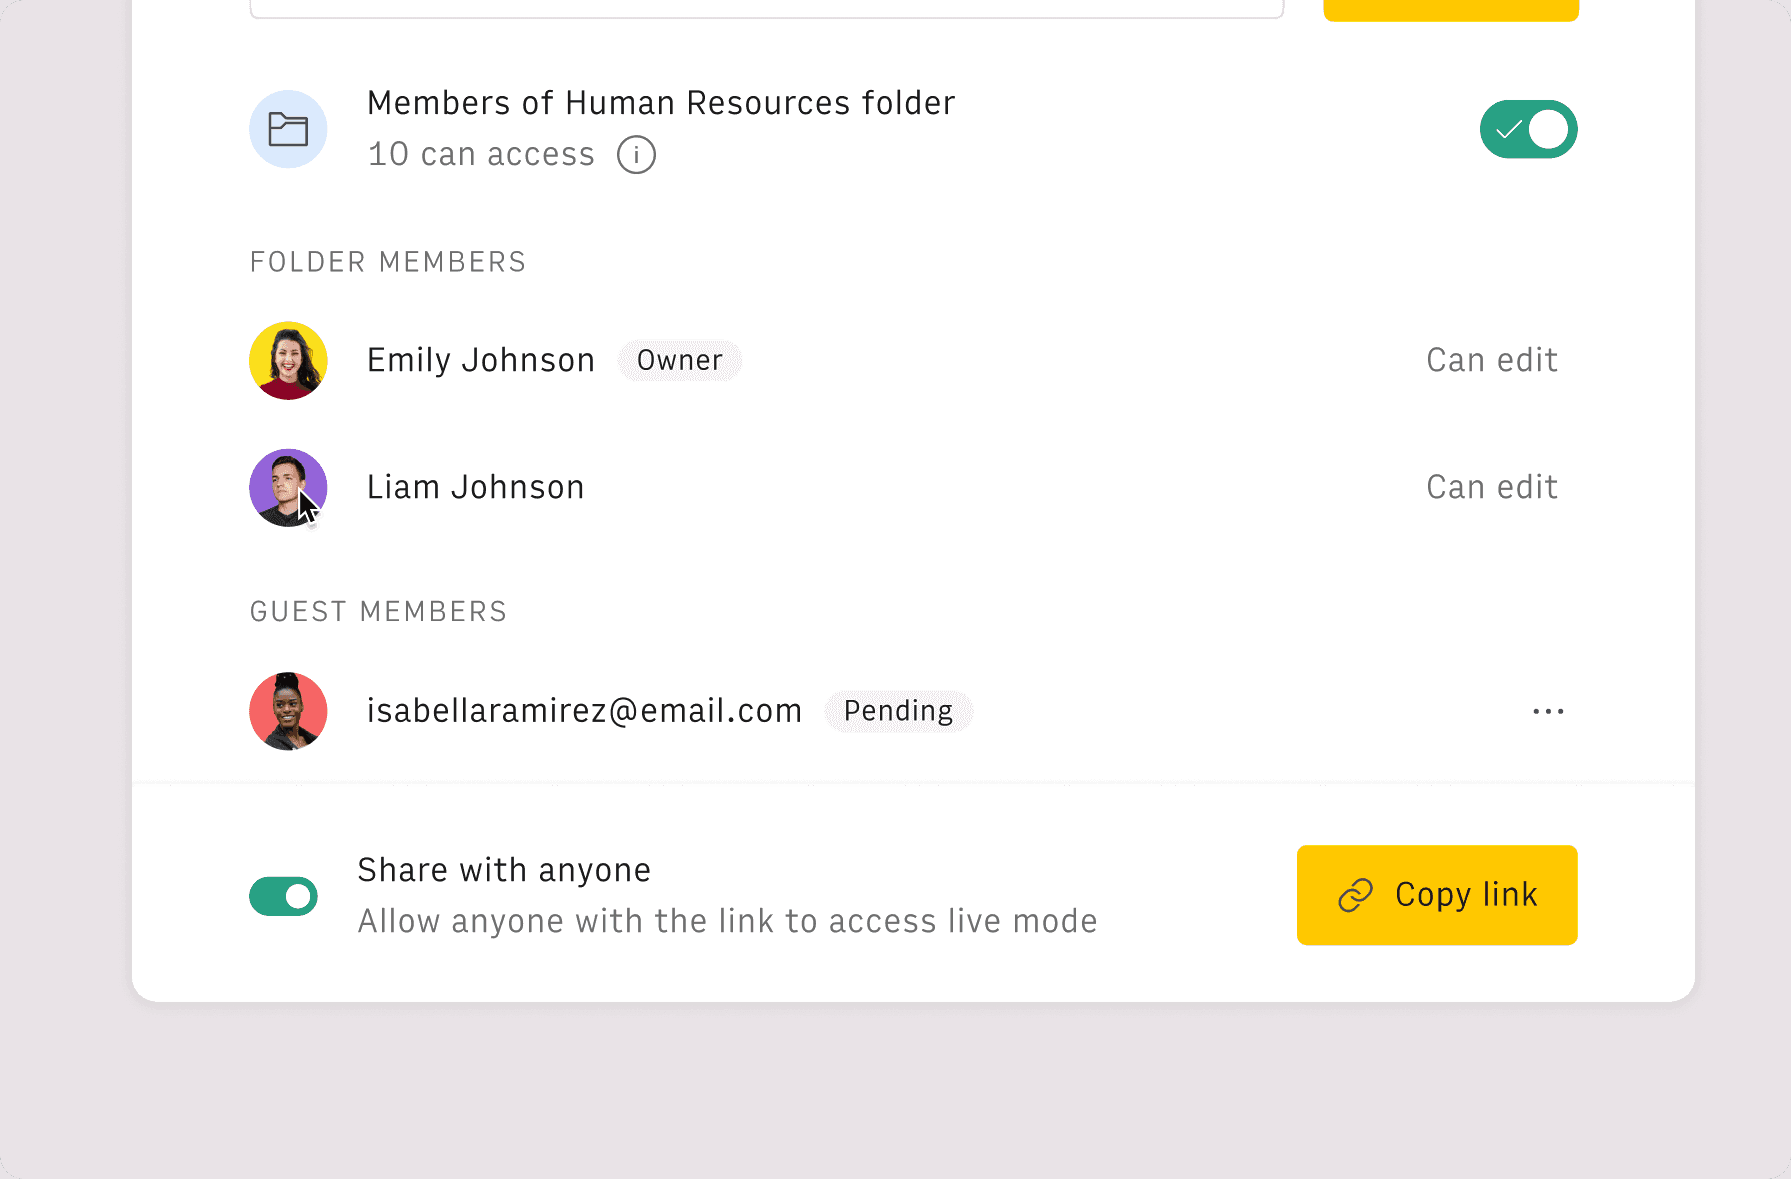
Share with your team
Click on the 'Share' button to invite your colleagues to work on the spreadsheet, or share it privately with the link.


Questions and answers
Can I use Rows for free?
More than a Cohort analysis
Rows is your new AI Data Analyst. It lets you extract from PDFs, import your business data, and analyze it using plain language.
Signup for free

Import your business data
Extract from PDFs and images, import from files, marketing tools, databases, APIs, and other 3rd-party connectors.
Know moreAnalyze it with AI
Ask AI✨ any question about your dataset - from VLOOKUPs to forecasting models - and surface key insights, trends, and patterns.
Know moreCollaborate and Share
Seamlessly collaborate and share stunning reports with dynamic charts, embed options, and easy export features.
Know more