Balance Sheet Ratios
Delve into the balance sheets analysis of any listed company.

 100% spreadsheet
 Connected to your data
 Daily+ refresh
 Embed everywhere
About Balance Sheet Ratios
What is a Balance Sheet Analysis?
Balance sheet analysis is the process of examining a company's financial position at a specific point in time. It involves looking at the company's assets, liabilities, and equity to assess its financial health and stability.
This analysis helps us understand if a company can pay its bills, its financial stability, and how it pays for its operations. It's comparable to assessing an individual's financial portfolio, including liquid assets, outstanding liabilities, and long-term investments, but applied on a larger scale to evaluate a company's overall financial position.
This analysis provides insights into a company's financial resilience, growth potential, and possible challenges. The information derived is important for potential investors, lending institutions evaluating creditworthiness, and management teams developing strategic plans. While the balance sheet offers significant insights, it's most effective when used along with other financial statements to provide an overview of a company's financial health and performance.
The Balance Sheet Equation
The fundamental principle of a balance sheet is the equation:
Assets = Liabilities + Equity
This equation shows that everything a company owns (assets) is balanced against its obligations (liabilities) and the owners' stake (equity).
Let's imagine a small bakery. It owns $17,000 worth of assets, including equipment (e.g. an oven), cash, and raw materials (e.g. ingredients). The bakery owes $9,000 in loans and unpaid bills (liabilities), and the owner's stake (equity) is $8,000 (e.g. the money the owner put initially to start up the business).
When we add the liabilities and equity, we get $17,000 – exactly matching the assets. This simple example shows how the balance sheet equation works: Assets ($17,000) = Liabilities ($9,000) + Equity ($8,000). It demonstrates that everything the bakery owns is accounted for by what it owes and the owner's investment.
How Do You Interpret a Balance Sheet?
Interpreting a balance sheet involves examining the relationships between different elements. You'll look at the company's liquidity, leverage, and overall financial structure through the help of ratios.
How Do You Analyze a Balance Sheet?
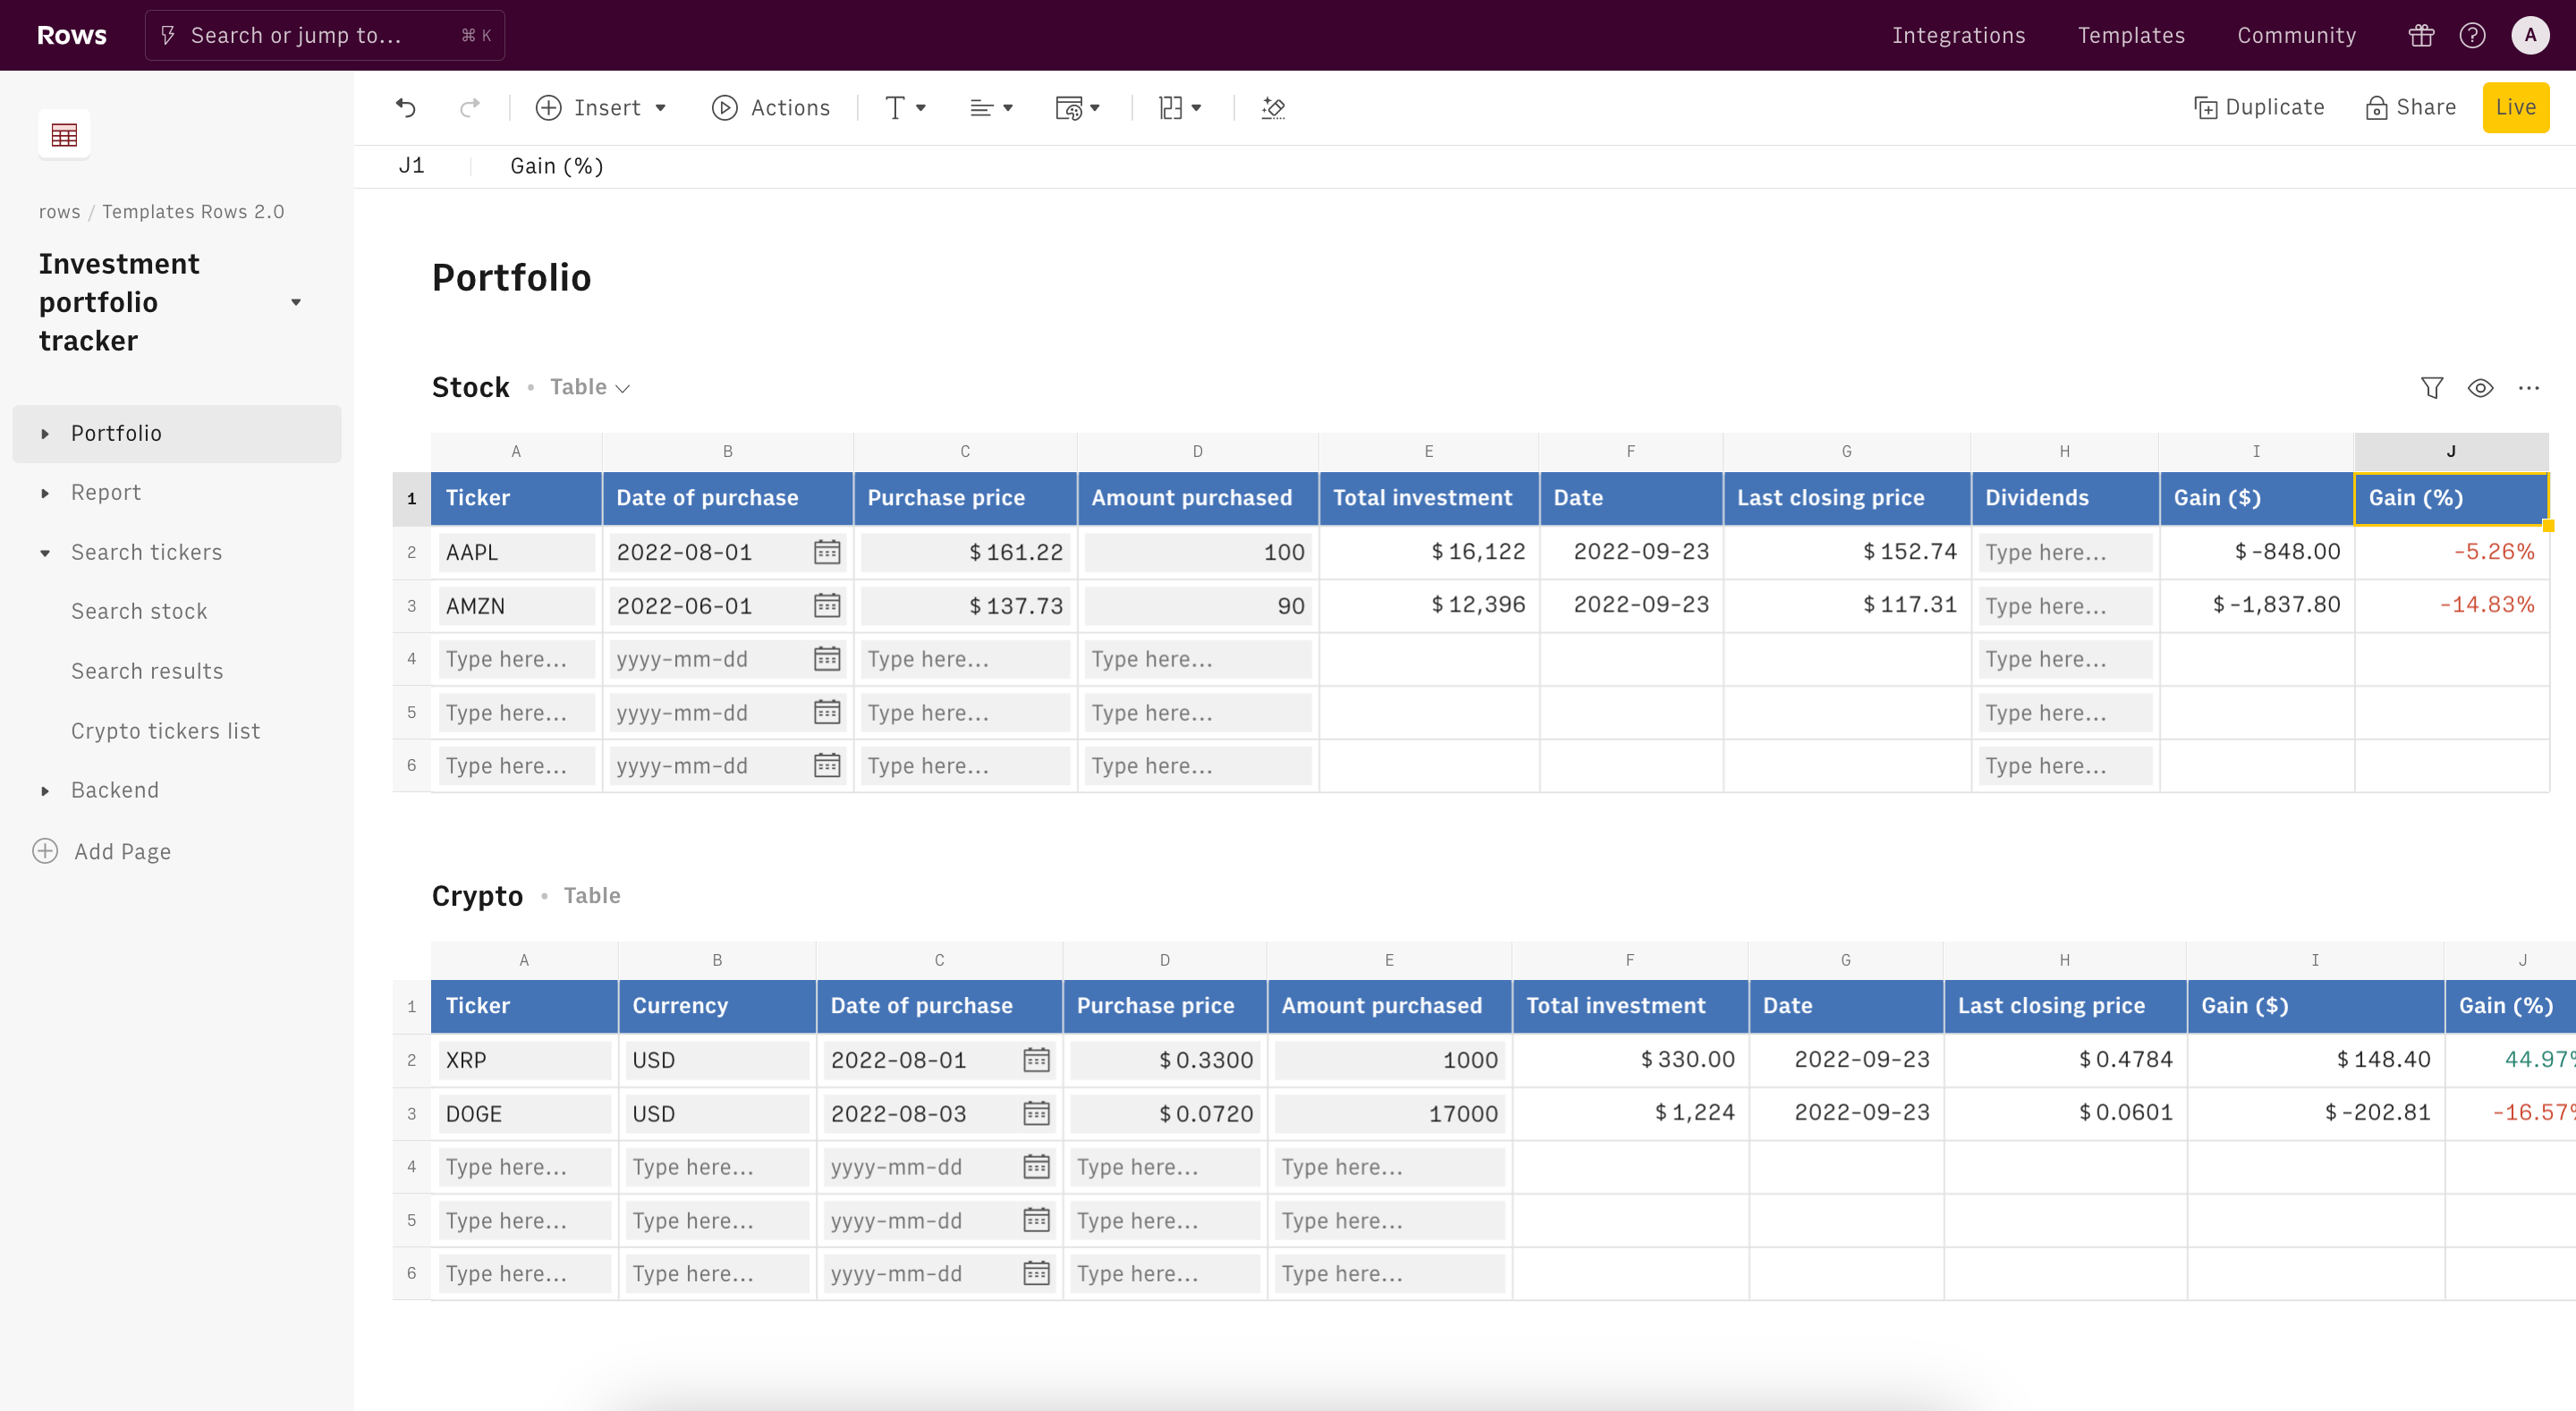
Our Balance Sheet Ratios template simplifies the analysis process:
Access the template and connect to the Alpha Vantage integration. No account is needed.
Choose a company ticker. A ticker is a unique symbol representing a company's stock (e.g., MSFT for Microsoft, AAPL for Apple).
The template automatically pulls data, including the full balance sheet and ratio table.
This user-friendly approach allows you to quickly generate insights into any listed company's financial position, enabling data-driven decision-making and deeper financial understanding.
What Are Financial Ratios?
Financial ratios are the Key Performance Indicators of a company's financial performance and position. They're calculated using numbers from financial statements, including the balance sheet.
Key Types of Financial Ratios
There are several types of financial ratios, each providing different insights:
- Liquidity ratios: These measure a company's ability to meet short-term obligations.
- Leverage ratios: These show how much a company relies on debt financing.
- Efficiency ratios: These indicate how well a company uses its assets and manages its liabilities.
- Profitability ratios: These assess a company's ability to generate earnings relative to its revenue, assets, or equity.
Most Important Ratios for Understanding a Balance Sheet
Here are key ratios derived from the balance sheet:
- Current Ratio: Shows if a company can pay its short-term debts with its short-term assets.
- Quick Ratio (Acid-Test Ratio): Measures if a company can pay its immediate debts without selling inventory.
- Debt to Equity Ratio: Compares how much a company owes to how much its owners have invested.
- Debt Ratio: Provides information on what portion of a company's assets are financed by debt.
- Equity Ratio: Indicates how much of a company's assets are owned outright by shareholders.
- Working Capital: Represents the money available for day-to-day operations.
These ratios provide insights into a company's liquidity, solvency, and overall financial structure.
Why Analyze a Balance Sheet?
Analyzing a balance sheet helps investors, creditors, and management understand a company's financial position. It reveals the company's ability to pay its debts, its reliance on outside financing, and how efficiently it uses its resources. This information is crucial for making informed investment decisions, assessing creditworthiness, and identifying areas for financial improvement.
For investors, studying a balance sheet is similar to checking a company's financial fitness. It helps them decide if putting money into the company is a good idea. They can see if the company has enough cash to cover its expenses, how much it owes compared to what it owns, and whether it's growing or facing challenges. This knowledge helps investors gauge if the company is likely to be profitable or if it might be too risky.
For company leaders, the balance sheet acts as a financial guide. It points out the company's strong areas and where it needs work. If the balance sheet shows too much unsold inventory, for example, managers might plan a sale. If it shows a lot of available cash, they might think about expanding or buying new equipment. By keeping an eye on the balance sheet, managers can make smart choices to keep the company financially healthy and on a growth path.
How it works


How it works
Get started
Click on 'Use template' and start using it right away. No forms, no signup. Your data first.
Connect AlphaVantage
Once landed on the spreadsheet, follow the instructions to connect the required integration and pick your account.
Customize the template and schedule refresh
Once the integration has been connected, all tables will update automatically with your own data. Click on 'Edit Source' to change the retrieved data and automate the data refresh. You can then insert a chart or a pivot table, add a column or personalize formats, using all the regular functions and shortcuts that make spreadsheets great.
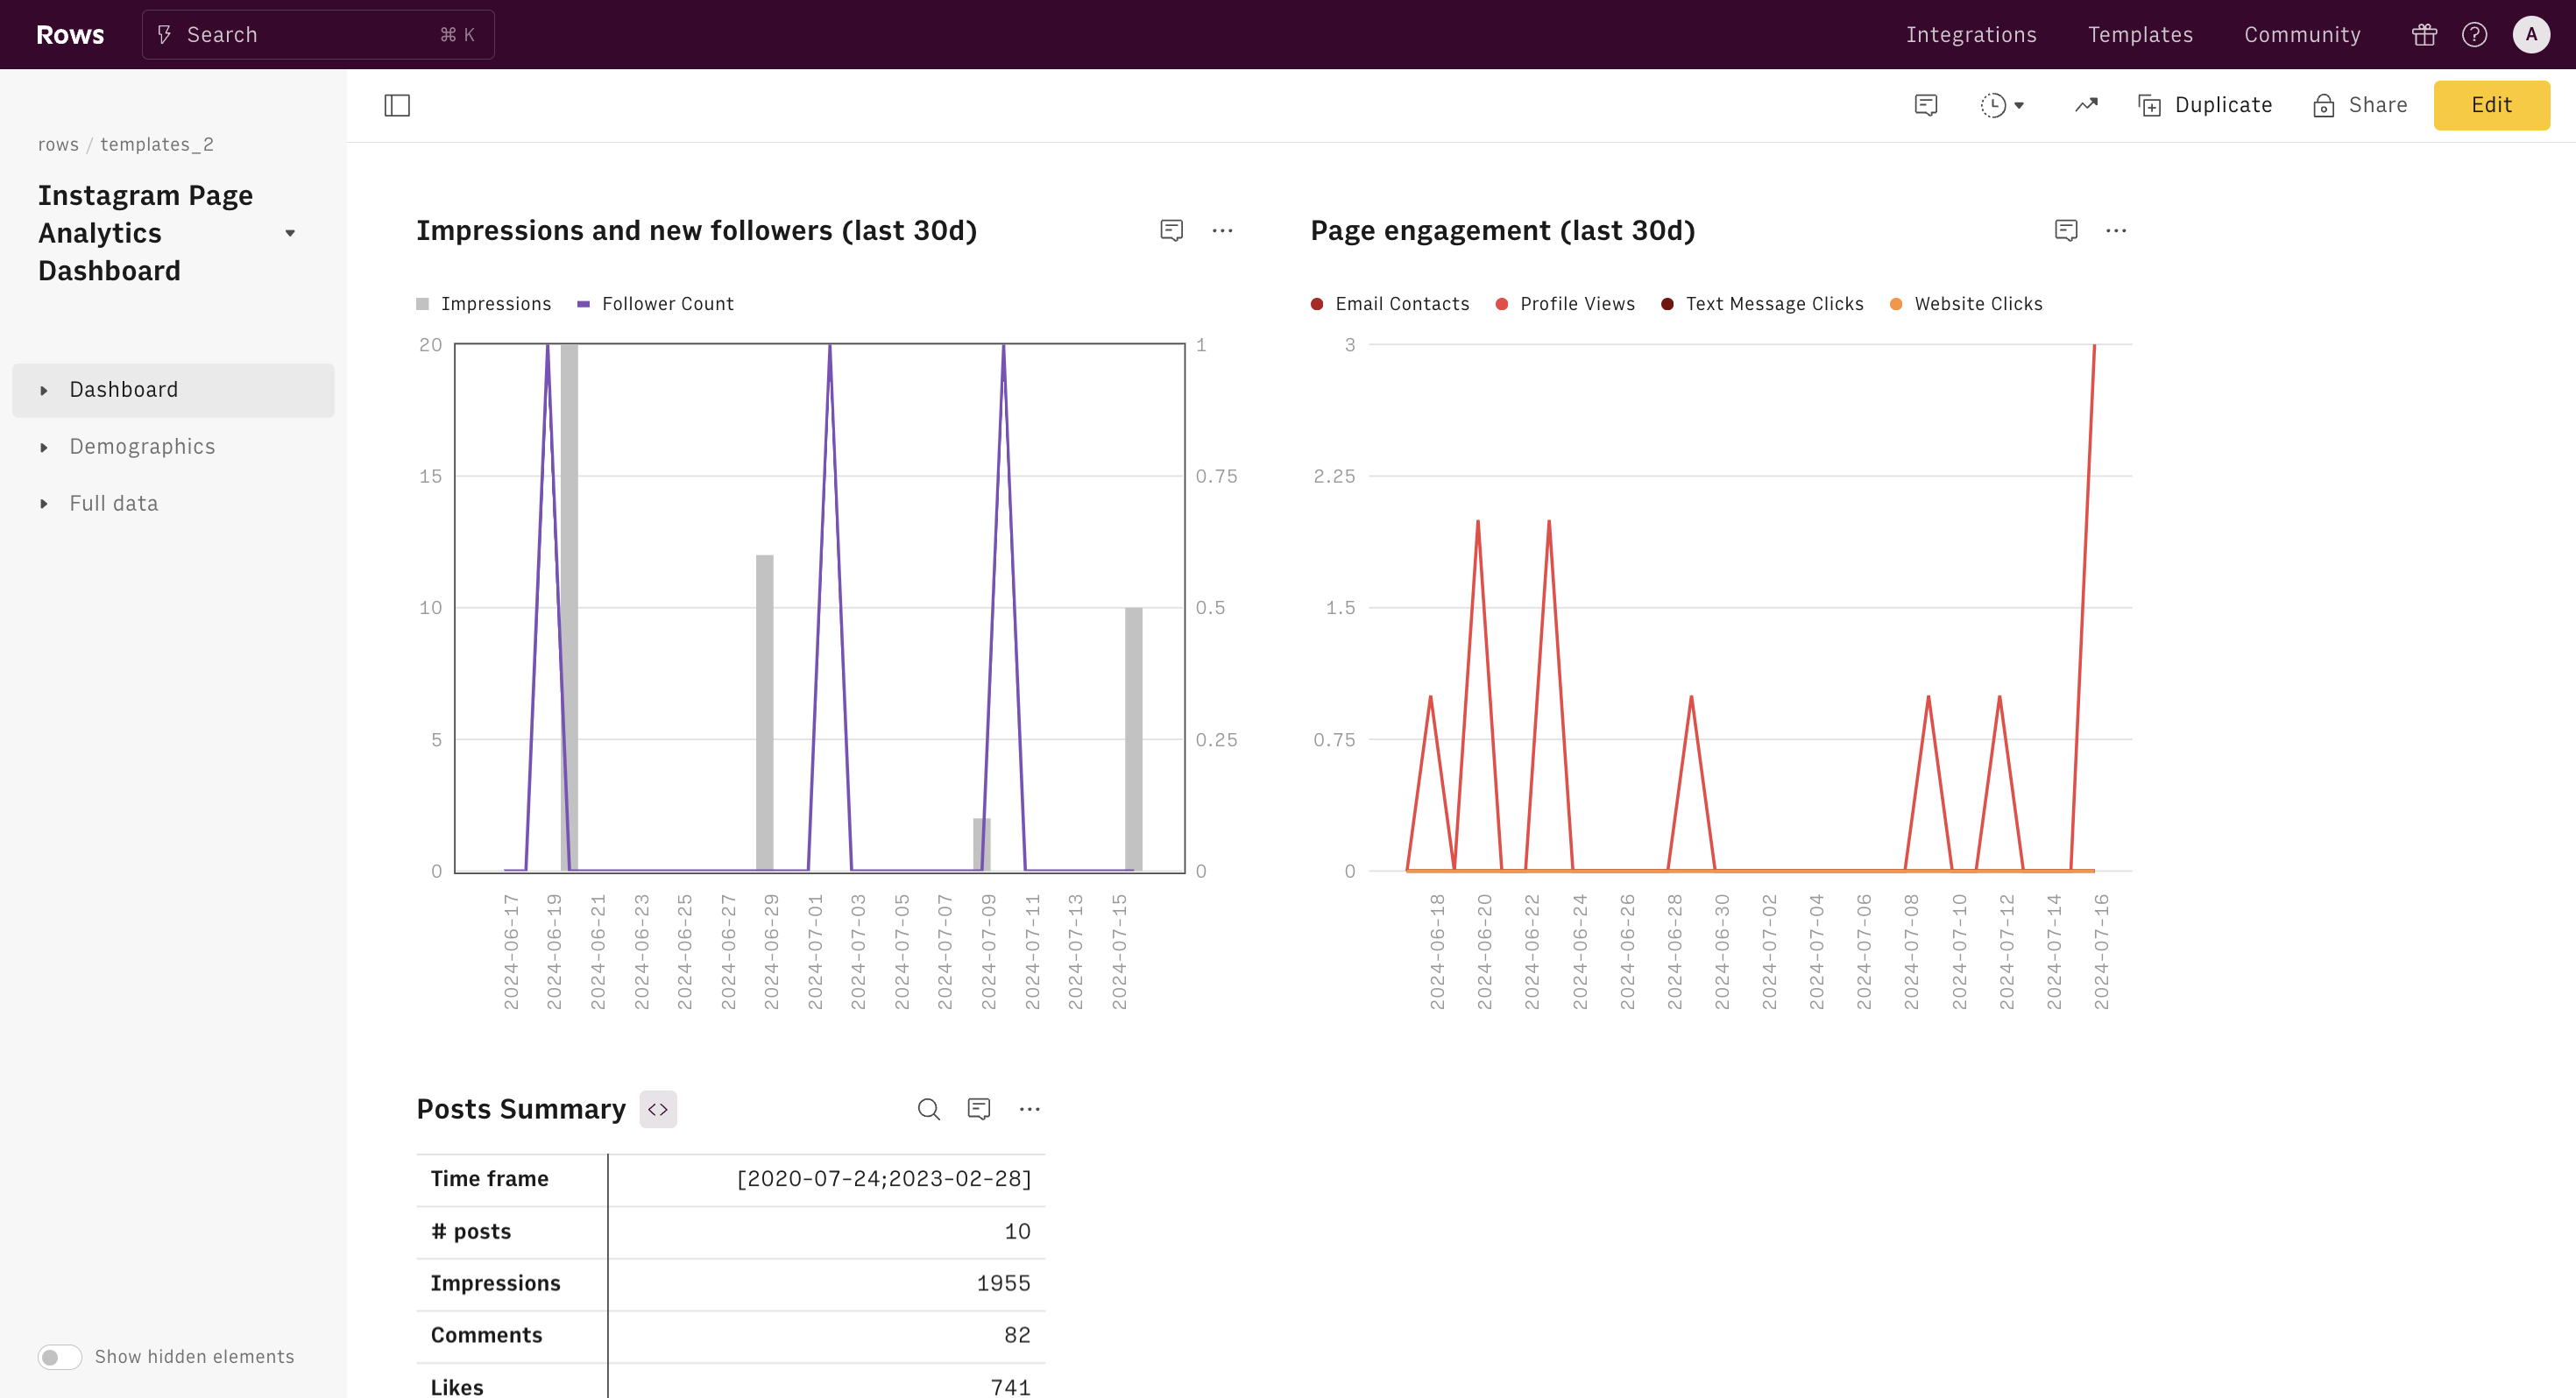
Embed tables and charts
Click on the option menu to embed tables and chart on your Notion, Confluence or any other iframe-ready documents.


Questions and answers
Can I use Rows for free?
More than a Balance Sheet Ratios
Rows is your new AI Data Analyst. It lets you extract from PDFs, import your business data, and analyze it using plain language.
Signup for free

Import your business data
Extract from PDFs and images, import from files, marketing tools, databases, APIs, and other 3rd-party connectors.
Know moreAnalyze it with AI
Ask AI✨ any question about your dataset - from VLOOKUPs to forecasting models - and surface key insights, trends, and patterns.
Know moreCollaborate and Share
Seamlessly collaborate and share stunning reports with dynamic charts, embed options, and easy export features.
Know more