About Profitability Report
What is Profitability Analysis?
Profitability analysis can be defined as the process of evaluating a company's ability to generate profit relative to its revenue, assets, and equity.
This analysis helps investors, analysts, and managers understand how efficiently a company converts sales into profits.
What Does a Profitability Report Show?
A profitability report provides an overview of a company's financial performance. It includes the following aspects:
- Key financial ratios
- Income statement analysis
- Trends over time
How to Prepare a Profitability Report with Our Template
Our Rows-powered template simplifies the process of creating a detailed profitability report. Here's how it works:
Access the template and follow the instructions to connect the Alpha Vantage integration. No account is required.
Choose a company ticker. A ticker is a unique series of letters representing a company's stock (e.g., MSFT for Microsoft, AAPL for Apple).
The template automatically pulls data from the integration, including the full income statement and ratio table.
With this user-friendly approach, you can quickly generate insightful profitability reports for any listed company, enabling data-driven decision-making and deeper financial understanding.
Understanding US GAAP Standards
US GAAP (Generally Accepted Accounting Principles) is the standard framework of guidelines for financial accounting in the United States. It ensures consistency and comparability in financial reporting across companies.
Think of US GAAP as the rulebook for financial reporting in the United States. It's like a common language that all companies use to tell their financial stories.
The Financial Accounting Standards Board (FASB) writes and updates these rules, but they're not rigid - there's room for accountants to use their judgment. GAAP covers everything from how companies record their sales to how they report their assets.
This shared approach means that when you're looking at profitability reports from different companies, you're comparing apples to apples. It's what allows investors and analysts to make sense of financial statements and truly understand how well a company is performing.
Top 7 Profitability Ratios
These key profitability metrics offer valuable insights into a company's financial health:
1. Gross Profit Margin
Formula: (Revenue - Cost of Goods Sold) / Revenue It measures the percentage of revenue retained after accounting for direct production costs.
2. Operating Profit Margin
It indicates the percentage of profit a company generates from its operations before interest and taxes.
3. Net Profit Margin
It reveals the percentage of revenue that translates into profit after all expenses are deducted.
4. EBIT Margin
It reflects earnings before interest and taxes as a percentage of revenue.
5. EBITDA Margin
It shows earnings before interest, taxes, depreciation, and amortization as a percentage of revenue.
6. Return on Sales (ROS)
It measures how efficiently a company turns sales into profits.
7. Sales to Expense Ratio
It indicates how well a company manages its expenses relative to its sales.
Why Analyze Profitability Ratios?
Profitability ratios provide crucial insights into a company's financial performance, operational efficiency, and potential for growth. They help investors and analysts make informed decisions and allow managers to identify areas for improvement.
Think of profitability ratios as a company's financial report card. They show how well a business is doing at making money from its day-to-day operations. These ratios help everyone from investors to managers understand if a company is healthy and growing, or if it's struggling.
They're great for comparing different companies, even if they're not in the same industry. By looking at these numbers over time, you can see if a company is getting better at turning its sales into profit or if it's facing challenges.
For investors, these ratios help decide if a company is a smart place to put money. For managers, they point out where the business might need some work.
In short, profitability ratios are like a financial health check-up, giving a clear picture of how well a company is performing where it matters most - making money.
How it works

How it works
Get started
Click on 'Use template' and start using it right away. No forms, no signup. Your data first.
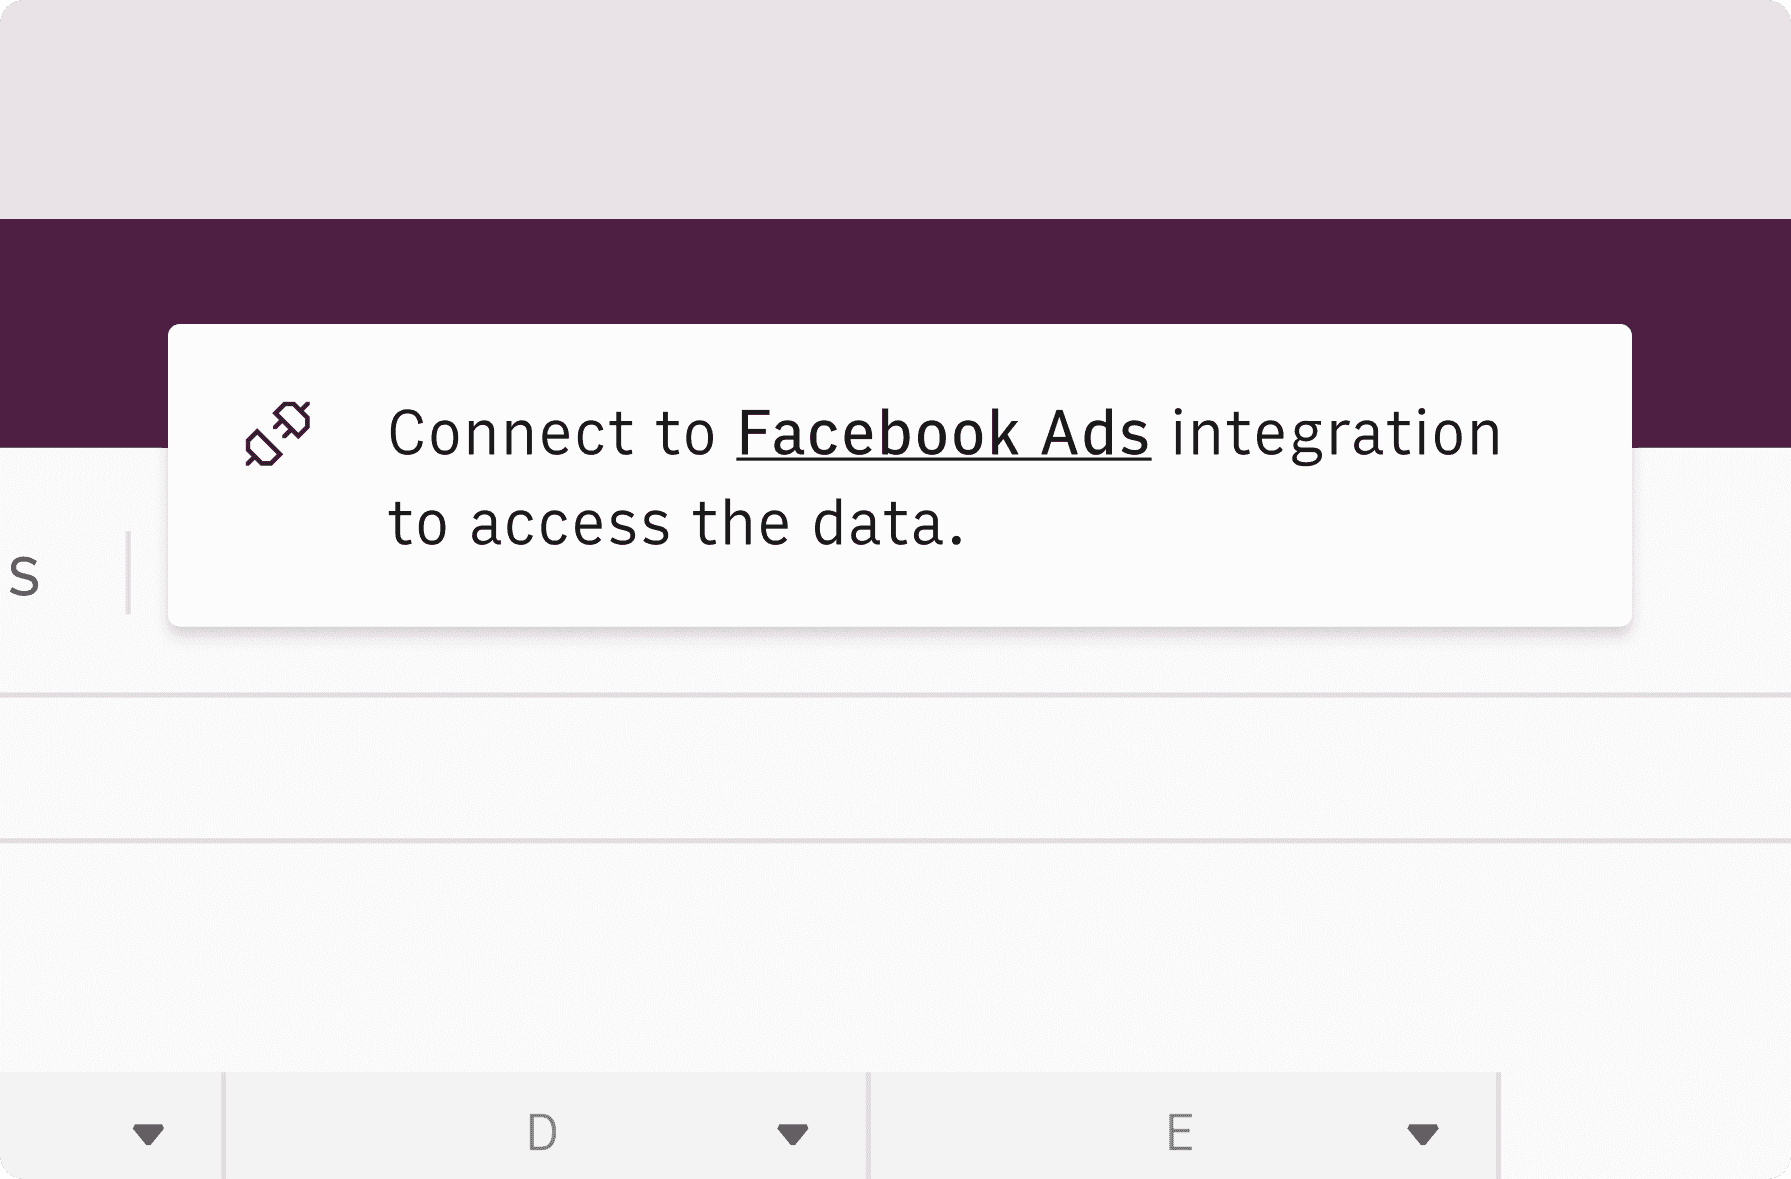
Connect AlphaVantage
Once landed on the spreadsheet, follow the instructions to connect the required integration and pick your account.
Customize the template and schedule refresh
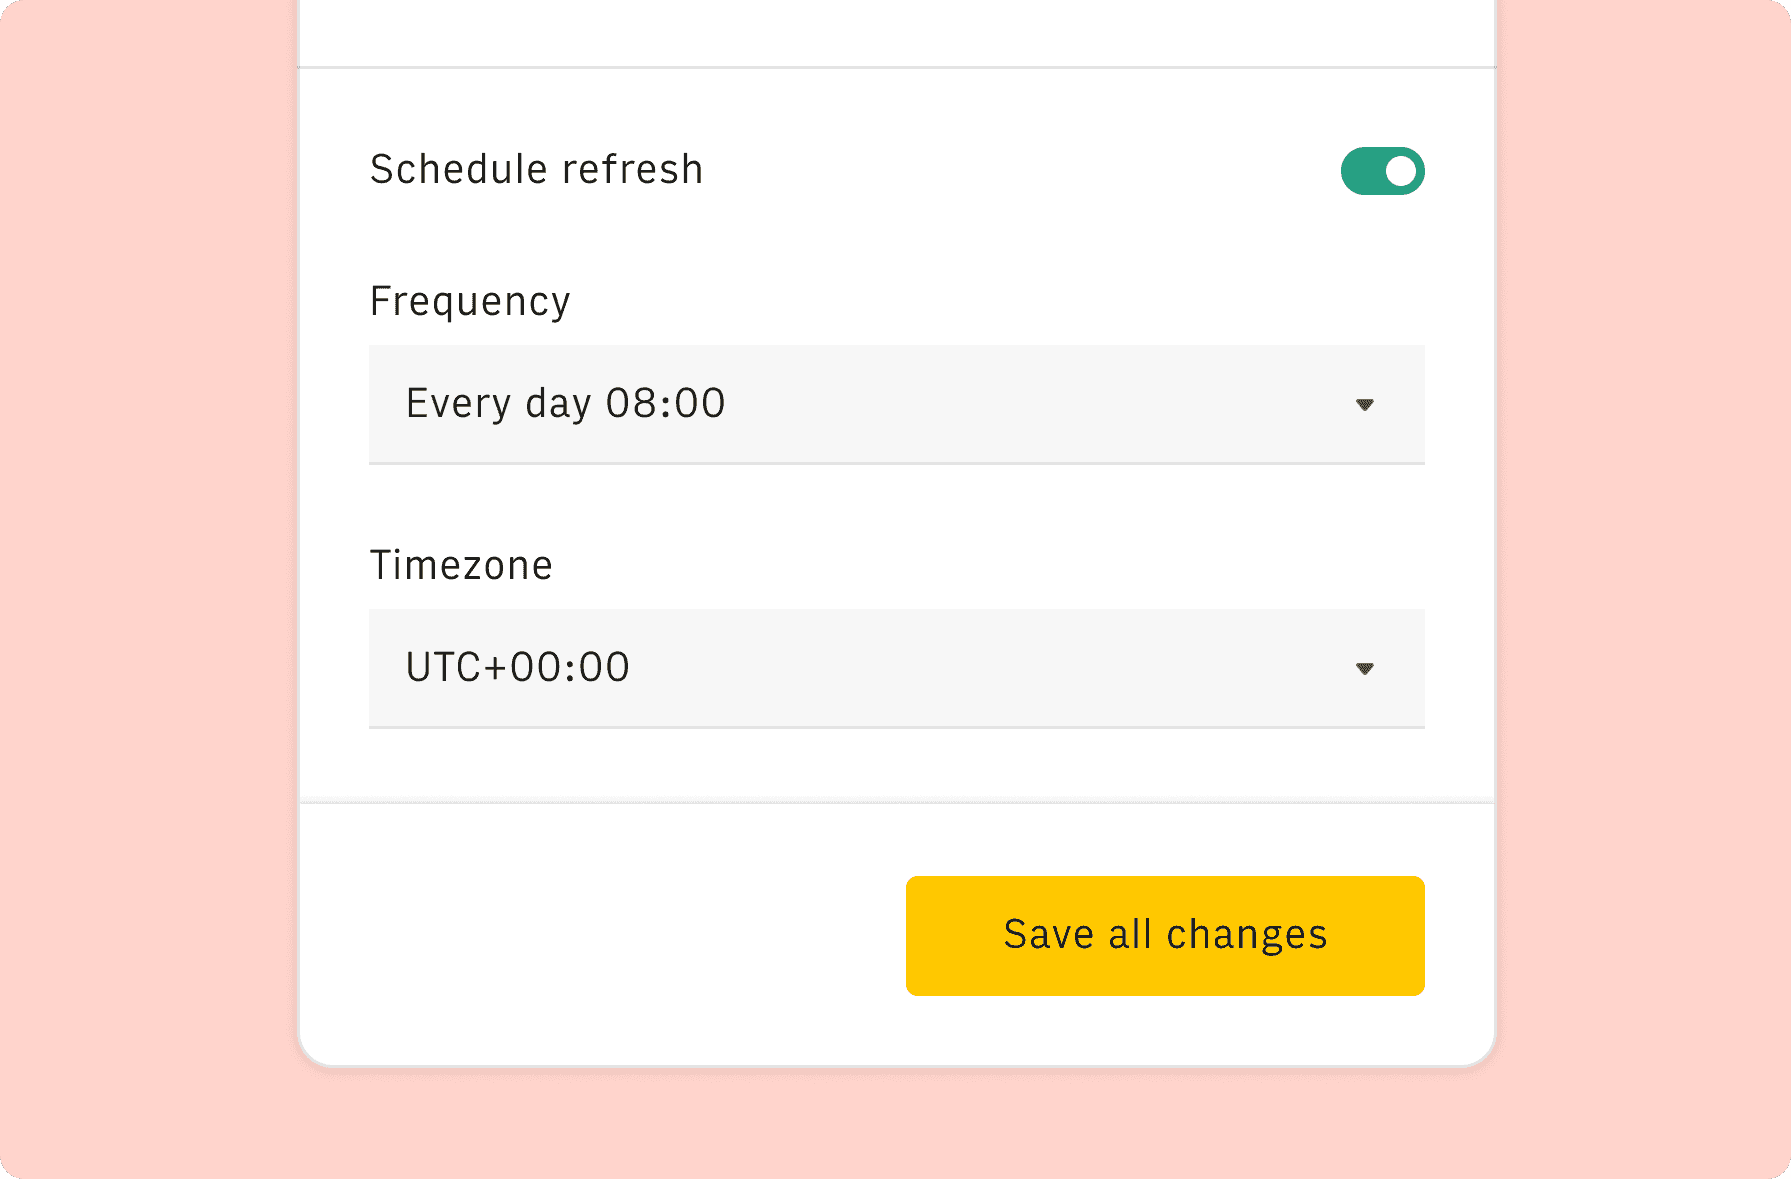
Once the integration has been connected, all tables will update automatically with your own data. Click on 'Edit Source' to change the retrieved data and automate the data refresh. You can then insert a chart or a pivot table, add a column or personalize formats, using all the regular functions and shortcuts that make spreadsheets great.
Embed tables and charts
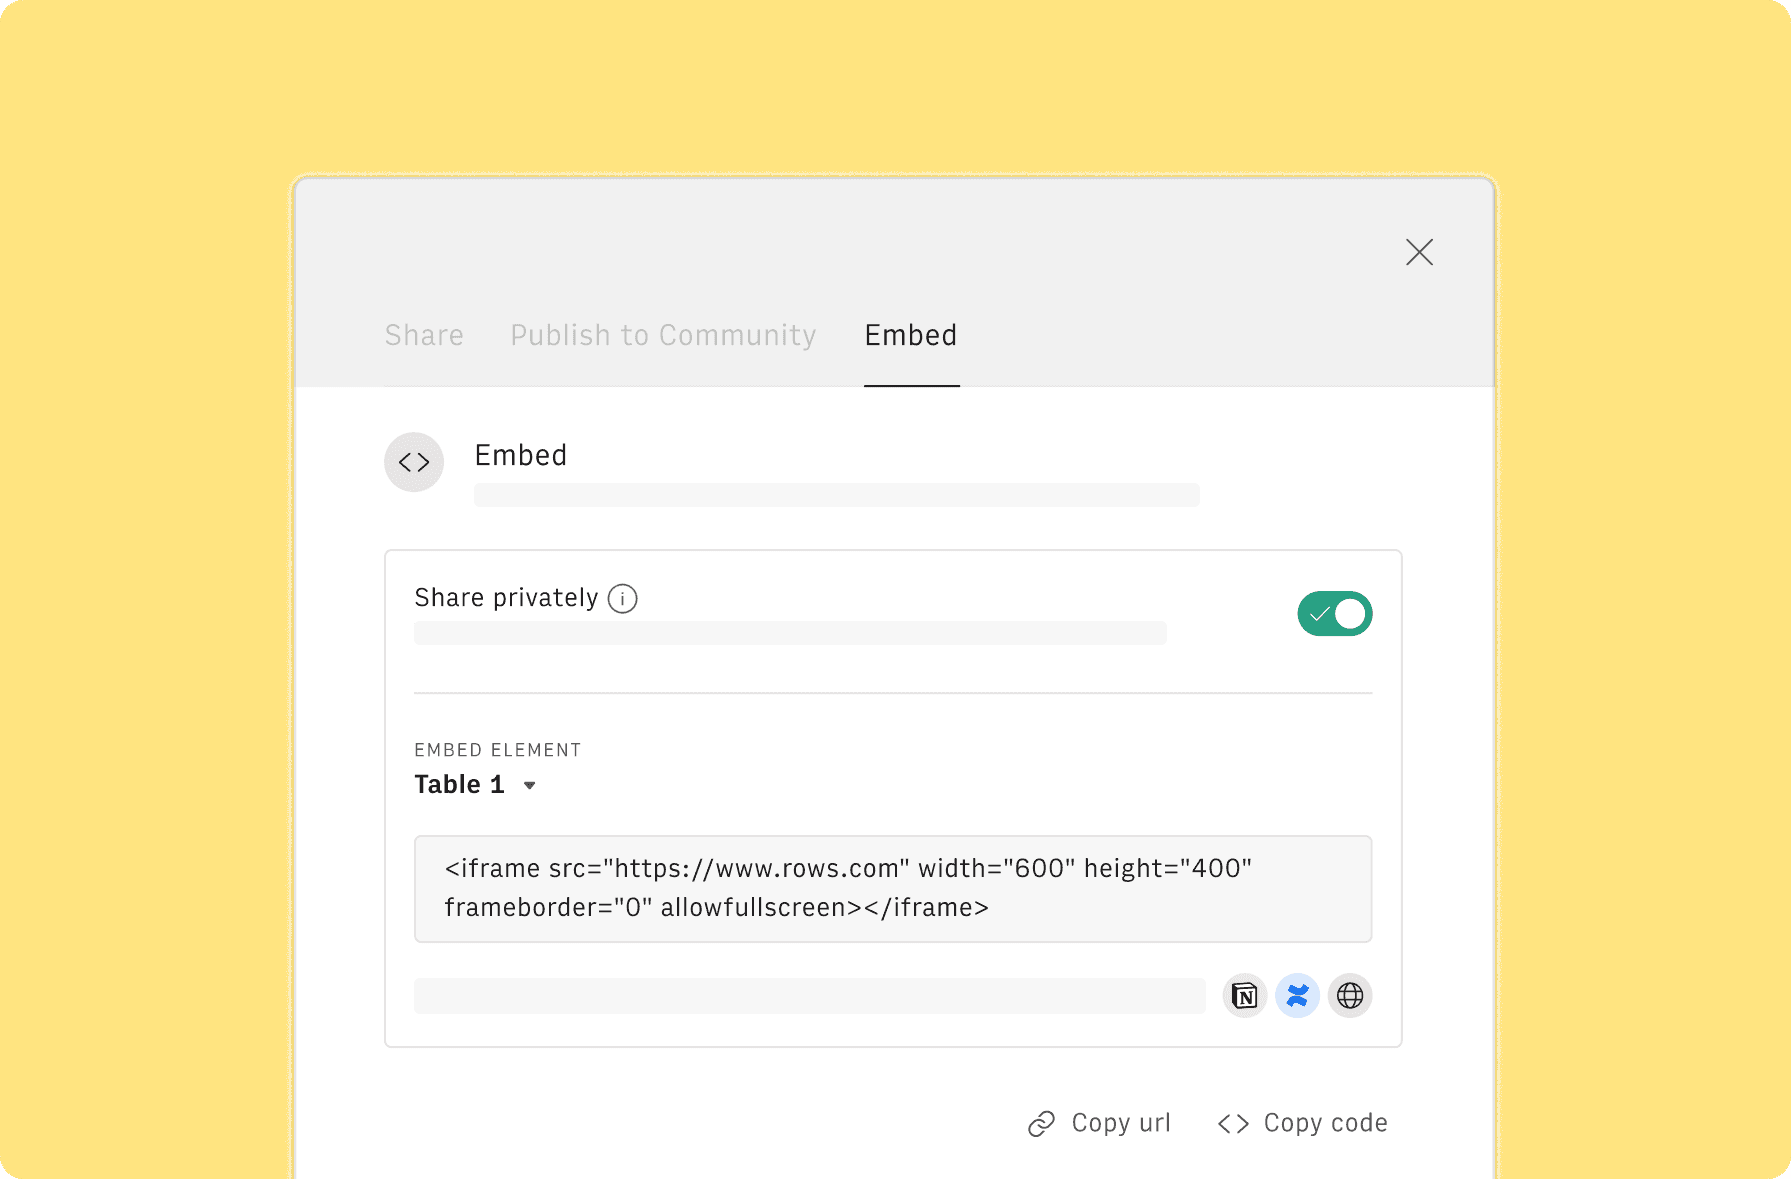
Click on the option menu to embed tables and chart on your Notion, Confluence or any other iframe-ready documents.
Questions and answers
Can I use Rows for free?
More than a Profitability Report
Rows is your new AI Data Analyst. It lets you extract from PDFs, import your business data, and analyze it using plain language.
Signup for free
Import your business data
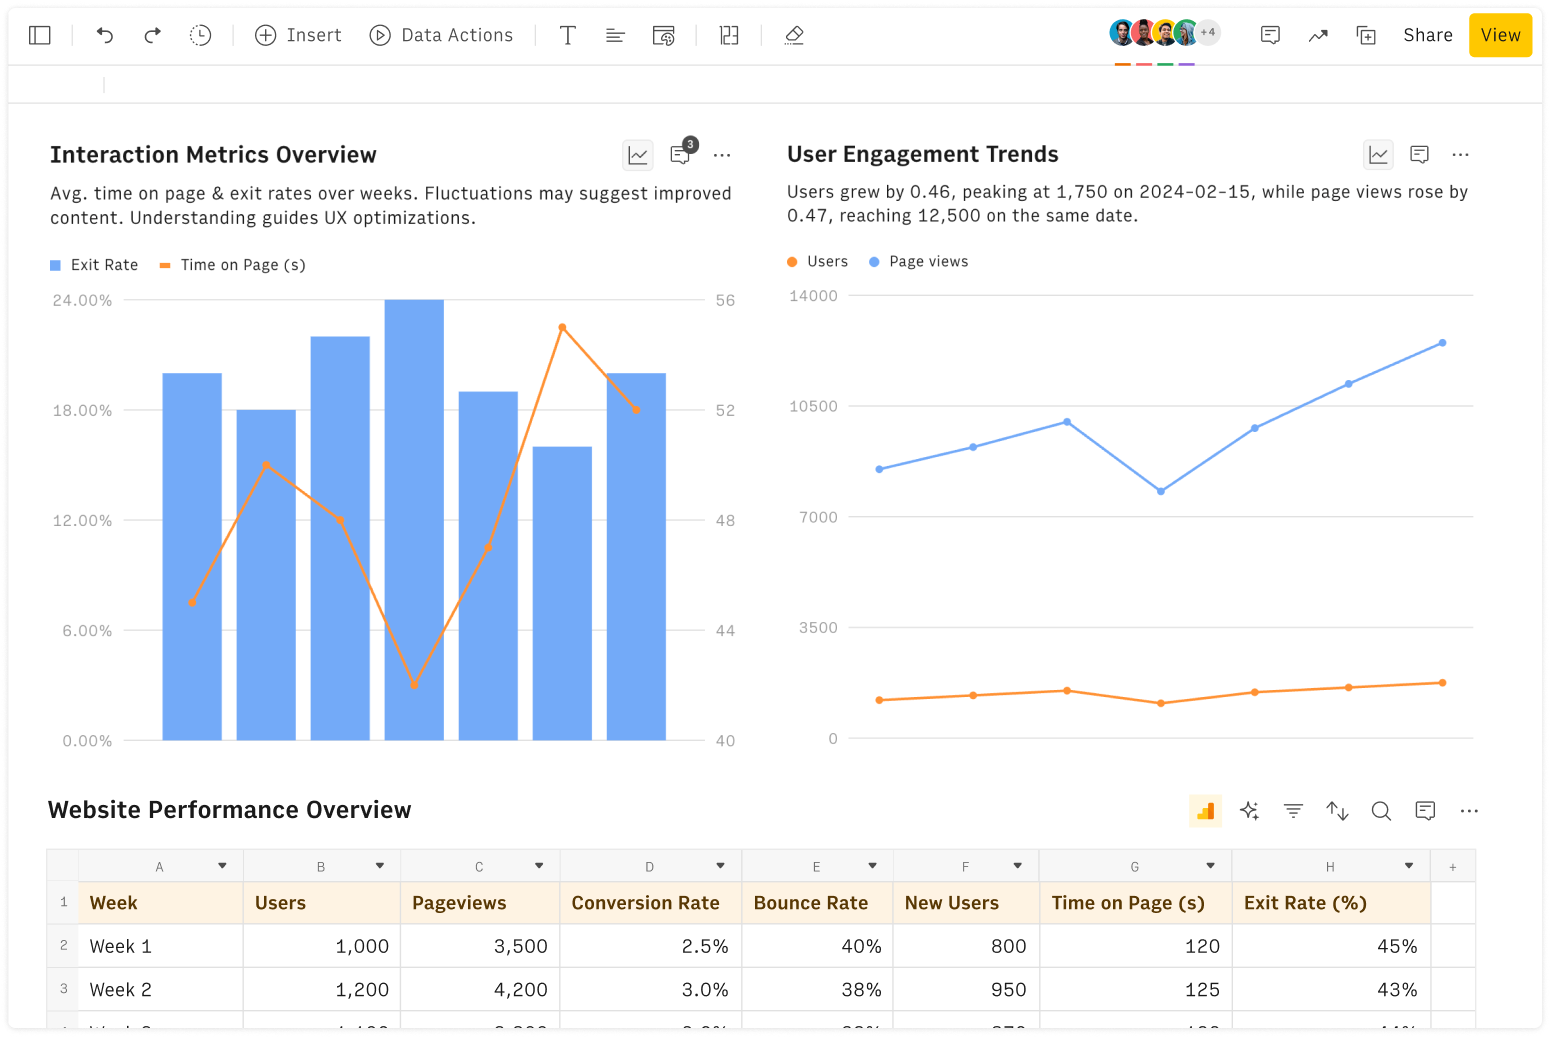
Extract from PDFs and images, import from files, marketing tools, databases, APIs, and other 3rd-party connectors.
Know moreAnalyze it with AI
Ask AI✨ any question about your dataset - from VLOOKUPs to forecasting models - and surface key insights, trends, and patterns.
Know moreCollaborate and Share
Seamlessly collaborate and share stunning reports with dynamic charts, embed options, and easy export features.
Know more
