Intro
'Cash is king': this is what most finance managers would tell you. And this is particularly true for a startup, whose 'burn rate' - the rate at which cash is invested every month to prosper - is THE KPI any founder should know and monitor obsessively. But it'll be time well spent: according to CB Insights, almost a third of startups fail because they run out of money.
In this guide, we will walk you through building a complete report for your company's monthly Cash flow and Profit and Loss (P&L) statements. We will start by introducing some general principles and then we will deep dive into practice.
Here’s a sneak peek of what you will get:

What is a P&L statement
A P&L statement is a document that reports the profitability of a business, namely the remaining balance once all operative expenses are paid out from the revenues. As such, it does take into consideration how certain expenses or investments have contributed to producing those revenues in a specific time frame. For example, if an investment is paid fully at the beginning of year 1 but is going to produce its effect for multiple years, the P&L will account for it pro rata for the period considered (so-called amortization). The same happens for sales, which are accounted only for the period in which the corresponding product (or value) is actually delivered, and not when they are cashed in on the bank statement.
To sum up, a P&L statement is built according to an accrual basis. The opposite holds for the cash flow statement.
The most relevant items one can find in a P&L statement are:
| Item | Description |
|---|---|
| Net sales | All sales net of returns, refunds, or discounts |
| COGS | All costs directly associated with producing the goods sold, such as raw materials, IT infrastructure, ... |
| Gross Margin | Difference between Net sales and COGS, measuring the ability of the product of being profitable (usually in % terms) |
| Sales & marketing | All costs related to sales and marketing activities |
| Technology & research | All costs related to |
| General & admin | All general and administrative costs, such as office rent and accounting department |
| EBITDA | Difference between Gross Margin and all operating expenses (usually in % terms) |
| Depreciation | 'Virtual' costs that arise from spreading an asset's cost over its useful life |
| EBIT | Difference between EBITDA and Depreciation (usually in % terms) |
| Interest | All costs related to financial debts and loans |
| EBT | Difference between EBITDA and Depreciation (usually in % terms) |
| Taxes | All taxes that the company must pay on its earnings |
| Net Income | Earnings net of taxes |
Depending on the national accounting principles, you may also find an intermediate line called 'Contribution margin': it refers to the Gross margin minus the remaining variable costs that are not accounted for in the COGS, such as the cost of marketing and sales.
What is the Balance Sheet
While we can think of the P&L as a recording of one business' activity over a specific period of time, the Balance Sheet is a screenshot of the company's assets and liabilities at a specific point in time.
| Item | Description |
|---|---|
| Assets | They represent the resources owned or controlled by the company, such as cash, account receivables, credits, Properties Plants and Equipment, licenses, and patents |
| Liabilities | The sum of all external resources on which the company relies, or - in other words - all the claims that third parties are entitled to make, such as debts and accounts payable |
| Equity | Equal to total assets minus total liabilities. They represent the residual claims of the company shareholders once all other creditors are paid out |
What is a cash flow statement
A Cash flow statement measures the net flow of cash into and out of a business and classifies them based on the 'usage' of money. For example: if in February a company spends money to buy new machinery, then exactly in that month, a negative cash flow must be registered. It will be part of the investment activities of the company, as it refers to a valuable, non-consumable purchase.
It's easy to grasp how important correct and rigorous monitoring of the cash balance is, especially when it comes to planning investments and fundraising.
Let's now dig a bit deeper into the theory of cash flow. The most straightforward way to compute it is to look at one business bank account. However, this is not what most companies do: think for example big corporations, with multiple bank accounts, treasury operations, and procedures. The most common procedure starts from a specific item of the P&L (the Net income) and goes backward, adjusting this figure for all the items that have (or have not) impacted the cash actual balance.
Depending on the nature of the items included, we can distinguish among:
| Type of cash flow | Description |
|---|---|
| Cash flow from Operations (CFO) | It measures all cash movements generated by regular activities, such as producing, storing, and selling products |
| Cash flow from Investment (CFI) | It measures all cash movements generated by investment activities, such as the purchase of a new server infrastructure (-), or a new office space (-) |
| Cash flow from Financing (CFF) | It measures all cash movements between a company and its backers, including investors, shareholders, and creditors. Here you can account for dividends (-), shares buybacks (-) and funding rounds (+) |
To understand the backward logic behind the cash-flow statements, let's make the most common example. As said above, amortization does not represent a cash-out, but only a virtual attribution of a cost paid in the past, to the corresponding period of interest. As such, it virtually reduces the Net Income without having a monetary impact: thus, when computing the CFO, it needs to be added back to clear its effect. The same, but with the opposite sign, happens for an increase in Account Receivable: the product has been sold, and this increases the Net Income, but the payment has not been cashed in: therefore, it needs to be subtracted.
To have a complete overview of these steps, let's dive deeper into our template.
Let's start!
To use our template, follow the link Cash flow model, click on Use template and save it in one of your workspace’s folders.
This template offers you an easy UI to build and keep track of your company's P&L and cash flow statements. It takes as a reference the typical operations of a digital company, so you won't find mentions of physical capital investment, inventory, or raw materials.
Digital businesses tend to operate with a high incidence of fixed cost (e.g. people like marketers and software engineers) and a low-to-zero marginal cost: producing the 100th unit of the product (i.e. a SaaS subscription) costs basically nothing more than the 99th. As a result, gross margins tend to be extremely high, as well as the so-called overhead, the bulk of fixed costs that need to be overcome to become profitable. That's why scaling the business dimension is so relevant for internet companies.
Let's reverse-engineer it together.
The 'Monthly P&L' page contains a monthly actionable version of the P&L

Here you can input the revenues and expenses your company is incurring on a monthly basis.
Use the first table to account for sales, returns, and discounts, while the second to record expenses. If you employ a pay-per-use hosting service or a system to process payments, use the COGS to record those expenses while leaving your sales and marketing budgets as variable costs in the Contribution Margin. Finally, use the overhead to keep track of all your fixed costs, such as productivity tools, software engineers, marketers, office, HR, and Admin.
Once all your costs have been inputted, the third table offers you a summarized view of the monthly P&L. As the last step, add your amortization, interest expenses, and taxes if any.

The 'Monthly cash-flow' page allows you to record all the cash movements month by month, split in CFO, CFI and CFF. To compute the CFO, it employs the backward approach to clear out all elements that have not contributed to cash movements.

Specifically, it adds back the following three elements:
- Depreciation and amortization
- Decrease in Current Assets (e.g. reduction in Account Receivable, revenues not yet collected)
- Increase in Current Liabilities (e.g. increase in Account Payable, costs not yet paid)

To calculate the CFI, you just need to input sales and purchases of assets, and your business' net position will derive from all assets sales minus all assets purchases, as follows:

Finally, the CFF displays the net inflow of capital. As a growing company, most likely all the inflows will be represented by issuances of preferred stocks to current or new investors. Potential outflow may be represented by dividends payouts or repayment of issued debt.

The last two pages of the spreadsheets give you an aggregated view of the first two, on an annual basis.
Embed into documents
Finally, if you are using Notion or any other internal tools that support iframes to build a report, you can embed any table or chart of this spreadsheet in your document. Just click on the ... icon in the top right corner of any table or chart and pick Embed. A modal will open, as follows:
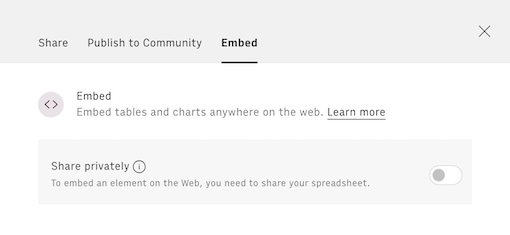
Before embedding, you need to grant access to it. To do so, toggle on the Share privately option and then hit the Copy URL button: your element is now ready to be pasted into your favorite tool.