How to Use LinkedIn Analytics? [2025]

You won't realize what you've been missing out on LinkedIn until you swipe through your LinkedIn analytics dashboard — an array of data and insights about the performances of your post and profile engagements.
Truth is: any LinkedIn users are yet to fully maximize the power of this in-built analytics tool. With this tool you can get a holistic view of your posts performance, engagements and impressions within a short period of time.
As the world’s largest B2B platform, LinkedIn has an analytics ecosystem on its own. Its data provides insights into performance of your content and the demographics of your audience, such as age, gender, job title, industry and location. This information can help you create content and messaging that is relevant to your target audience.
In this article, you'll learn how to use LinkedIn analytics to measure the performance of your LinkedIn marketing strategy in 2025. And that's not all — we will show you how to use Rows to build flexible dashboards, that tracks and measure your linkedin page performance
Why Are LinkedIn Analytics Crucial for Your Success?
LinkedIn analytics is crucial for the success of your marketing strategy. It shows you the output of your efforts and helps you make informed decisions on future marketing efforts. Below are a few benefits of LinkedIn analytics:
1. It helps you track your social media strategy
With LinkedIn analytics, you can monitor your social media activity and better understand your audience. You'll find out who they are, where they work, the role they occupy and mutual connections you have with them.
2. It enhances strategic decision making
When you collate data from LinkedIn analytics, you can make better informed decisions. It's an eye opener of both your profile's strengths and weaknesses, interpreting actionable steps to take.
3. It helps you track leads
Through profile views analytics, you can find who's checking on you every now and then — maybe a decision maker who wants to work with you. You can track leads and find who engaged more with your posts.
4. It helps you track follower growth rate
LinkedIn analytics tells you how many followers you have. And it doesn't stop there. It shows you a trend of the number of followers you've earned over a particular period of time.

LinkedIn Analytics, automated
Save time, make smarter decisions, and drive LinkedIn growth with automated, real-time performance reports.
Get Started (free)How to Access LinkedIn Analytics on Your Profile and Company Page?
It is easy to access LinkedIn analytics on your profile and company page. The profile and page analytics look alike but are different analytics entirely.
All you need to do is follow the steps below:
Accessing LinkedIn profile analytics
Step 1: The analytics is only available for profiles who have switched on creator mode. To view your personal profile analytics, navigate to your LinkedIn profile and look for the "Analytics" section. With Creator Mode enabled, you'll find enhanced analytics options:
Step 2: Click "View Profile" in your LinkedIn homepage menu
Step 3: Look for "Analytics" below your profile header. Click on “show analytics” to access detailed metrics about profile views, search appearances, and post engagement.
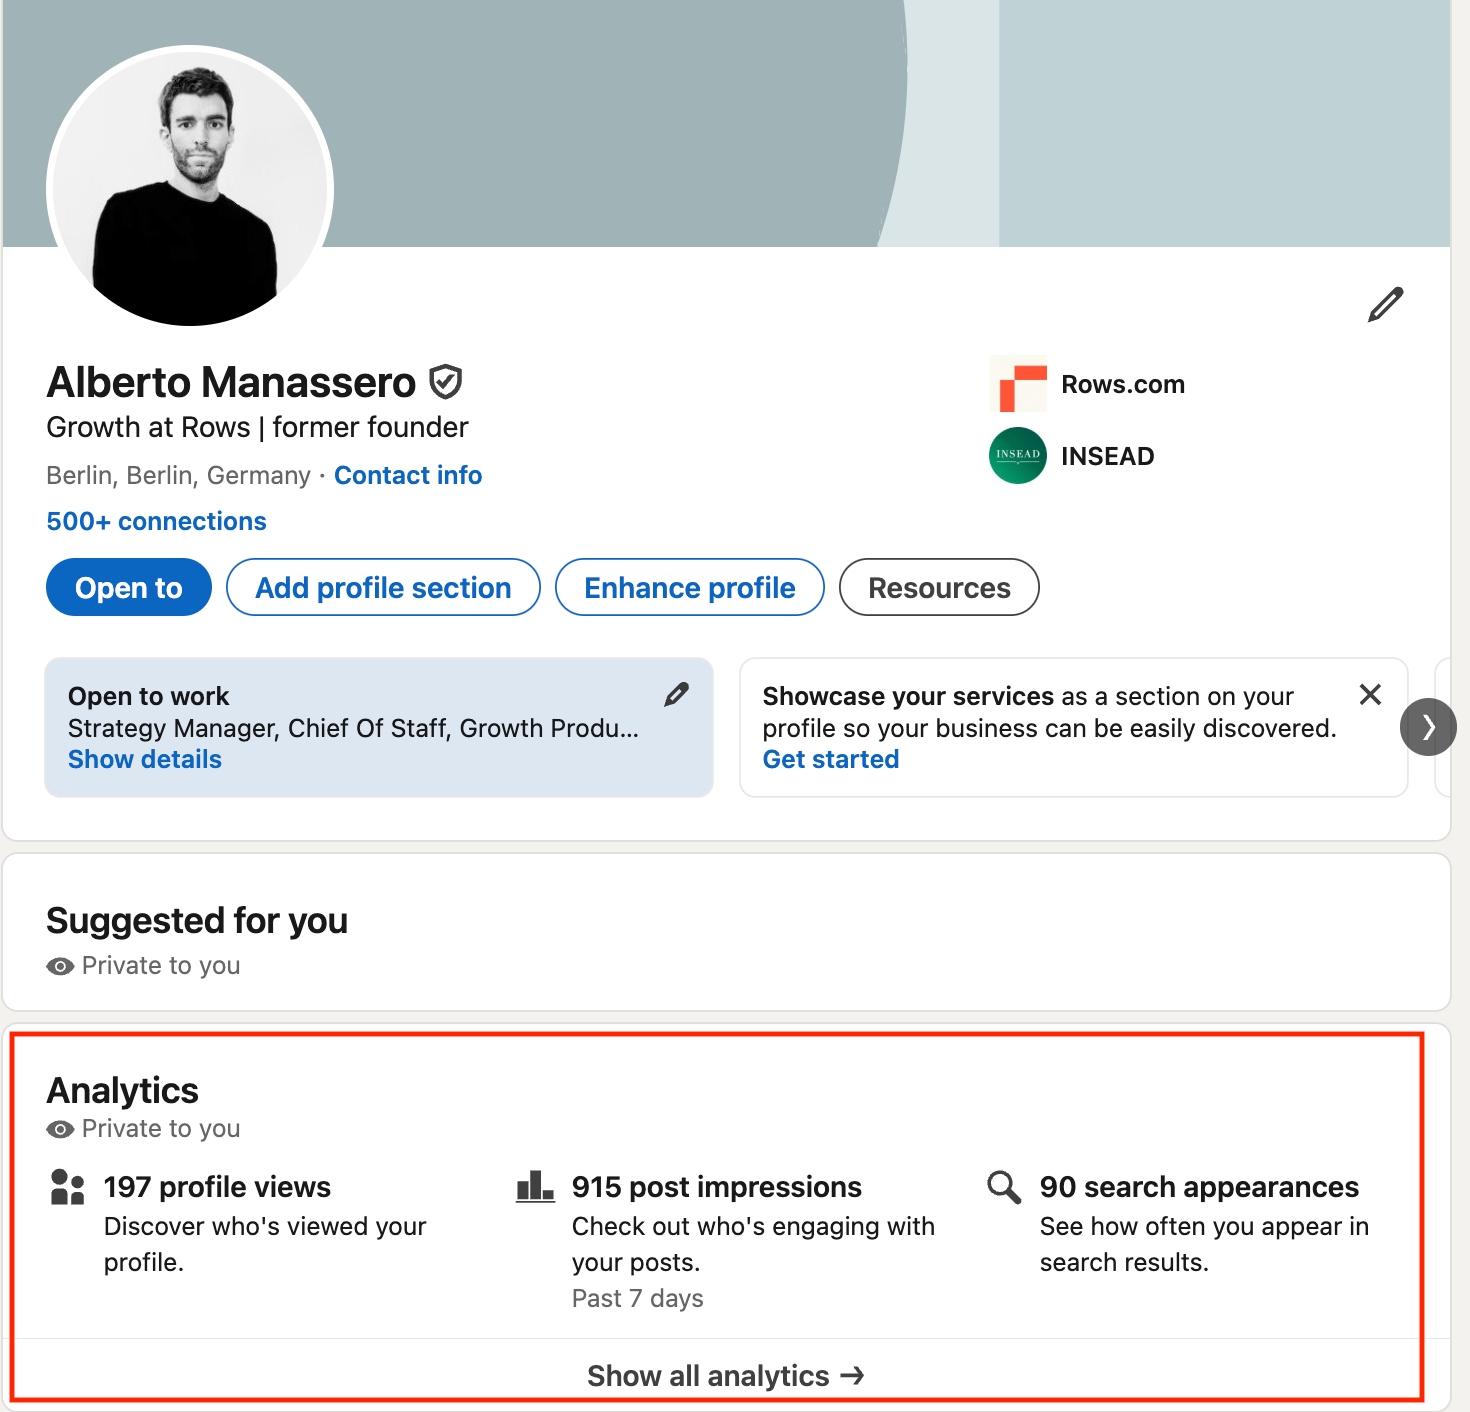
Step 4: Choose the metric you want to view. There are 4 sections —
Post impressions/audience sections
Followers sections
Profile viewers
Search appearances
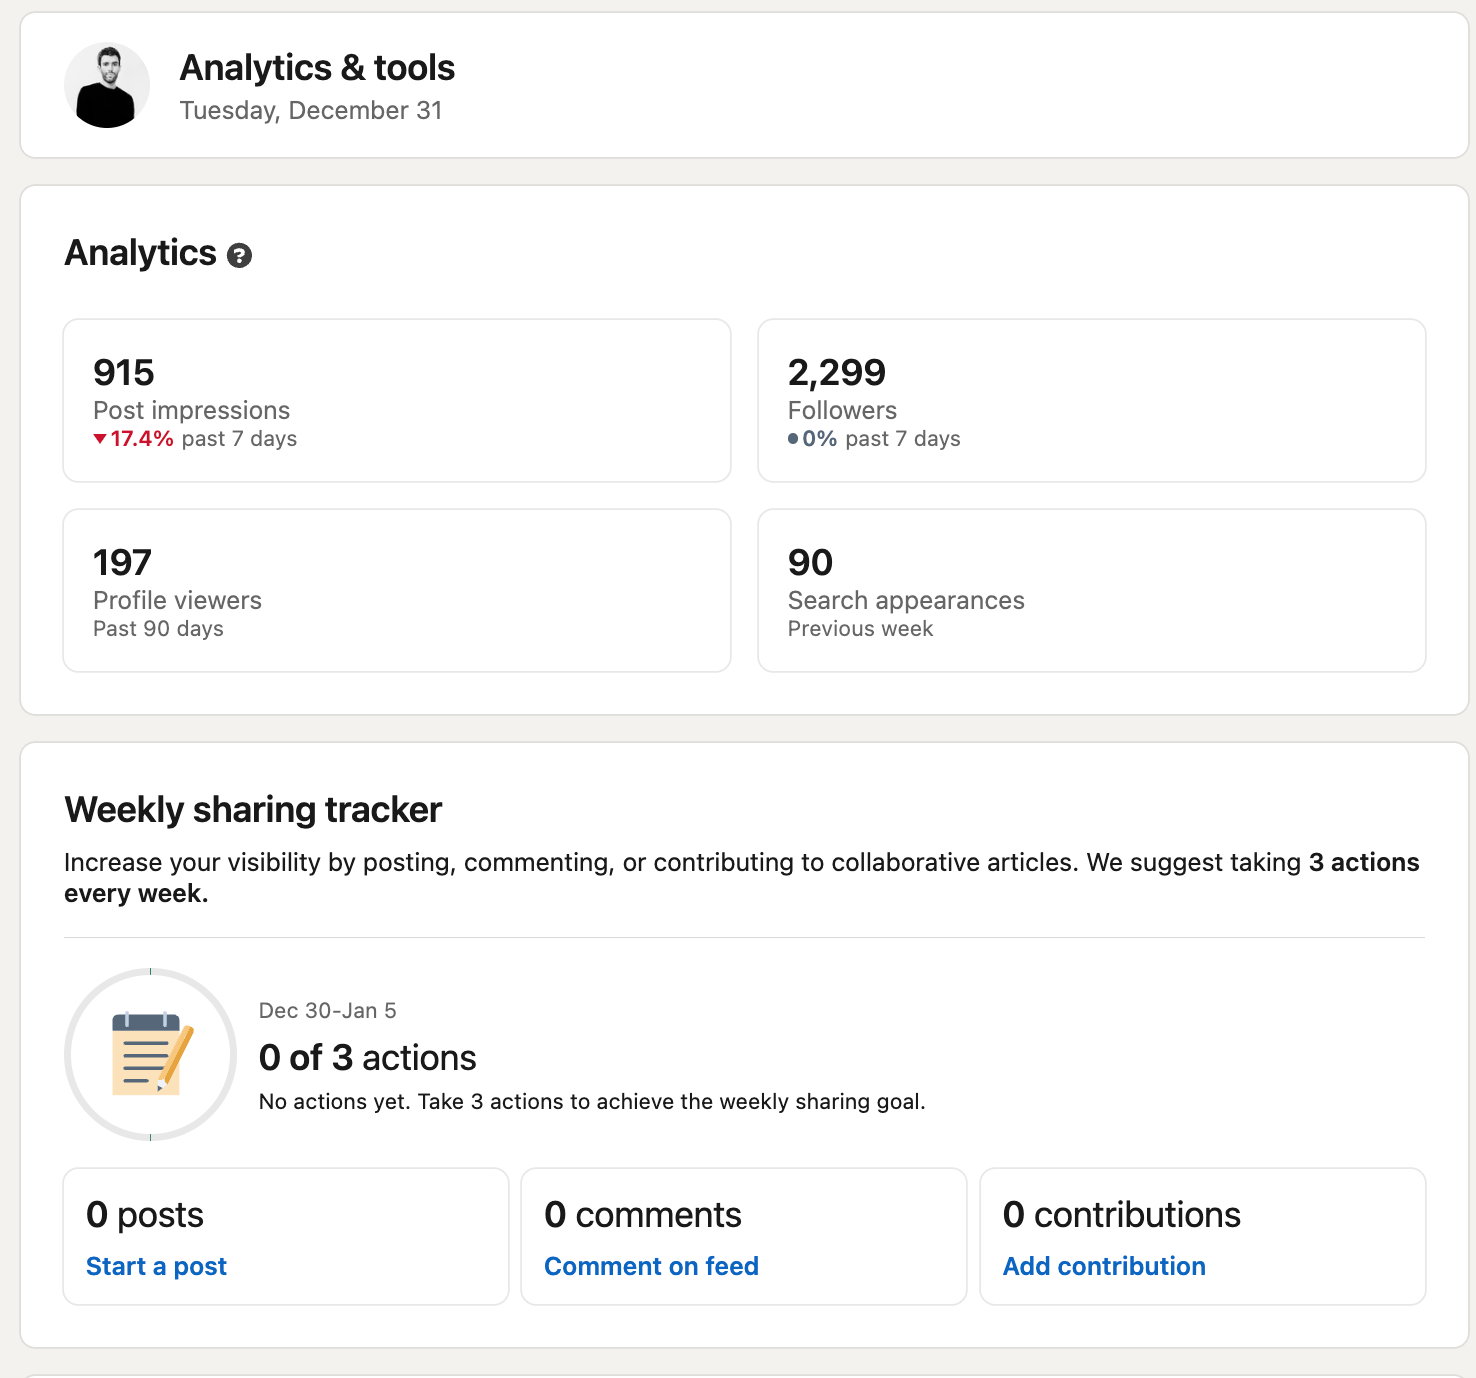
Below you'll also fine creator tools like LinkedIn live, newsletters and follow link.
For this article, I'll be showing you a view of one of those analytics section which is the post impression metrics.
Note that you can choose the number of days you want data to be covered for. The highest you can choose is 1 year which is 365 days — this means you'll get data that covers a year duration.
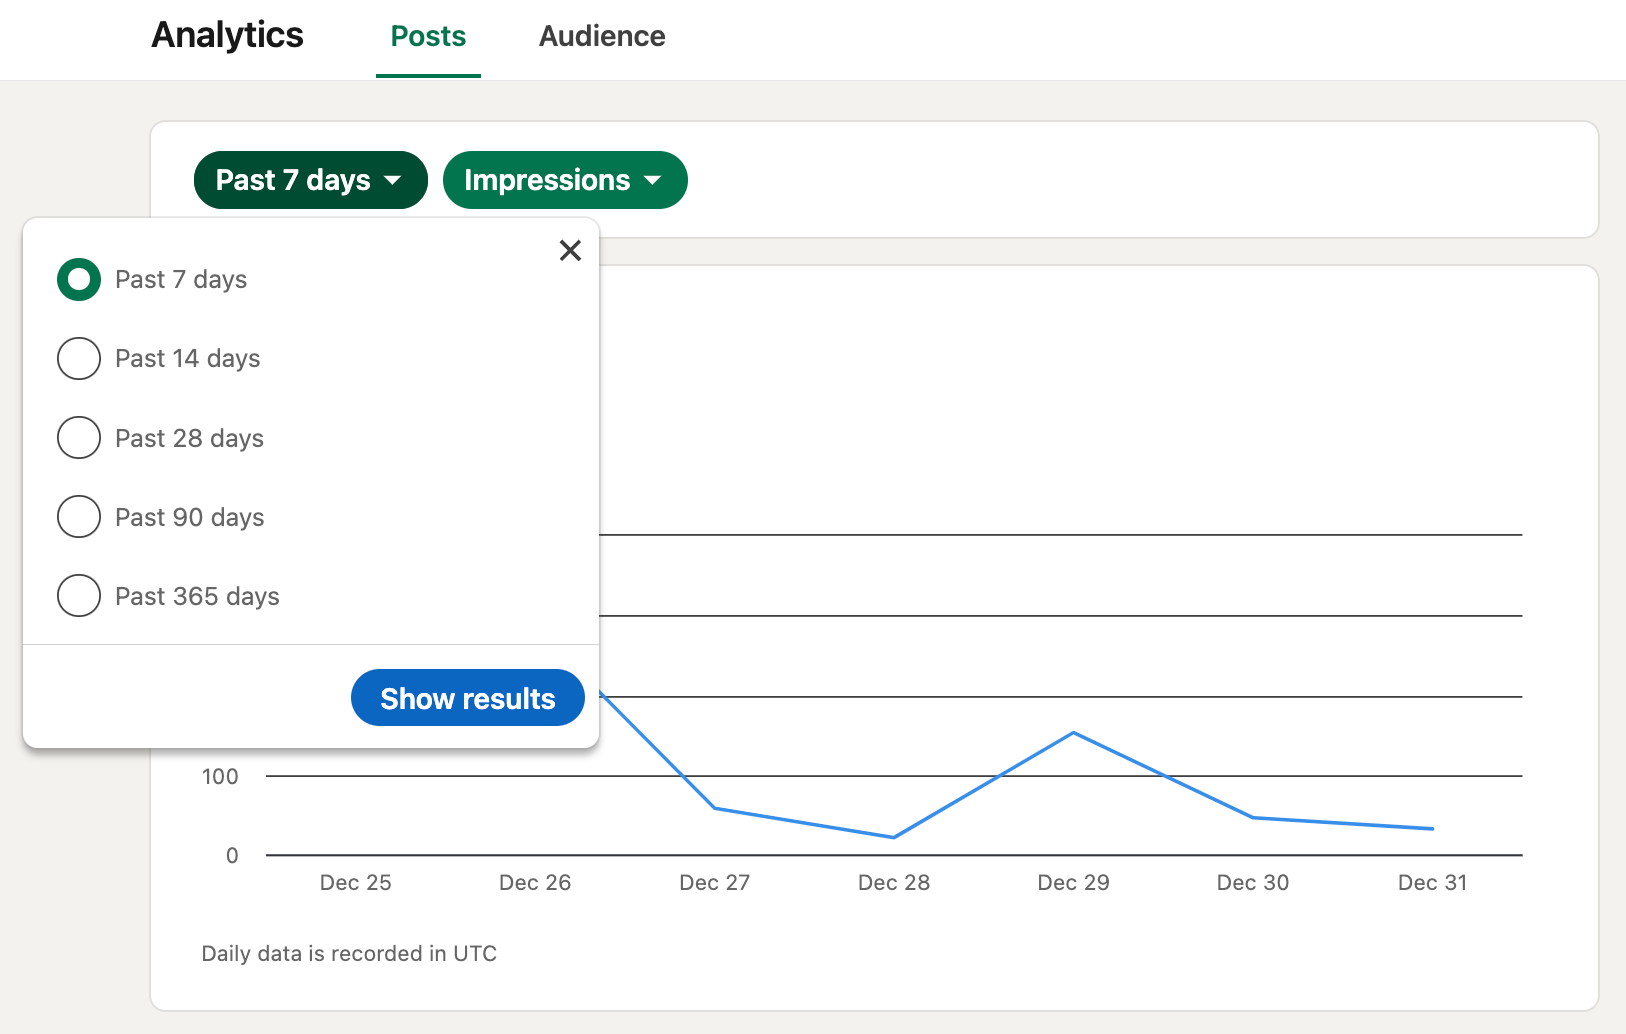
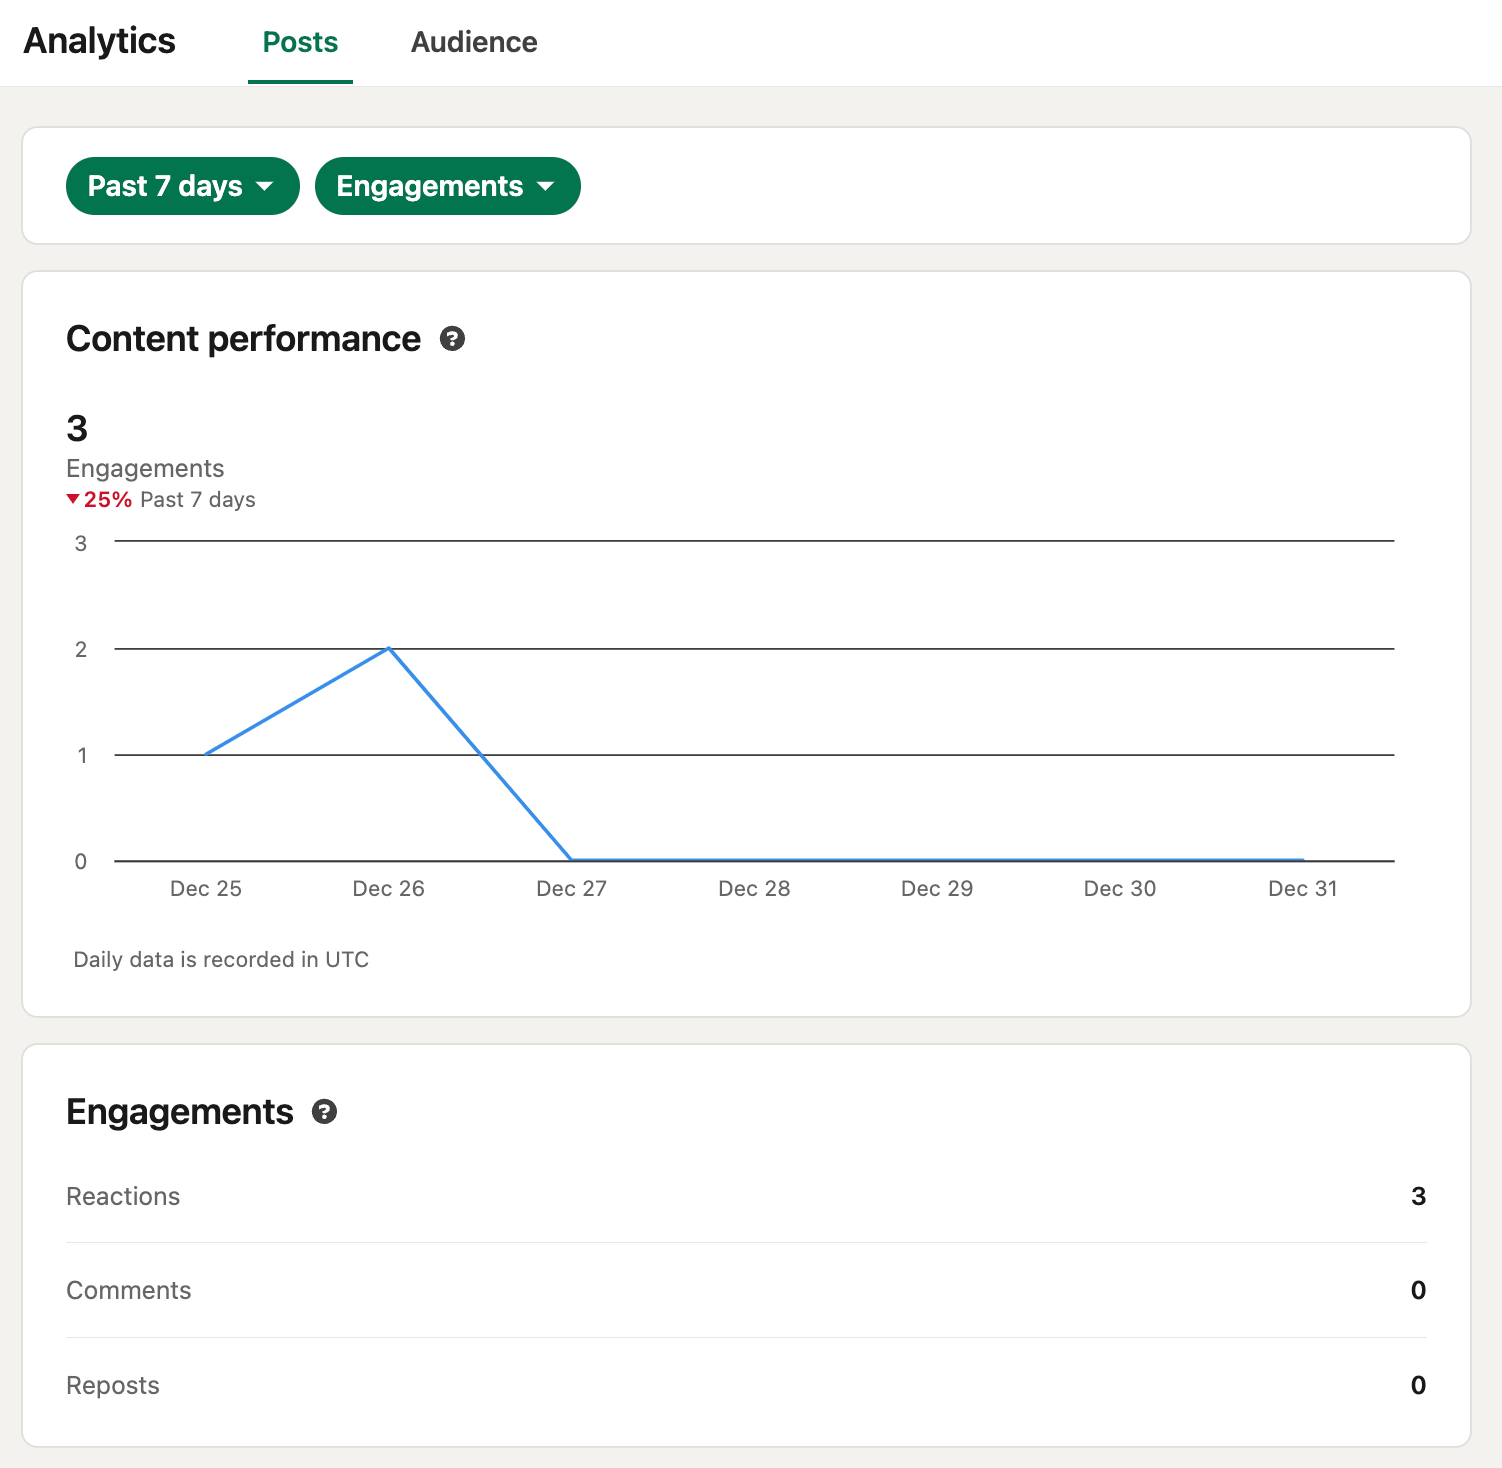
Once you've picked it, you'll see a dashboard overview of your content performance, discovery and reach.
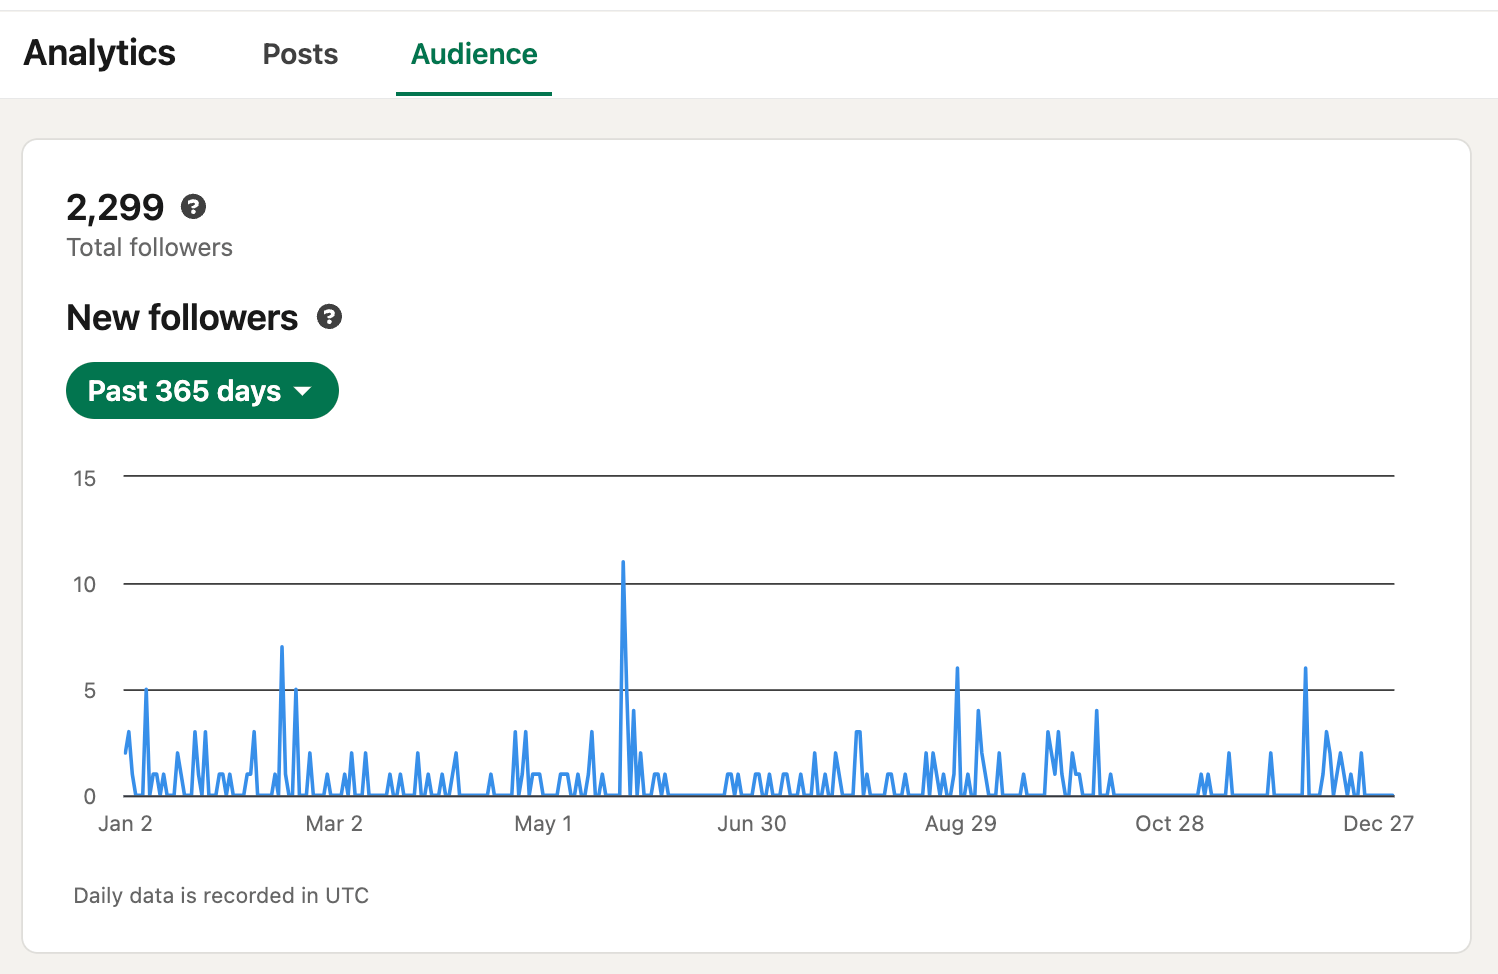
If you toggle to the right, you'll find data about your audience and their demographics. You'll see the number of followers you garnered all through the months of the year.
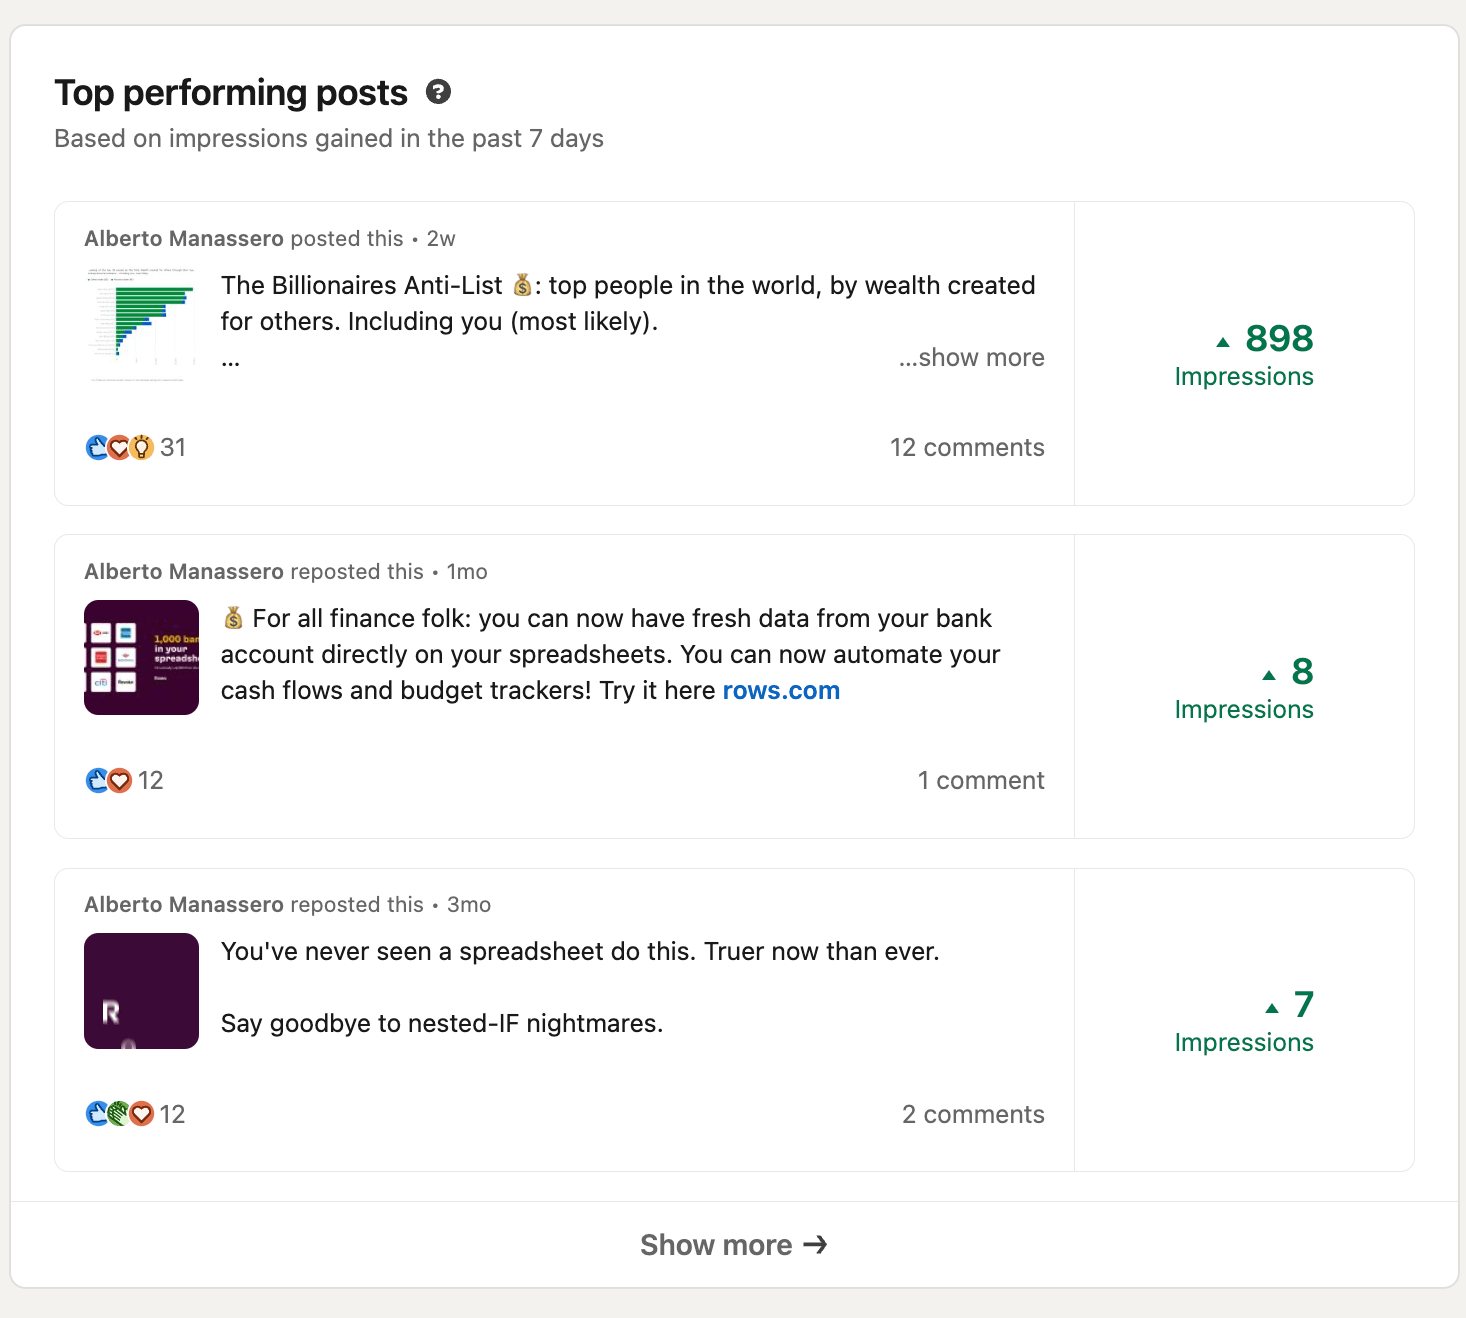
What's more, you can check the top performing posts, based on impressions gained in the last 7 days.
The LinkedIn analytics features on LinkedIn profiles are very easy to use. Go through each section of metric and consume it carefully to find peak moments and low moments in your marketing strategy.
Accessing LinkedIn page analytics
The LinkedIn page analytics is more comprehensive and extensive when compared to the LinkedIn profile analytics.
Step 1: Navigate to your company page
- Click "Analytics" in the top navigation bar
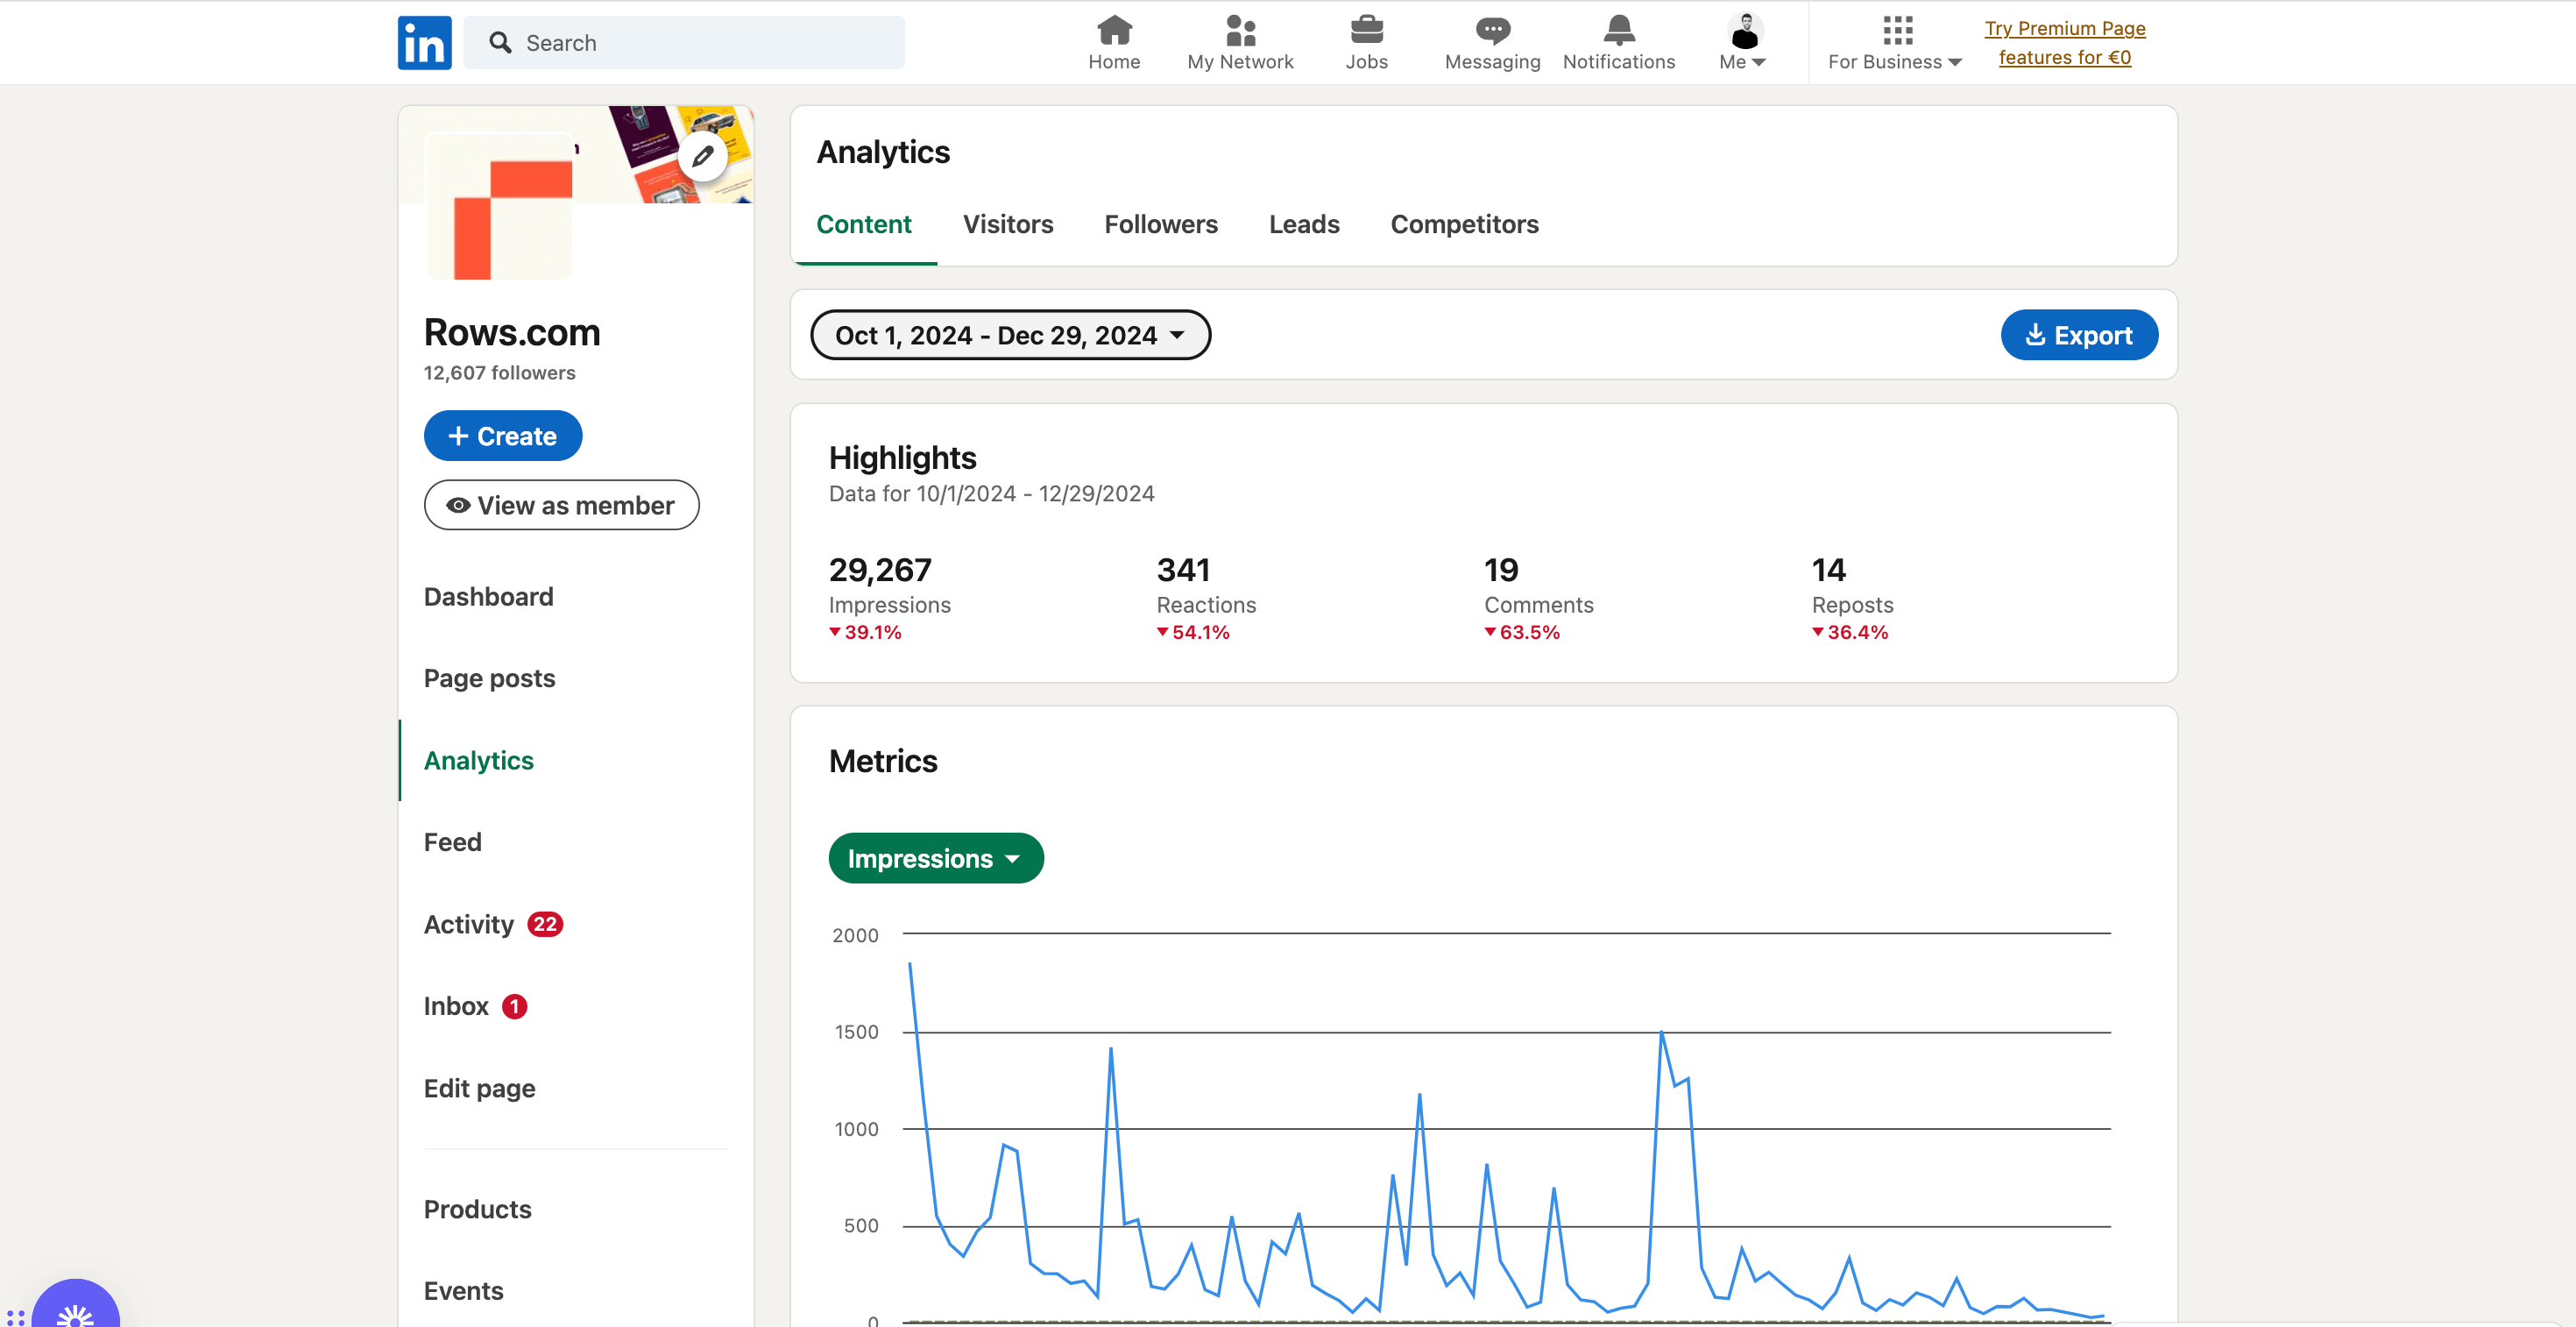
Select from content, leads, visitors, updates, or followers analytics. These sections have different data based on performance.
Visitor analytics: Page views, unique visitors, and traffic sources
- Follower analytics: Follower demographics and growth trends
- Content performance: Post reach, engagement rates, and click-through data

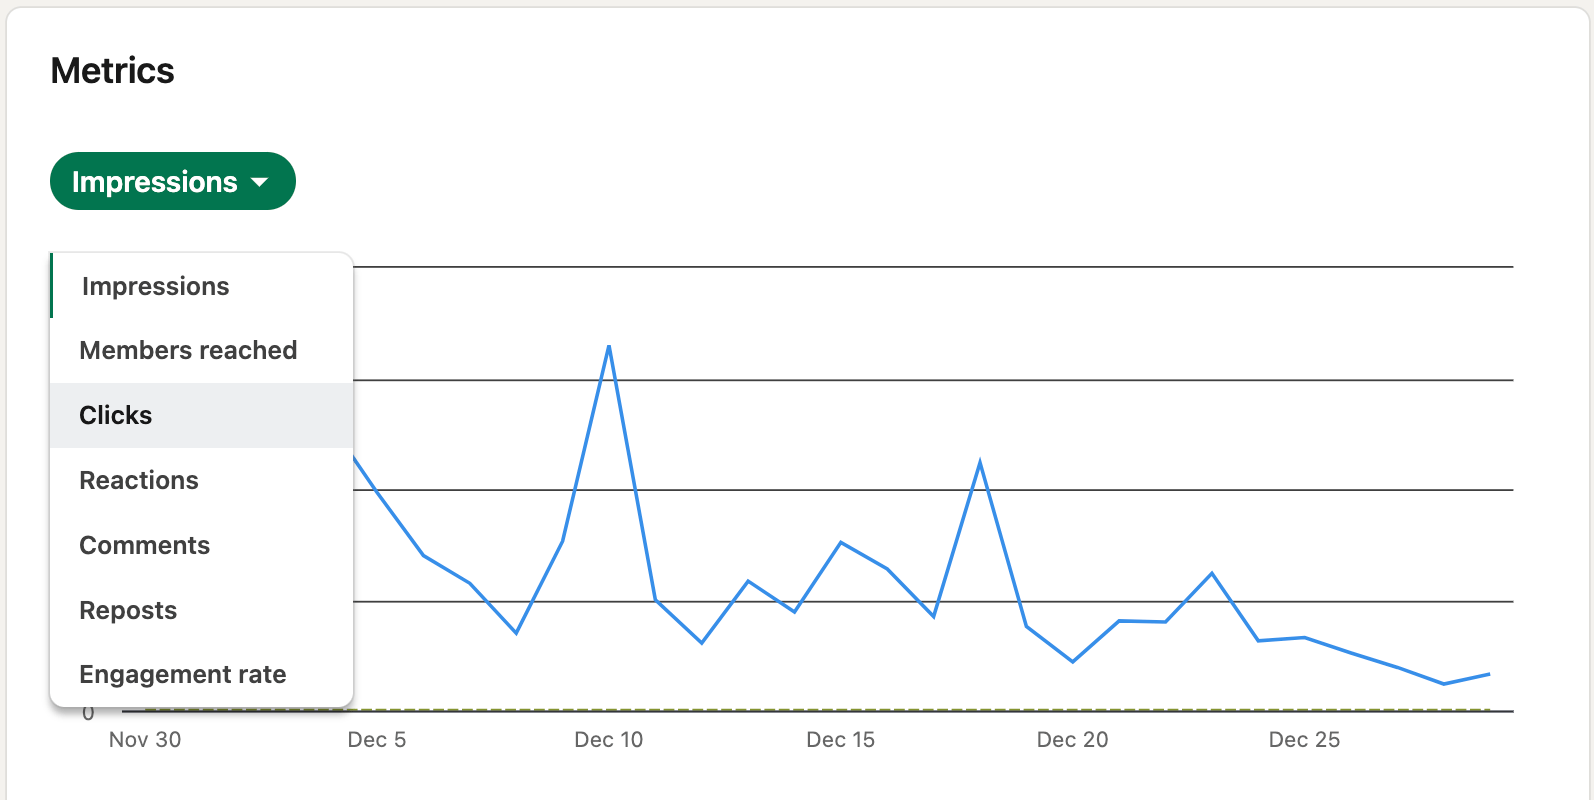
For metrics, you can also choose what to check —
Impressions, members reached, click, reactions, comments, repost and engagement rate.
What Metrics Should You Focus on in LinkedIn Analytics?
All metrics are good but there are a few that are very relevant when you tie them to your LinkedIn goals. They include:
Impressions: The number of times your post was seen.
Clicks: The number of times your post was clicked on.
Reactions: The number of times your post was reacted to.
Comments: The number of comments your post received.
Shares: The number of times your post was shared.
Follower growth: Total followers, new followers, lost followers, follower demographics and inactive followers.
How to Track LinkedIn Followers and Audience Growth using Rows’ LinkedIn followers tracker
You can track your LinkedIn Page's followers and audience growth over time automatically with our easy to use and flexible spreadsheet templates.
On the web version of LinkedIn, you can see the number of followers you have on a Company Page, but not easily track its evolution over time. This is why many people eventually end up performing it manually by recording the number every single day.
Our templates leverage Rows integration with LinkedIn API to pull data from your LinkedIn profile and company pages. All you need to do is to input your LinkedIn username and it'll track your growth count using various metrics.
Rows is a spreadsheet and data aggregation tools that offers a ton of templates and dashboards that cater for marketing analytics.
A chunk of our templates includes social media marketing templates. And some LinkedIn templates from a part. With these templates tools, you can pull live data from LinkedIn and view it in a tidy and arranged manner. What's more? You can make sense out of every data by using some of our advanced AI features like the AI Analyst and OPENAI
Some of our LinkedIn audience growth templates includes:
LinkedIn posts report — Best for tracking LinkedIn post engagement
The LinkedIn post report is strictly for post analytics. It doesn't track followers or track campaigns. It's solely created to retrieve your LinkedIn posts’ metrics. The metrics retrieved include the total number of likes, comments, impressions, clicks, shares, and engagement rate.
LinkedIn page analytics dashboard — Best for tracking LinkedIn page analytics
If you want to discover key insights about your LinkedIn Page and posts, such as engagement, impressions, and followers growth, this tool should be your go-to. It gives you a holistic overview of your company's LinkedIn page over a particular period.
LinkedIn ads dashboard — Best for tracking LinkedIn advertising campaigns
Our LinkedIn Ads Dashboard template is designed to provide you with a comprehensive overview of your LinkedIn advertising efforts. This powerful tool simplifies your LinkedIn reporting by offering high-level period summaries, including the number of campaigns, total spend, clicks, and cost-per-click (CPC).
LinkedIn ads conversion discrepancy reports— Best for tracking LinkedIn ads discrepancy
This dashboard compares the conversion data from your ad channels (LinkedIn Ads) with the conversions tracked by Google Analytics 4. By identifying discrepancies between these platforms, you can make data-driven decisions to enhance your marketing strategies and boost your ROI.
Additionally, these tools offer different metrics overviews based on their specific use cases. That means you won't get the same metrics for LinkedIn page reports as it is on LinkedIn page analytics
Read more: Best LinkedIn Analytics tools in 2025
Common Mistakes to Avoid When Using LinkedIn Analytics
There are many mistakes you can make when leveraging linkedin analytics. These pitfalls can reduce the impact of data on your future marketing efforts. For example, ignoring demographic insights or competitor data can lead to a superficial understanding of your performance, and failing to update your strategy in response to analytics is a missed opportunity for growth.
Some of these mistakes include:
Neglecting conversion metrics: Conversion metrics are result oriented metrics. Celebrating high impression numbers without analyzing conversion rates is a wrong route to take.
Poor strategic implementation: Many users collect data but fail to act on it effectively. All data points on your analytics page are stepping stones for implementing strategically to improve what is working and fill voids.
Inadequate demographic analysis: Failing to analyze follower professional backgrounds is big pitfall. When you fail to deeply understand who's engaging with their content, viewing their profiles, or following their company pages, they miss crucial insights that could inform better strategic decisions.
Neglecting competitor analysis: Tracking competitor analytics can provide benchmarks for your own content and help you surface any gaps in your content strategy. When you don't do it, you'll be unable to provide these benchmarks.

LinkedIn Analytics, automated
Save time, make smarter decisions, and drive LinkedIn growth with automated, real-time performance reports.
Get Started (free)Start using LinkedIn Analytics + Rows LinkedIn analytics tools today!
You've learned how to use the LinkedIn analytics tool. It's easy to use and flexible. It's also important to note that you can merge it with another external analytics tool for a comprehensive overview.
LinkedIn analytics + Rows’ LinkedIn analytics — where simplicity/ clarity matches advanced reporting ( plus, we have an AI analyst that does the dirty work for you)
Rows has 6 LinkedIn analytics templates dashboard tools . These tools are able to fetch data from any LinkedIn username and aggregate it on a spreadsheet ans dashboard. What's more? You can customize the template and share it as a report to your team. So, if you are looking for that extra spice of reporting — go for Rows.
With Rows, you can bring your LinkedIn data to life — it's free to use. Visit rows.com and sign up, then head over LinkedIn analytics template pages and start using them.

