How to create a Stock Portfolio Dashboard in Notion


Notion is an incredibly adaptable tool for managing projects, great for teams of any size. With a user base exceeding 30 million, it can be adapted for myriad purposes including serving as a company wiki, managing customer relations in sales, sharing marketing reports, tracking personal habits, and much more.
More and more people are discovering the benefits of using Notion to monitor their personal finances and stock investments. In this article, we will explore how to create a finance and investment tracker within Notion, providing a straightforward, automated method to oversee your financial stock and crypto investments efficiently.
We’ll build the dashboard in two steps:
Create the investment dashboard in Rows.
Embed the tracker in Notion.
Part 1 : Create the Investment Portfolio Dashboard in Rows
1. Go to Rows.com
Rows is a web application for creating modern, beautiful spreadsheets. It combines a modern spreadsheet editor, data integrations (e.g. Social media, Google Analytics, Salesforce, Stripe) and a novel sharing experience that turns any spreadsheet into a website in one-click.
 Rows is a modern spreadsheet
Follow the steps below to create your first spreadsheet:
If you haven't signed up for Rows, do that here and login to your account.
Create a spreadsheet. Do this by clicking on the “Create Spreadsheet” button.
2. Install the Investment portfolio tracker template
Then next thing we’ll do is install the Investment portfolio tracker template. This is a pre-built spreadsheet with all of the components we’ll need to set up our dashboard in Notion.
 The Investment portfolio tracker template
Once you install the template, you’ll see a few different elements in the spreadsheet:
A Portfolio Page. This contains Instructions table that walks you through the template, and a Stock and Crypto tables where you’ll add your investments.
A Report Page. This contains a table to setup the automation that will update the prices of your assets every day, along with a Daily P&L Chart, a summary of your asset allocations and a log of of the daily performance of your investments.
A Search Tickers Page to quickly help you find the correct stock tickers for the stocks you’ve purchased.
A Backend Page with a table that contains the formulas we’ll use to trigger the daily refresh of the prices.
 Inside the Investment portfolio tracker
 3. Connect the Integrations
Following setting up the basic structure of the tracker in Rows, the next step is to connect the Alpha Vantage integration. This is a built-in integration available at Rows that allows you to import financial information about stocks, cryptocurrencies and company financials.
4. Add your investments
Now it is time to add your Stock/Crypto portfolio. It takes a couple of steps:
In the Stock table inside the Portfolio Page, add the stock Ticker, Date of Purchase, Purchase Price and the Amount purchased.
If you already received any Dividends from the stocks, add them to column H.
The Total investment (col. E), today’s Date (F), Last closing price (G), Gain (col. I and J) are calculated automatically.
Using the same logic, add your Crypto investments to the Crypto table.
For cryptocurrencies, add the ticker of the cryptocurrency in column A (e.g. BTC) and the symbol of the currency used to purchase the crypto in column B (e.g. USD). The formula in column H - FX_ALPHAVANTAGE - calculates the exchange price between both currencies.
 How to add your investments to the dashboard
5. Configure the report
Go to the Report page. Configure the automatic refresh of the stock/crypto price by clicking on the checkbox of cell B2 of the Schedule table. By default it is set to refresh the data every day.
Once the automation is set you’ll see:
The Daily log table is populated with the last day’s price and performance of each of your investments.
The Daily Summary has a summary of the performance of your portfolio.
The Daily P&L chart has one datapoint, corresponding to the performance of your portfolio during the last.
 The Report page of Investment dashboard
Note: Setting the automation will trigger the formulas on the Backend Page. They make use of the SCHEDULE and the UPDATE function to schedule a daily refresh of the stock/crypto prices and to add the daily prices and gains/loss to the Daily log table in the Report page.
Part 2 : Embed the Report in Notion
Now that the report is completed, it’s time to embed it into Notion. You can embed any element from a spreadsheet - a Table, Chart, or Form - and have a live connection between your Notion doc and Rows spreadsheet.
To embed each element from your spreadsheet in Notion, follow these steps:
Choose Embed in settings menu located in the right-hand corner of the element you want to embed
Click the Share privately toggle.
Click Copy url
Paste the link on a Notion doc and click to Create embed
 Embed the Charts and Table in Notion
Once all the elements are embedded, you can drag each element to your desired location and customize the look and feel of your dashboard.
 The Investment dashboard in Notion
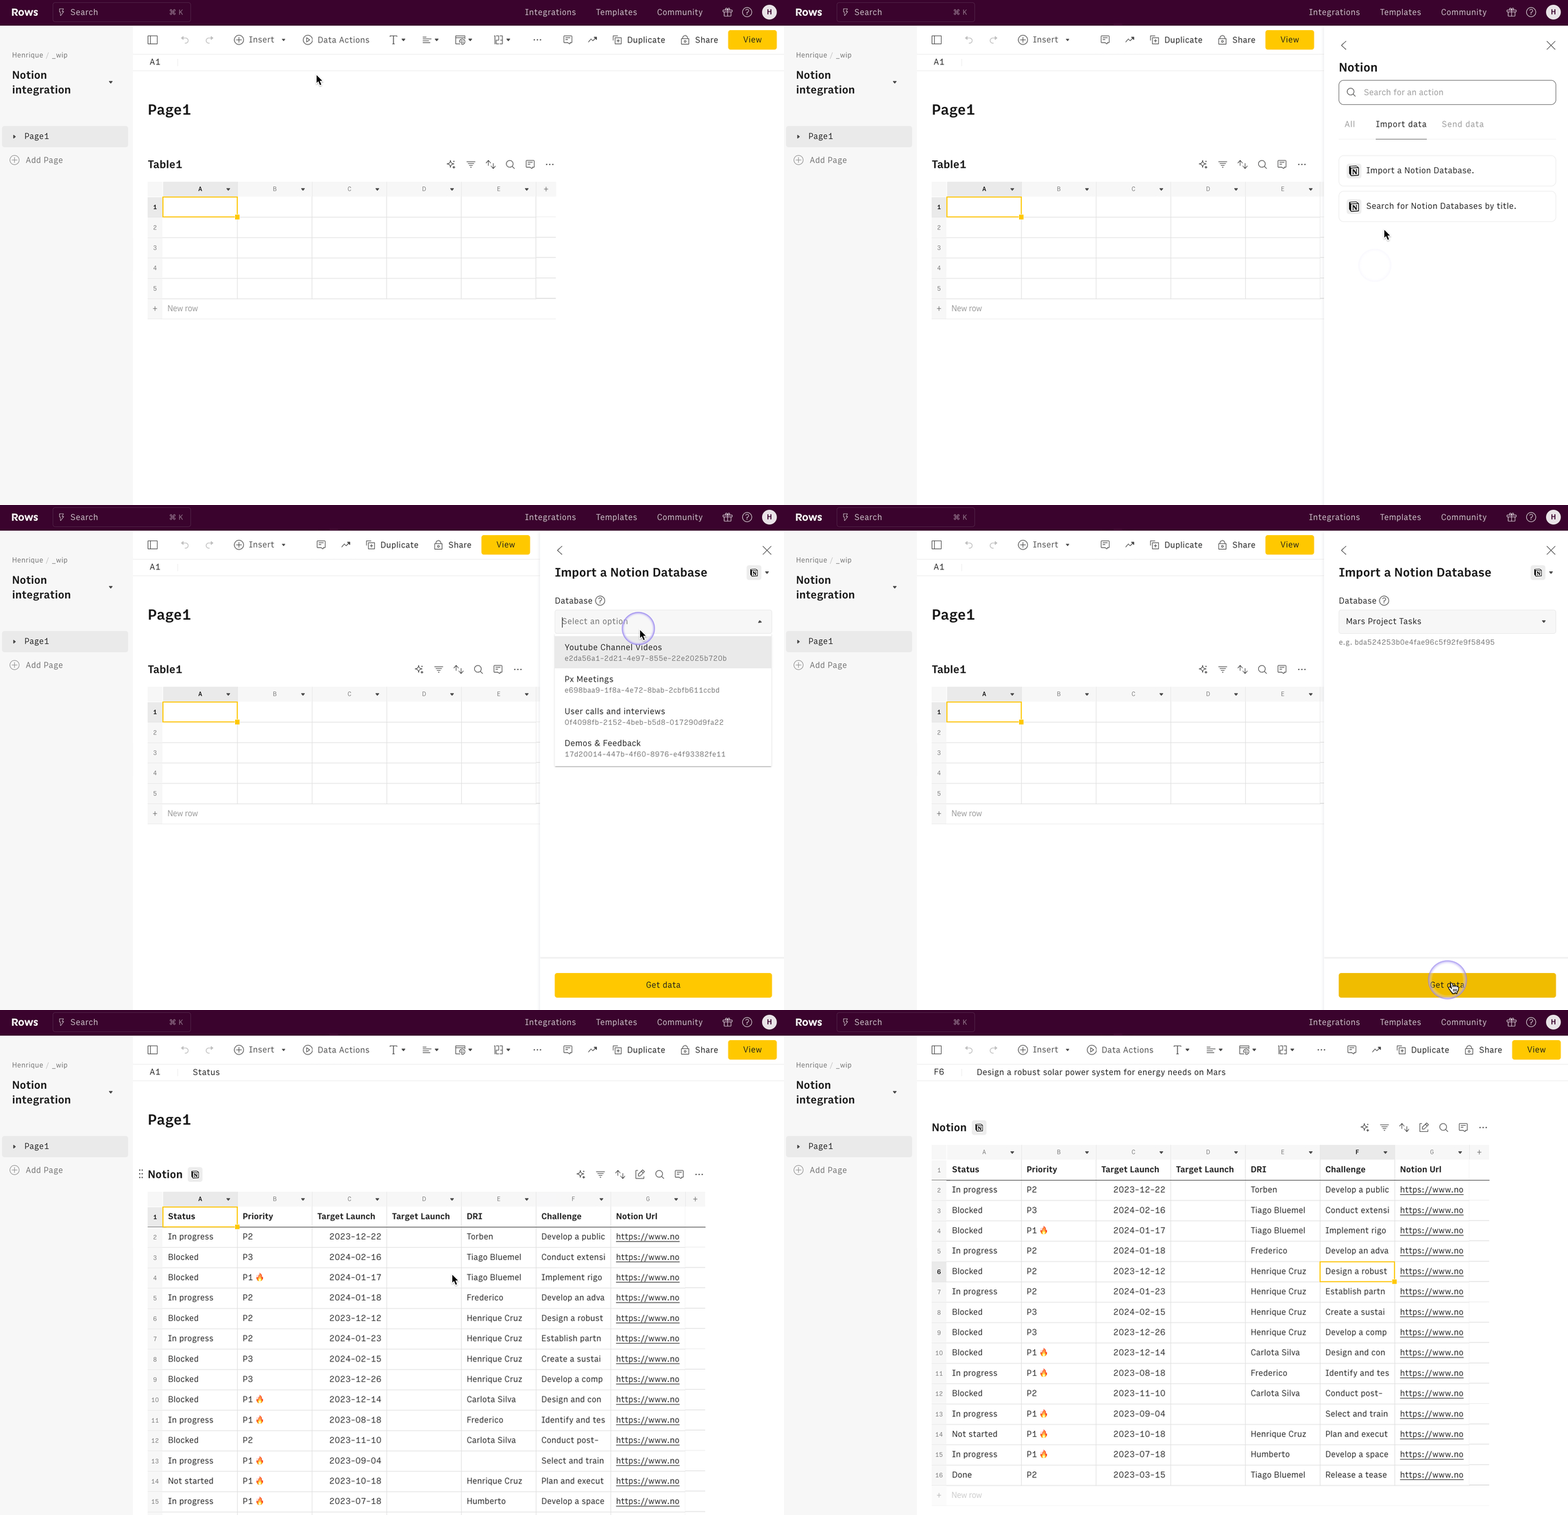
Integrate Notion databases with Rows
If you’re looking for a deeper integration between your Notion databases and a spreadsheet, Rows offers a native integration with Notion.
You can import your Notion databases directly to Rows and use the spreadsheet interface to add beautiful, flexible charts and reports to your Notion pages.
All you’ll need is:
An active Notion account with one or more databases.
A Rows.com account.
Appropriate permissions to integrate third-party apps within Notion
See how to harness the power of Notion in to Rows in our help guide.
 Sync your Notion databases with Rows in a few clicks
Automate all types of reports with Rows
With the flexibility of Notion and the functionalities of Rows, you can seamlessly integrate all your personal finance, marketing or other reports in Notion.
Explore the +100 different templates available in Rows' library to kickstart your reporting journey.

