How to Add Numbers in Google Sheets in 2025

You've got a pull of numerical figures on your sheet — it may be an invoice sheet, accounting report or product prices — and you are wondering how to add multiple figures without manually adding them yourself — Then this article is for you.
In this guide, you'll learn how to add numbers in Google Sheets in 2025.
How to Add Numbers in Google Sheets: Step-by-step guide
Here's a step-by-step guide on how to add numbers in Google Sheets using:
Selecting cell method
Addition (+) method
SUM method
SUMIF method

Your new AI Data Analyst
Extract from PDFs, import your business data, and analyze it using plain language.
Try Rows (no signup)Method 1: Selecting cell method
This method automatically generates the sum of any two or more numerical data you highlight. You can find the sum below your Google Sheets — on the bottom left corner precisely.
Method 2: Using the addition (+) sign method
You can add numbers using the plus (+) sign. Pick the cell references you want to add and put a plus sign in between each variable
For example:
=A1+B1+C1
Replace A1, B1, and C1 with the cells containing the numbers you want to add.
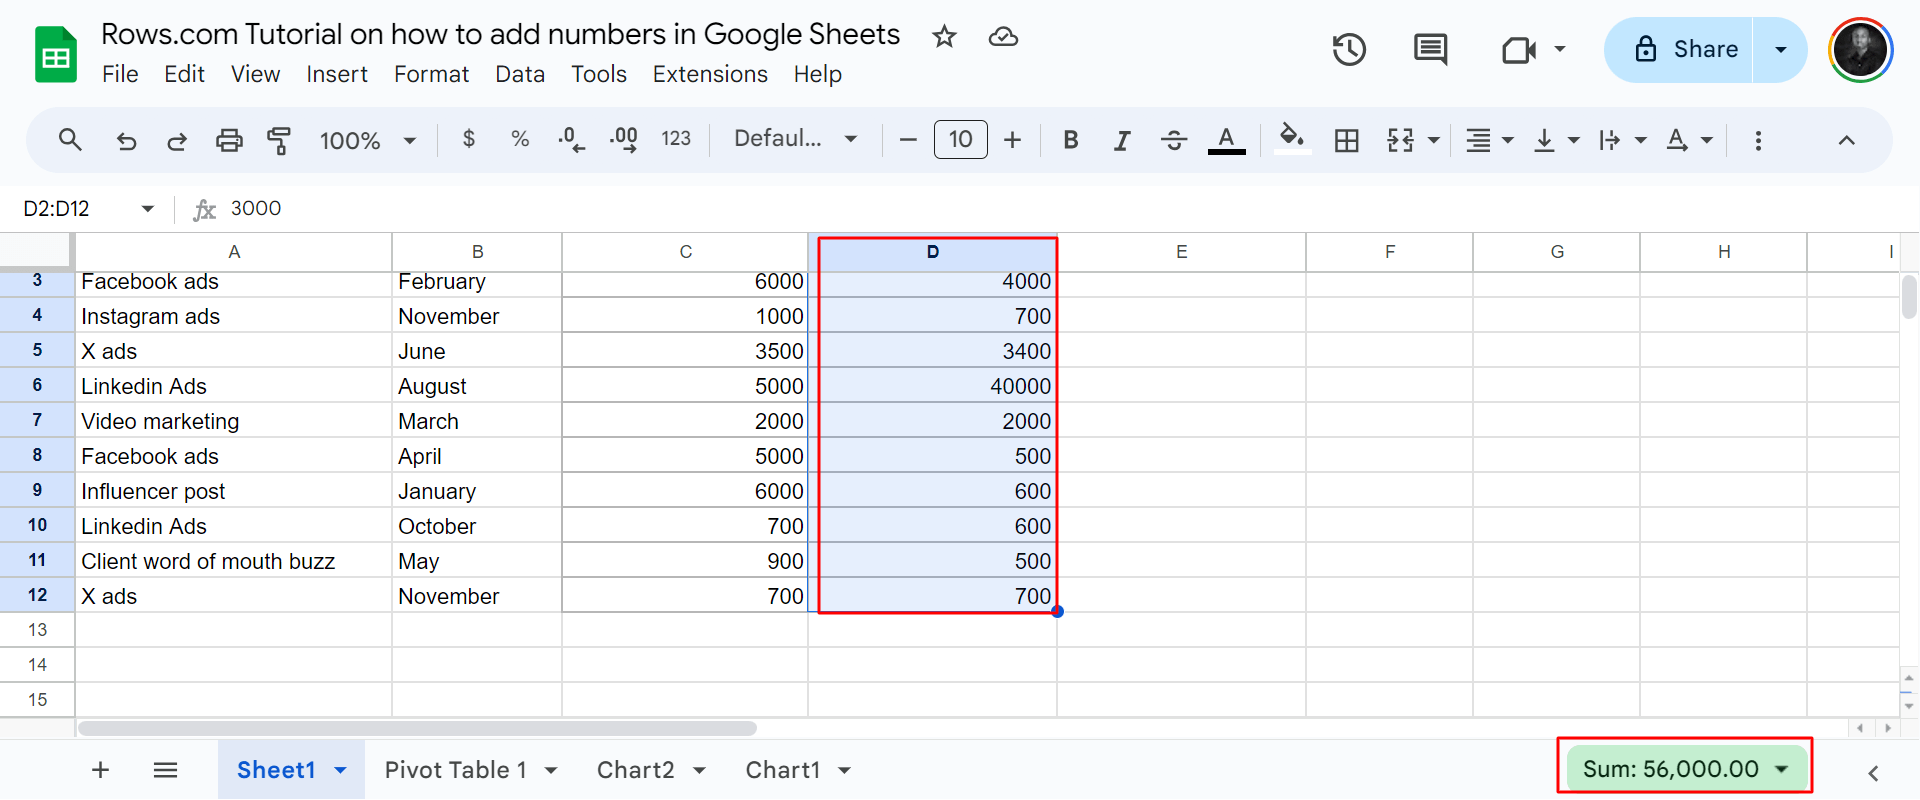
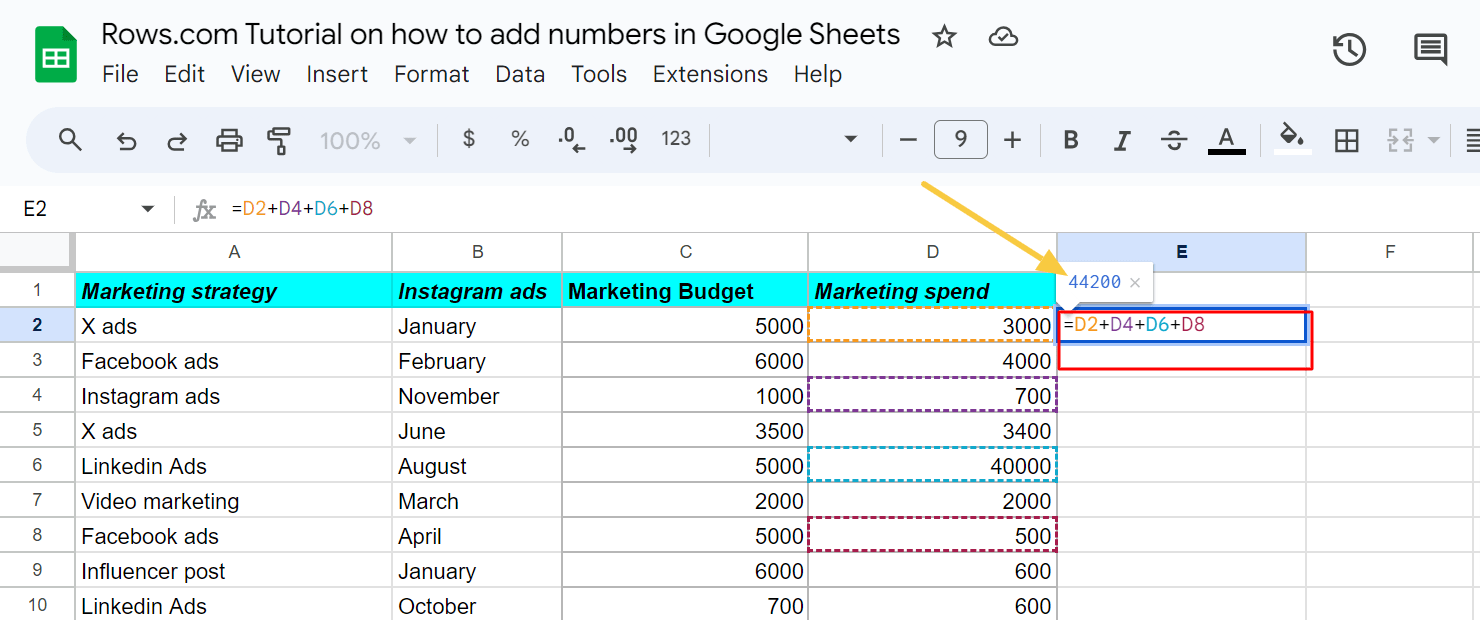
For the example below, I used D2, D4, D6 and D8, respectively. Once you type in the syntax, click the “enter tab” on your keyboard to see the sum of the cell references you picked.
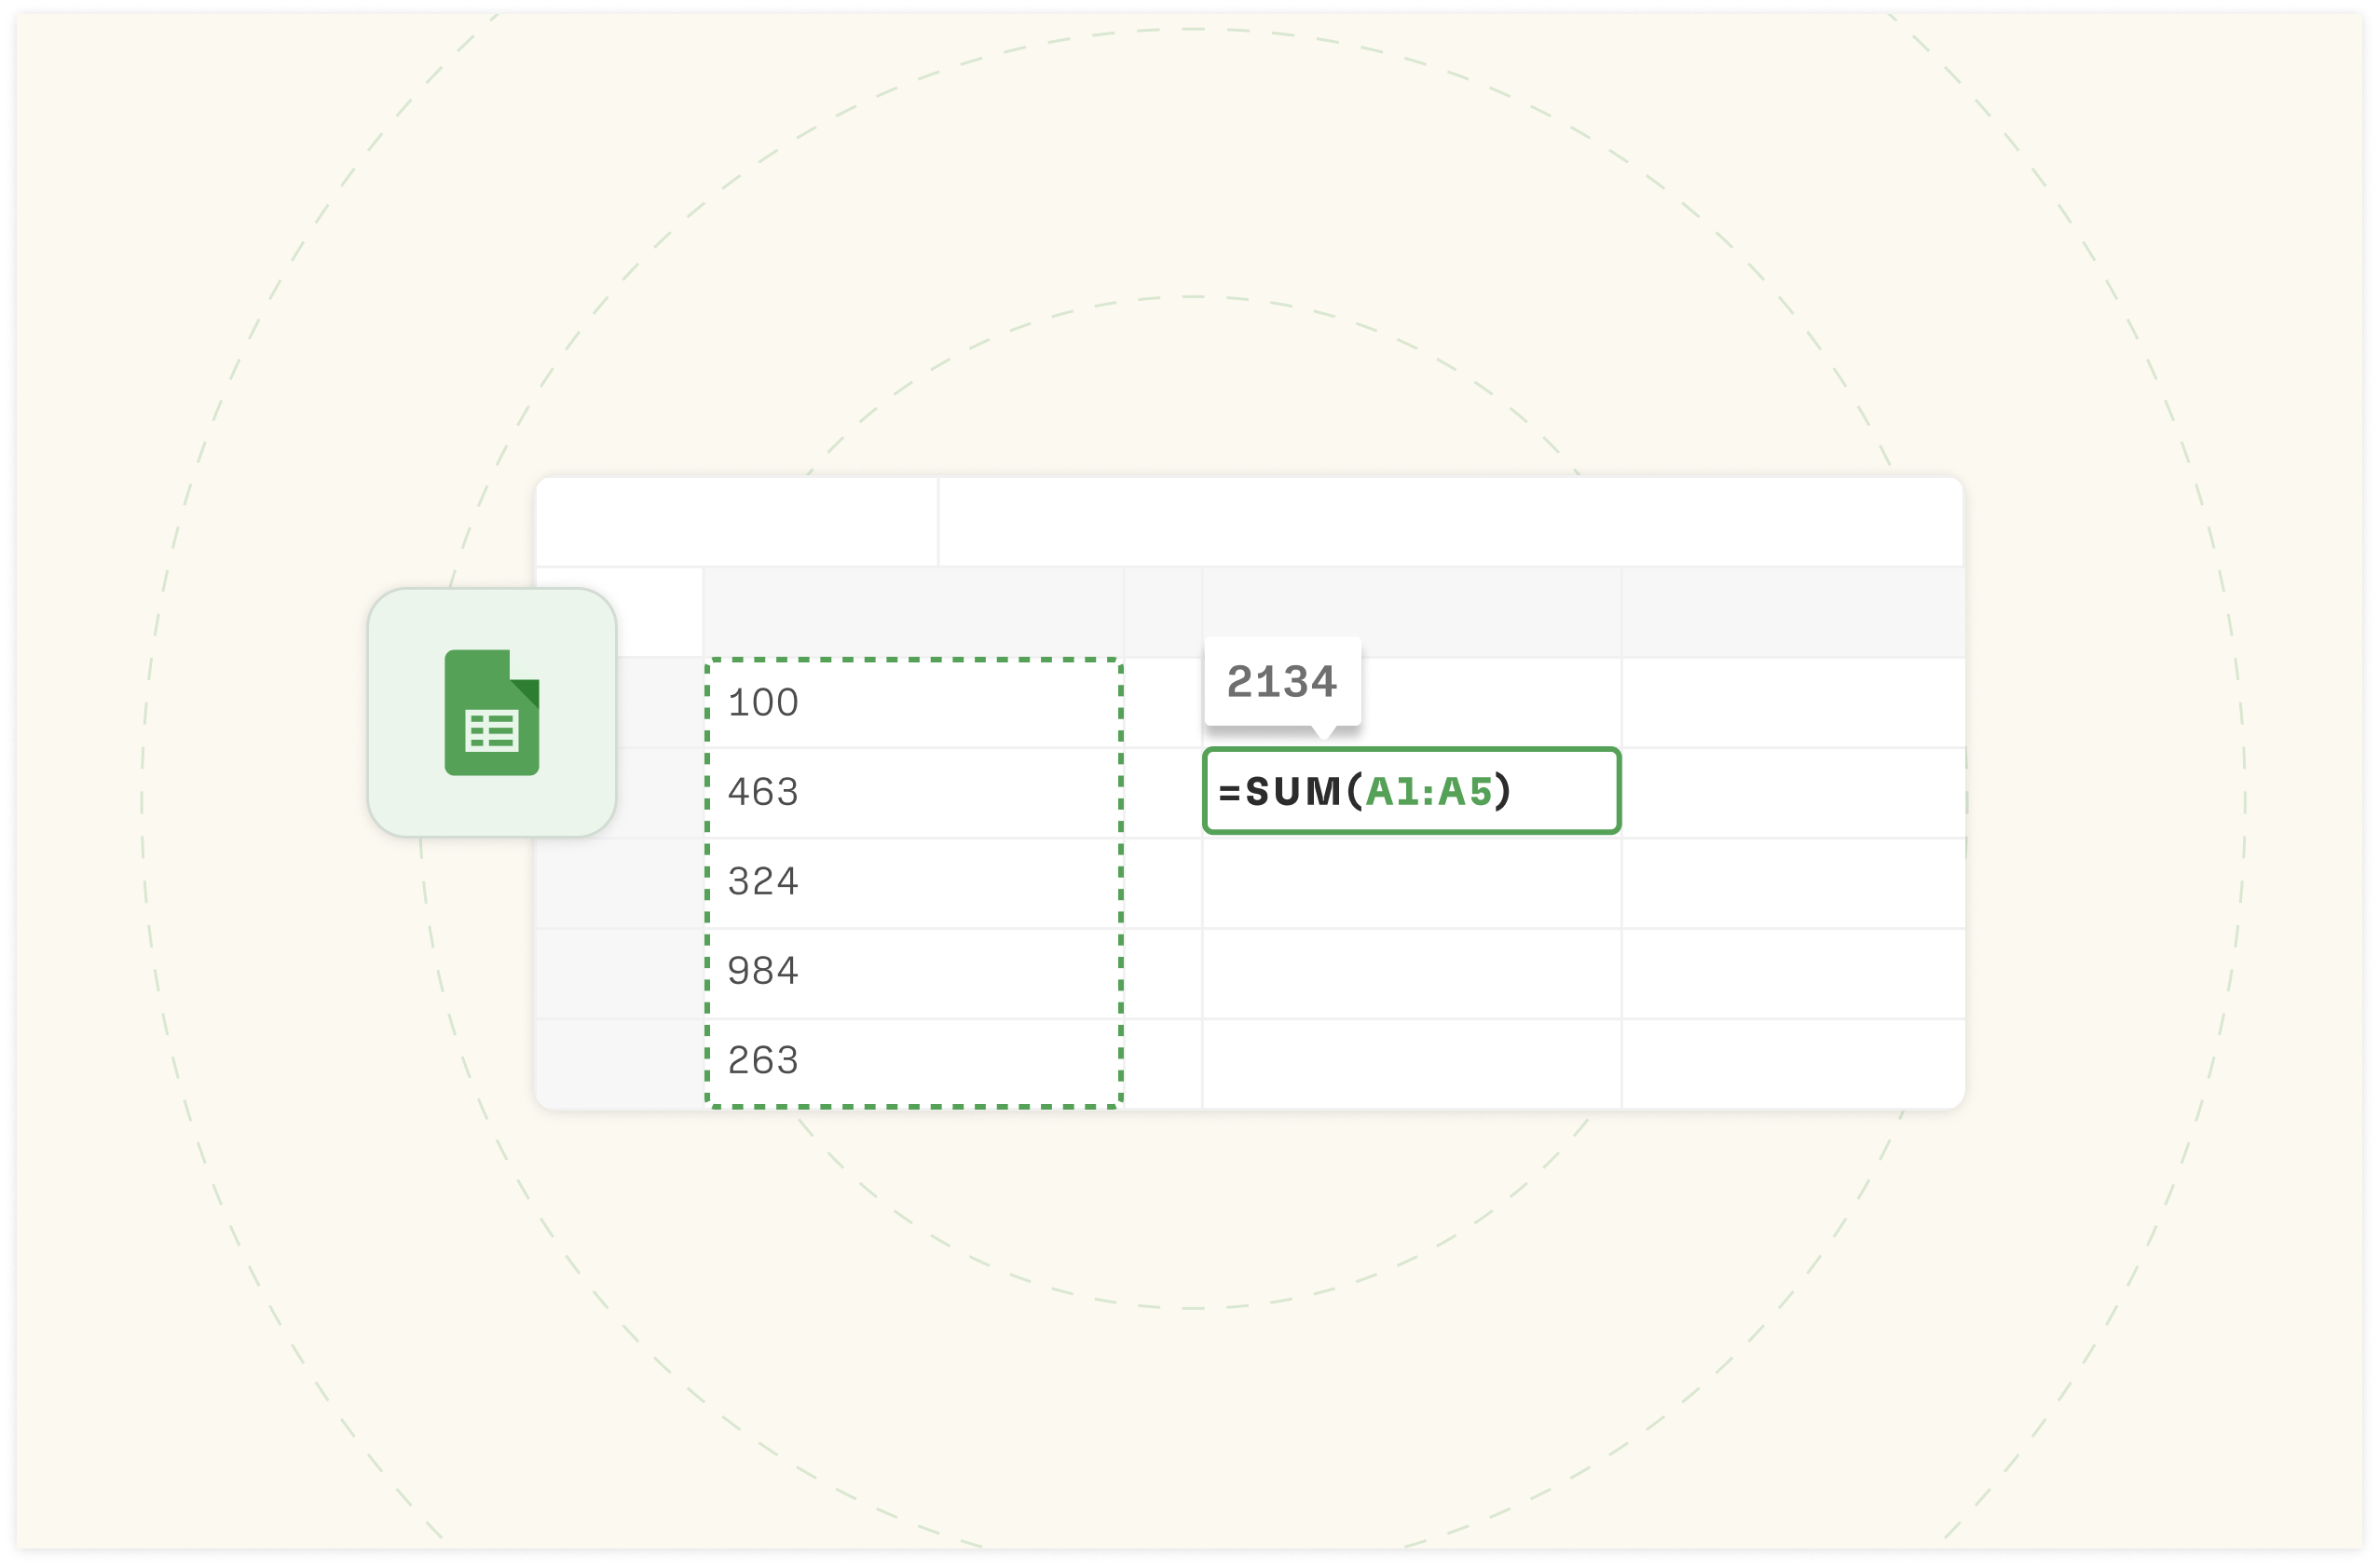
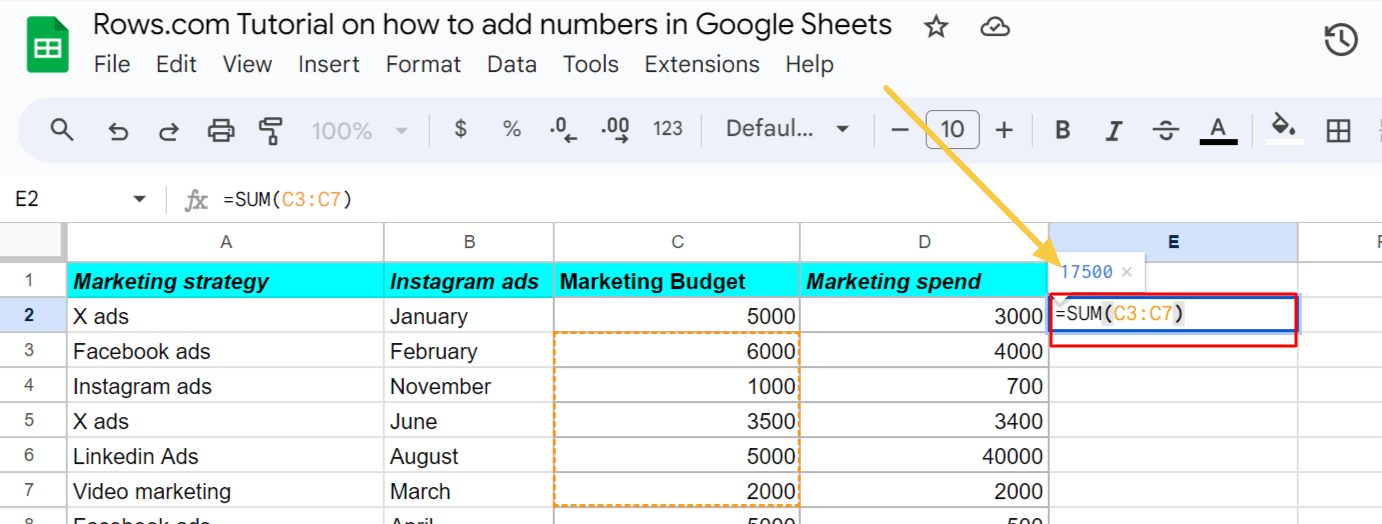
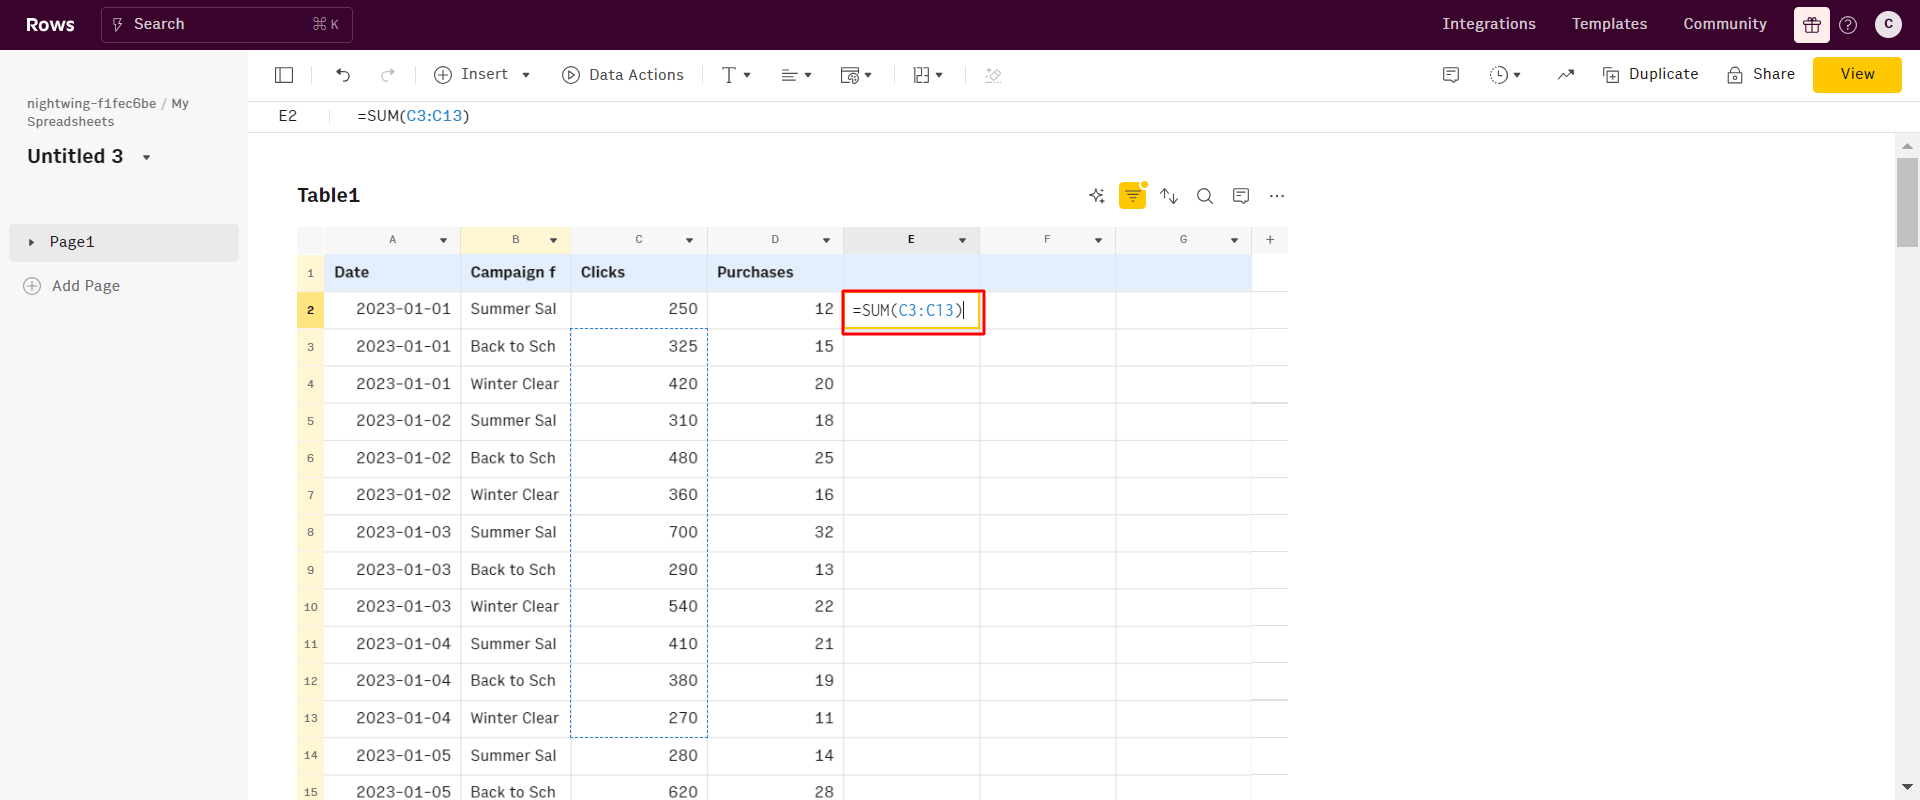
Method 3: Using SUM function
The SUM function is a built-in formula that adds all numbers in a range of cells.
Start with the syntax for SUM, which is —
=SUM(range)
- Inside the parentheses, enter the range of cells (e.g., C3:C7)
- You can add multiple ranges separated by commas
- Example: =SUM(A1:A10, C1:C10, E1:E10)
- This method is efficient for adding large ranges of cells
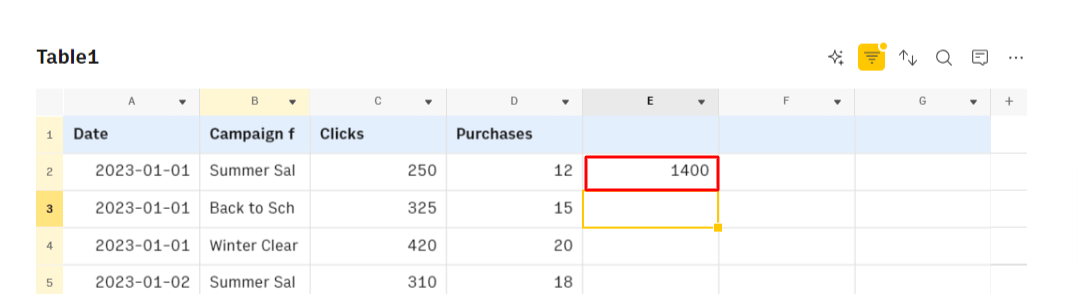
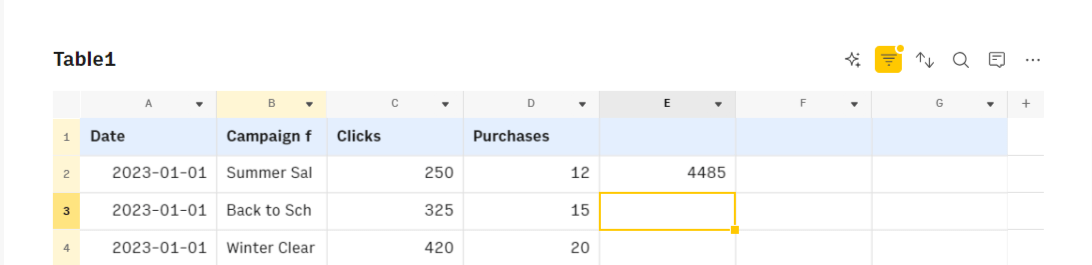
For this example, I sought the SUM of five cell references from C3 to C7.
After typing the syntax, you'll see the figure of the SUM execution.
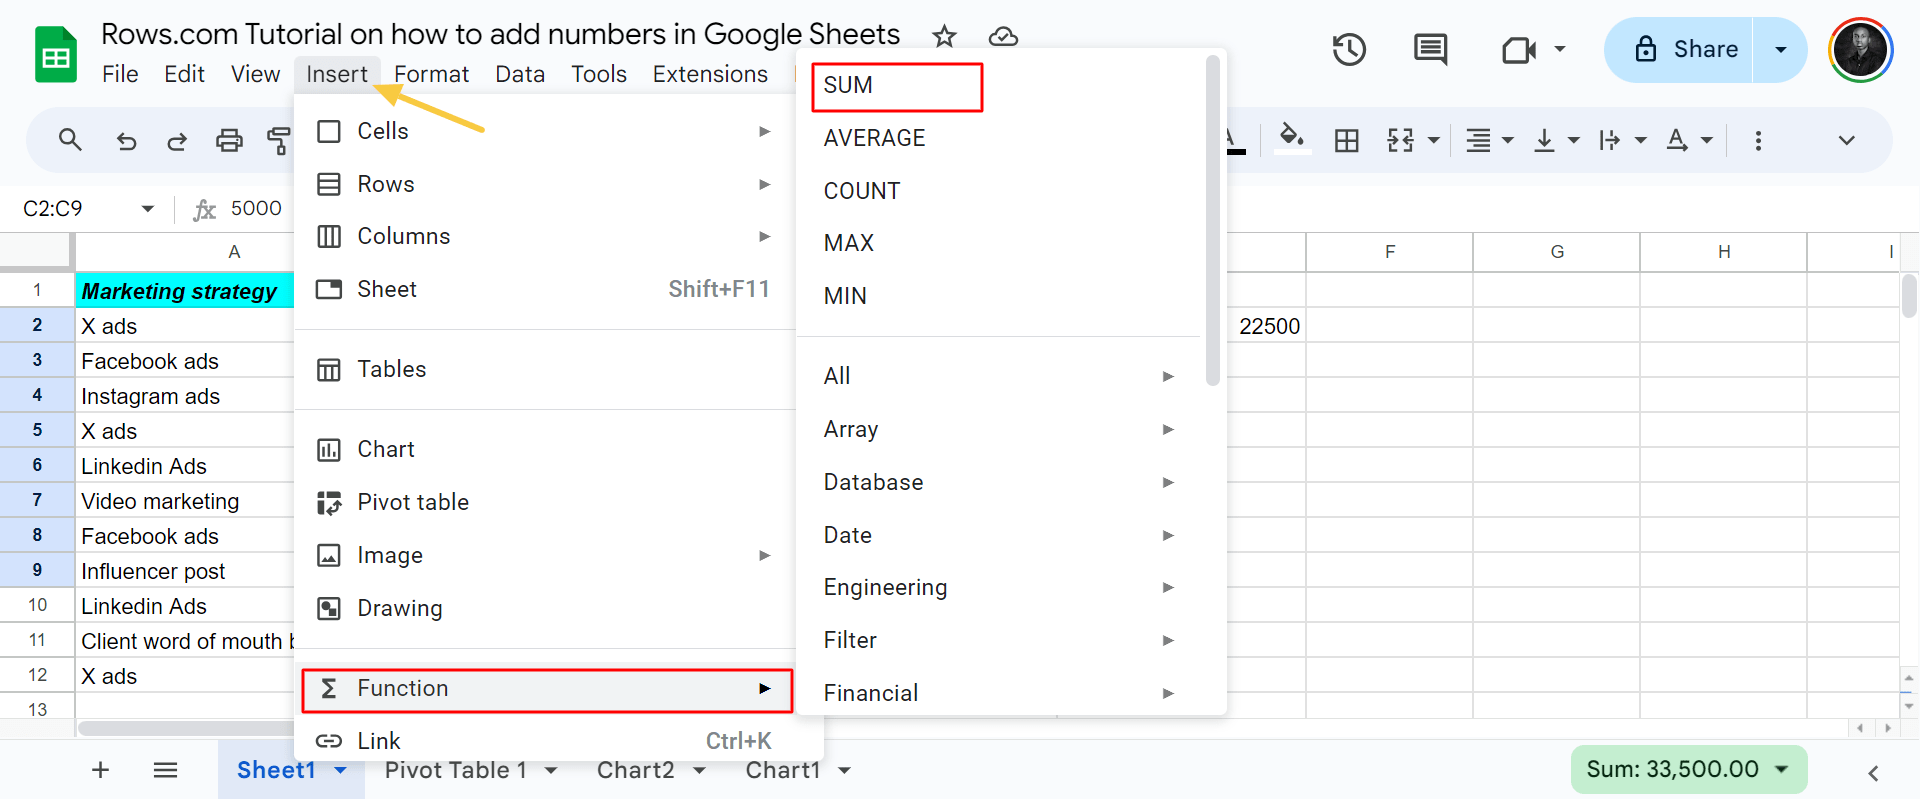
Another method to execute the SUM function is by doing the following —
Highlight the numbers you want to add.
Click on “Insert”
Once done, you'll see a pop-up of different functions — click “ function”.
Afterwards, click SUM to execute addition.
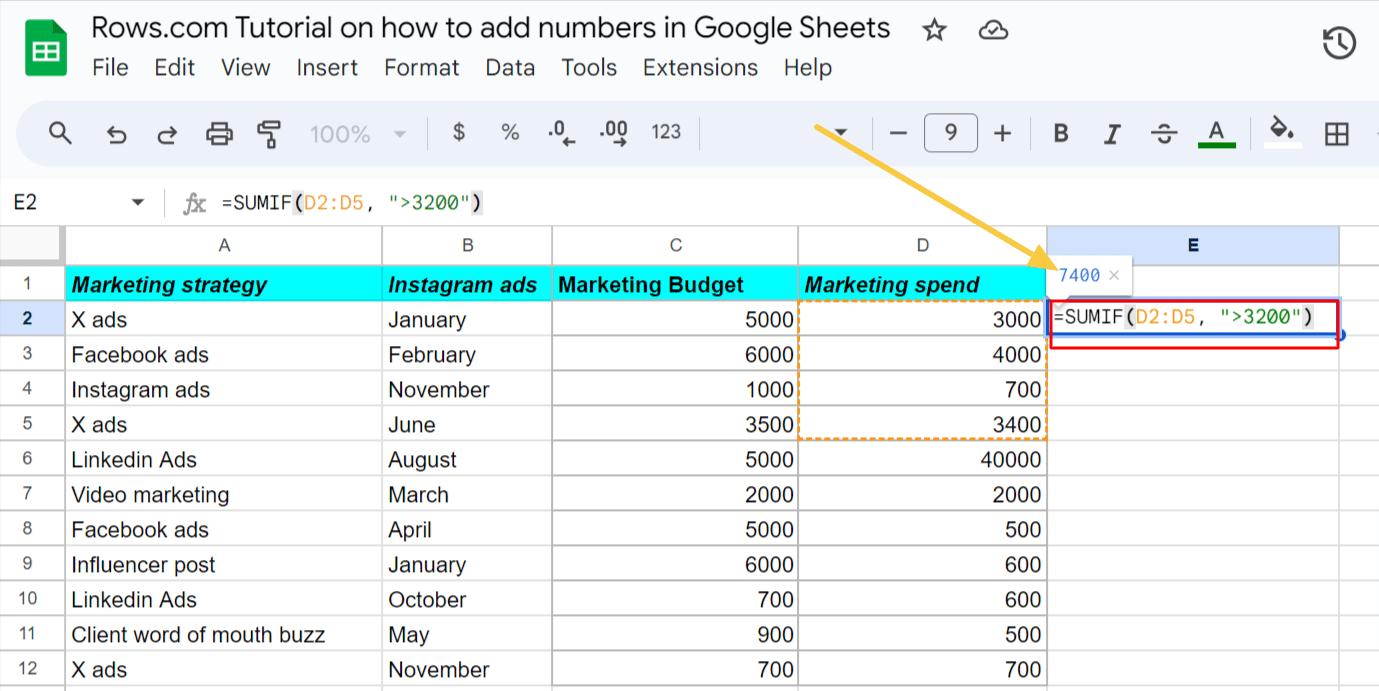
Method 4: Using SUMIF method
The SUMIF function adds numbers based on a specified condition.
Elaboration:
- Syntax: =SUMIF(range, criterion, [sum_range])
- range: The cells to evaluate
- criterion: The condition to check (e.g., ">100", "=Apple")
- sum_range: (Optional) The actual cells to sum if different from the range
- Example: =SUMIF(A1:A10, ">100", B1:B10) sums values in B1:B10 where the corresponding value in A1:A10 is greater than 100
- Useful for conditional summing based on a single criterion
Related: How to Add Date in Google Sheets [2025].
Common Mistakes to Avoid When Adding Numbers in Google Sheets
Avoiding common mistakes when adding numbers in Google Sheets will ensure accurate results and save time troubleshooting.
Look out for some of the most common errors:
Using the wrong function
Make sure to use SUM() for adding numbers, not functions like AVERAGE() or COUNT(). These functions serve different purposes and will give incorrect results when added.
Incorrect cell references
Double-check that you're including all the cells you want to add. Be careful with relative vs. absolute cell references ($ symbol). Mixing these up can lead to errors when copying formulas.
Including non-numeric data
Ensure all cells in your range contain only numbers. Text or empty cells can cause errors or unexpected results in your calculations.
Forgetting to update ranges
When adding new data, remember to extend your SUM range. Failing to do so will result in incomplete calculations that don't include your new data.
Mixing data types
Be cautious when adding cells with different formats (e.g., percentages and whole numbers). This can lead to unexpected results if not handled properly.
ICYMI: Common mistakes to avoid when using the Google Sheets Average formula.
How to Add Numbers in Rows [Easier Alternative]

Rows is a comprehensive spreadsheet for modern teams that offers a modern UI, built-in integrations for live data ingestion, and native AI capabilities (AI analyst, AI-generated subtitles, native AI functions).
To add numbers in Google Sheets, follow the same steps you'll use in Google Sheets — the two main methods are:
Method 1: Using the addition (+) sign
For this example, I add 4 cell references in the C column.
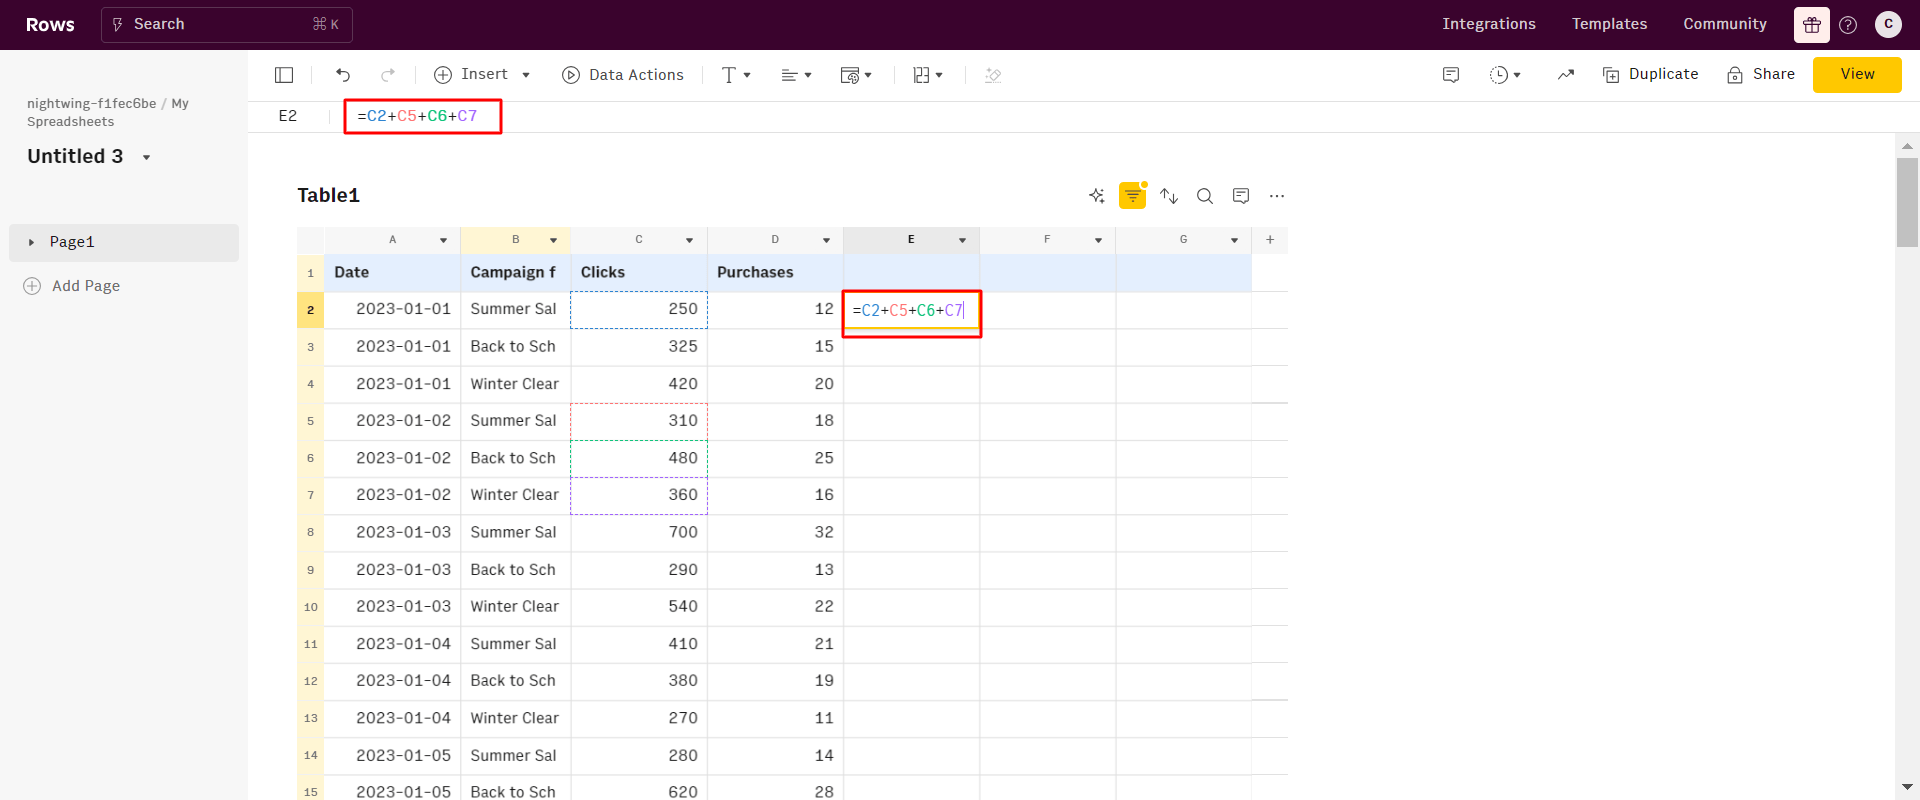
Afterwards, I clicked the “enter tab” on my keyboard. Below is the result.
Method 2: Using the SUM Function
Start with the syntax for SUM, which is —
=SUM(range).
Choose any data you wish to add and press “enter”.
Here's the result below —
Top features of Rows compared to Google Sheets
The methods for adding numbers in rows are not any different from what you can do in Google Sheets, but what makes them stand out?

The spreadsheet powered by AI
Supercharge your spreadsheet with modern UI, Data Aggregation capabilities, and AI automation.
Try Rows for FreeData aggregation — OpenAI integration
You can aggregate live data from 50+ sources in a very simple manner, thanks to built-in data integrations in various domains:
Marketing: GA4, GSC, Facebook, Instagram, TikTok, etc
Productivity software: OpenAI, Notion, Slack, Email, Translate
Data Warehouse: MySQL, BigQuery, PostgreSQL, Snowflake, Amazon Redshift
And many more.
See the example below, that showcases how to import live data from Notion:
AI-powered automation — Helps you automatically generate additions
With the AI Analyst, you can ask AI to analyze, summarize, transform, and enrich your analysis. Click on the "AI Analyst“ ✨ icon, at the top right corner of any table.
A chat interface will open on the right: you can ask a broad range of questions, from basic spreadsheet commands - plotting a chart or adding or formatting columns - to more complex tasks, such as slicing, pivoting, or computing metrics about your data.
For example, given a dataset with daily revenue and costs of various marketing campaigns, you can ask the Analyst to add a column with the profit margin. Watch the video below:
In addition, our AI Analyst is instructed to use our native OpenAI functions to perform data enrichment or extraction tasks.
For example, you can ask the AI analyst to run a sentiment analysis on a column with product reviews, or add a column that categorizes addresses into regions, see below:
Want to know more about how our Analyst works? Check out our guide or watch our demo.
Modern UI
Spreadsheets in Rows present a document-like layout with standalone tables and charts stacked vertically and horizontally.
WYSIWYG: the spreadsheet IS the dashboard. All data is rendered as regular spreadsheet tables. You can move elements vertically and horizontally with drag and drop. And if something breaks, you can intervene on that table or chart flexibly, without the need to dive into complex workflows.
View Mode: View mode makes your spreadsheets work like web applications. With input fields, you can help anyone understand how to use your spreadsheet by highlighting the cells that need input by the user.
Read more: How to Calculate and Use Averages in Google Sheets in 2025.
Supercharge your sheets with Rows
With Rows, you can access 50+ built-in data source integrations in various domains.
This makes it easy to quickly ingest data into your table and reduces your team's stress.
With Rows, you can gather data from various sources in your system. This allows for more detailed analyses and helps your team uncover insights they might miss.
Ready to get started with Rows.com? Start using the product right away for free.