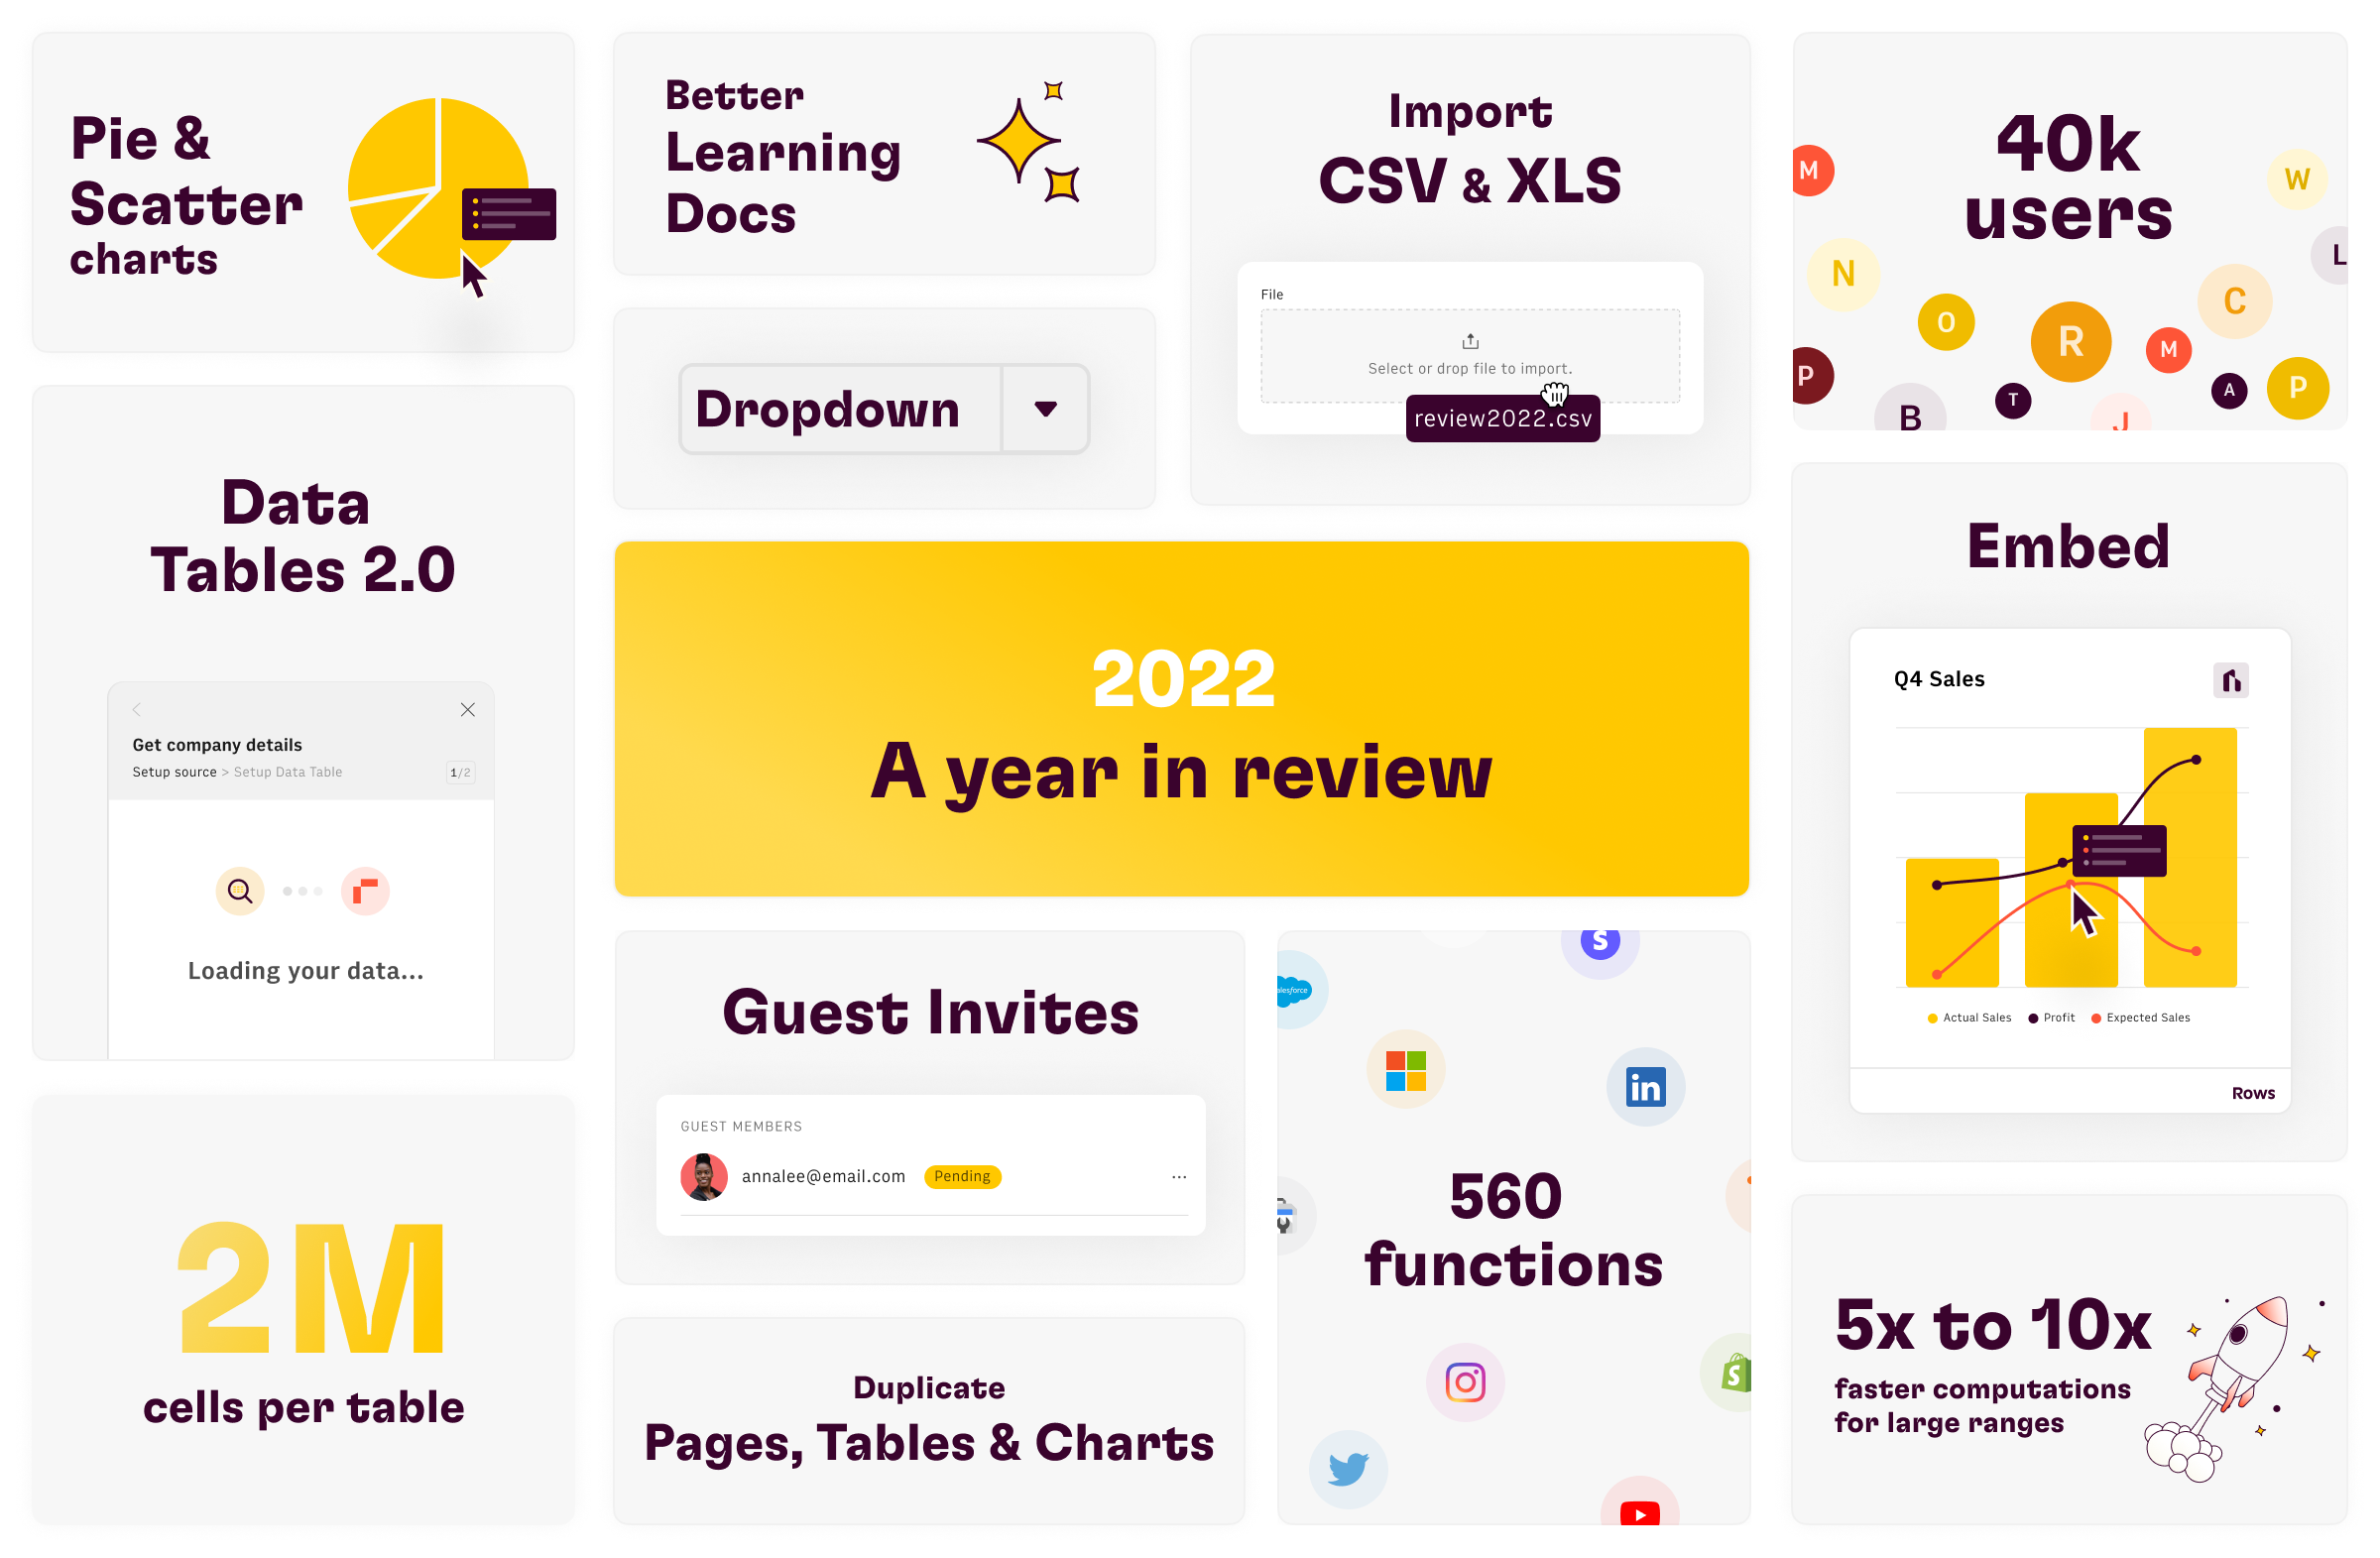
2022: A year in review


It is always hard to write the first paragraphs of a “year in review” post. To find the right balance between something that captures our sense of the year and that fits elegantly into our story at Rows. So this year, we thought the most appropriate way to start would be by asking ChatGPT to summarize the year:
“As we bid farewell to 2022, it's time to reflect on the events of the past year. From the ongoing pandemic to political upheaval, it's been a tumultuous twelve months. But despite the challenges we faced, there were also moments of hope and triumph that remind us of the resilience of the human spirit. As we look back on this wild ride of a year, let's take a moment to remember all that happened in 2022.”
In our spreadsheet world, 2022 was a step-change in our mission of building the spreadsheet where data comes to life. Let’s take ChatGPT’s cue and remember all somethings that happened in 2022.
The spreadsheet where data comes to life
Let’s start with the update to the Rows’ brand. If 2021 was the year of the “spreadsheet with superpowers”, 2022 was the year where teams expanded their use of Rows to their go-to spreadsheet to import, analyze and share their business data.
Inspired by the stories of teams like Vegconomist, edtech organizations like Finance Academy and do-it-all freelancers such as Diogo, we updated our website, communication and messaging with a renewed ambition that reflects a new Rows: the modern alternative to decades old spreadsheets.
We had fun in the process too, and the media took notice. There was a tweet that got us into Wired, a startup list that got a whole country talking about us, and a couple of irreverent billboards that got us in the tech news.
2022 was also the year we took our “build in public” further and launched a weekly CEO-diary-style series.
During the rest of the year we focused on taking the product experience to the next level in 3 areas: importing data into Rows, making sense of that data, and sharing it with others.
Importing data
Every spreadsheet needs a start. This year we added a new way of getting your data to Rows: by importing .csv and .xlsx files. Teams can import up to 100 MBs of data in one-go to analyze large chunks of data quickly. And for those who like a helping hand, we updated all of our templates, and added +20 new ones to make starting with Rows as easy as possible.
But the biggest project of the year on the data front was the new Actions wizard and Data tables. Now, in one single motion you go from an idea - “Google Analytics report” - to the final result without typing a single formula.
Making sense of the data
Once the data is in, it’s time to make sense of it. This year we added +10 features for teams to read, summarize and crunch numbers in a spreadsheet.
For our visual thinkers, we added conditional formatting, scatter and pie charts, and increased the number of Tables per Page to 10 to give everyone extra flexibility on how to organize their data.
For the power-hungry, each spreadsheet table can now hold up to 2 Million cells split into matrices to 100k rows and 400 cols and we sped up our computation engine 5-10x across the board.
And for the analytical minded, the new QUERY function is the perfect playground to explore data. Combine its SQL-like interface with the actions wizard to answer data questions using natural language.
Next up we’re adding pivot tables, freeze panes and other ways to understand data.
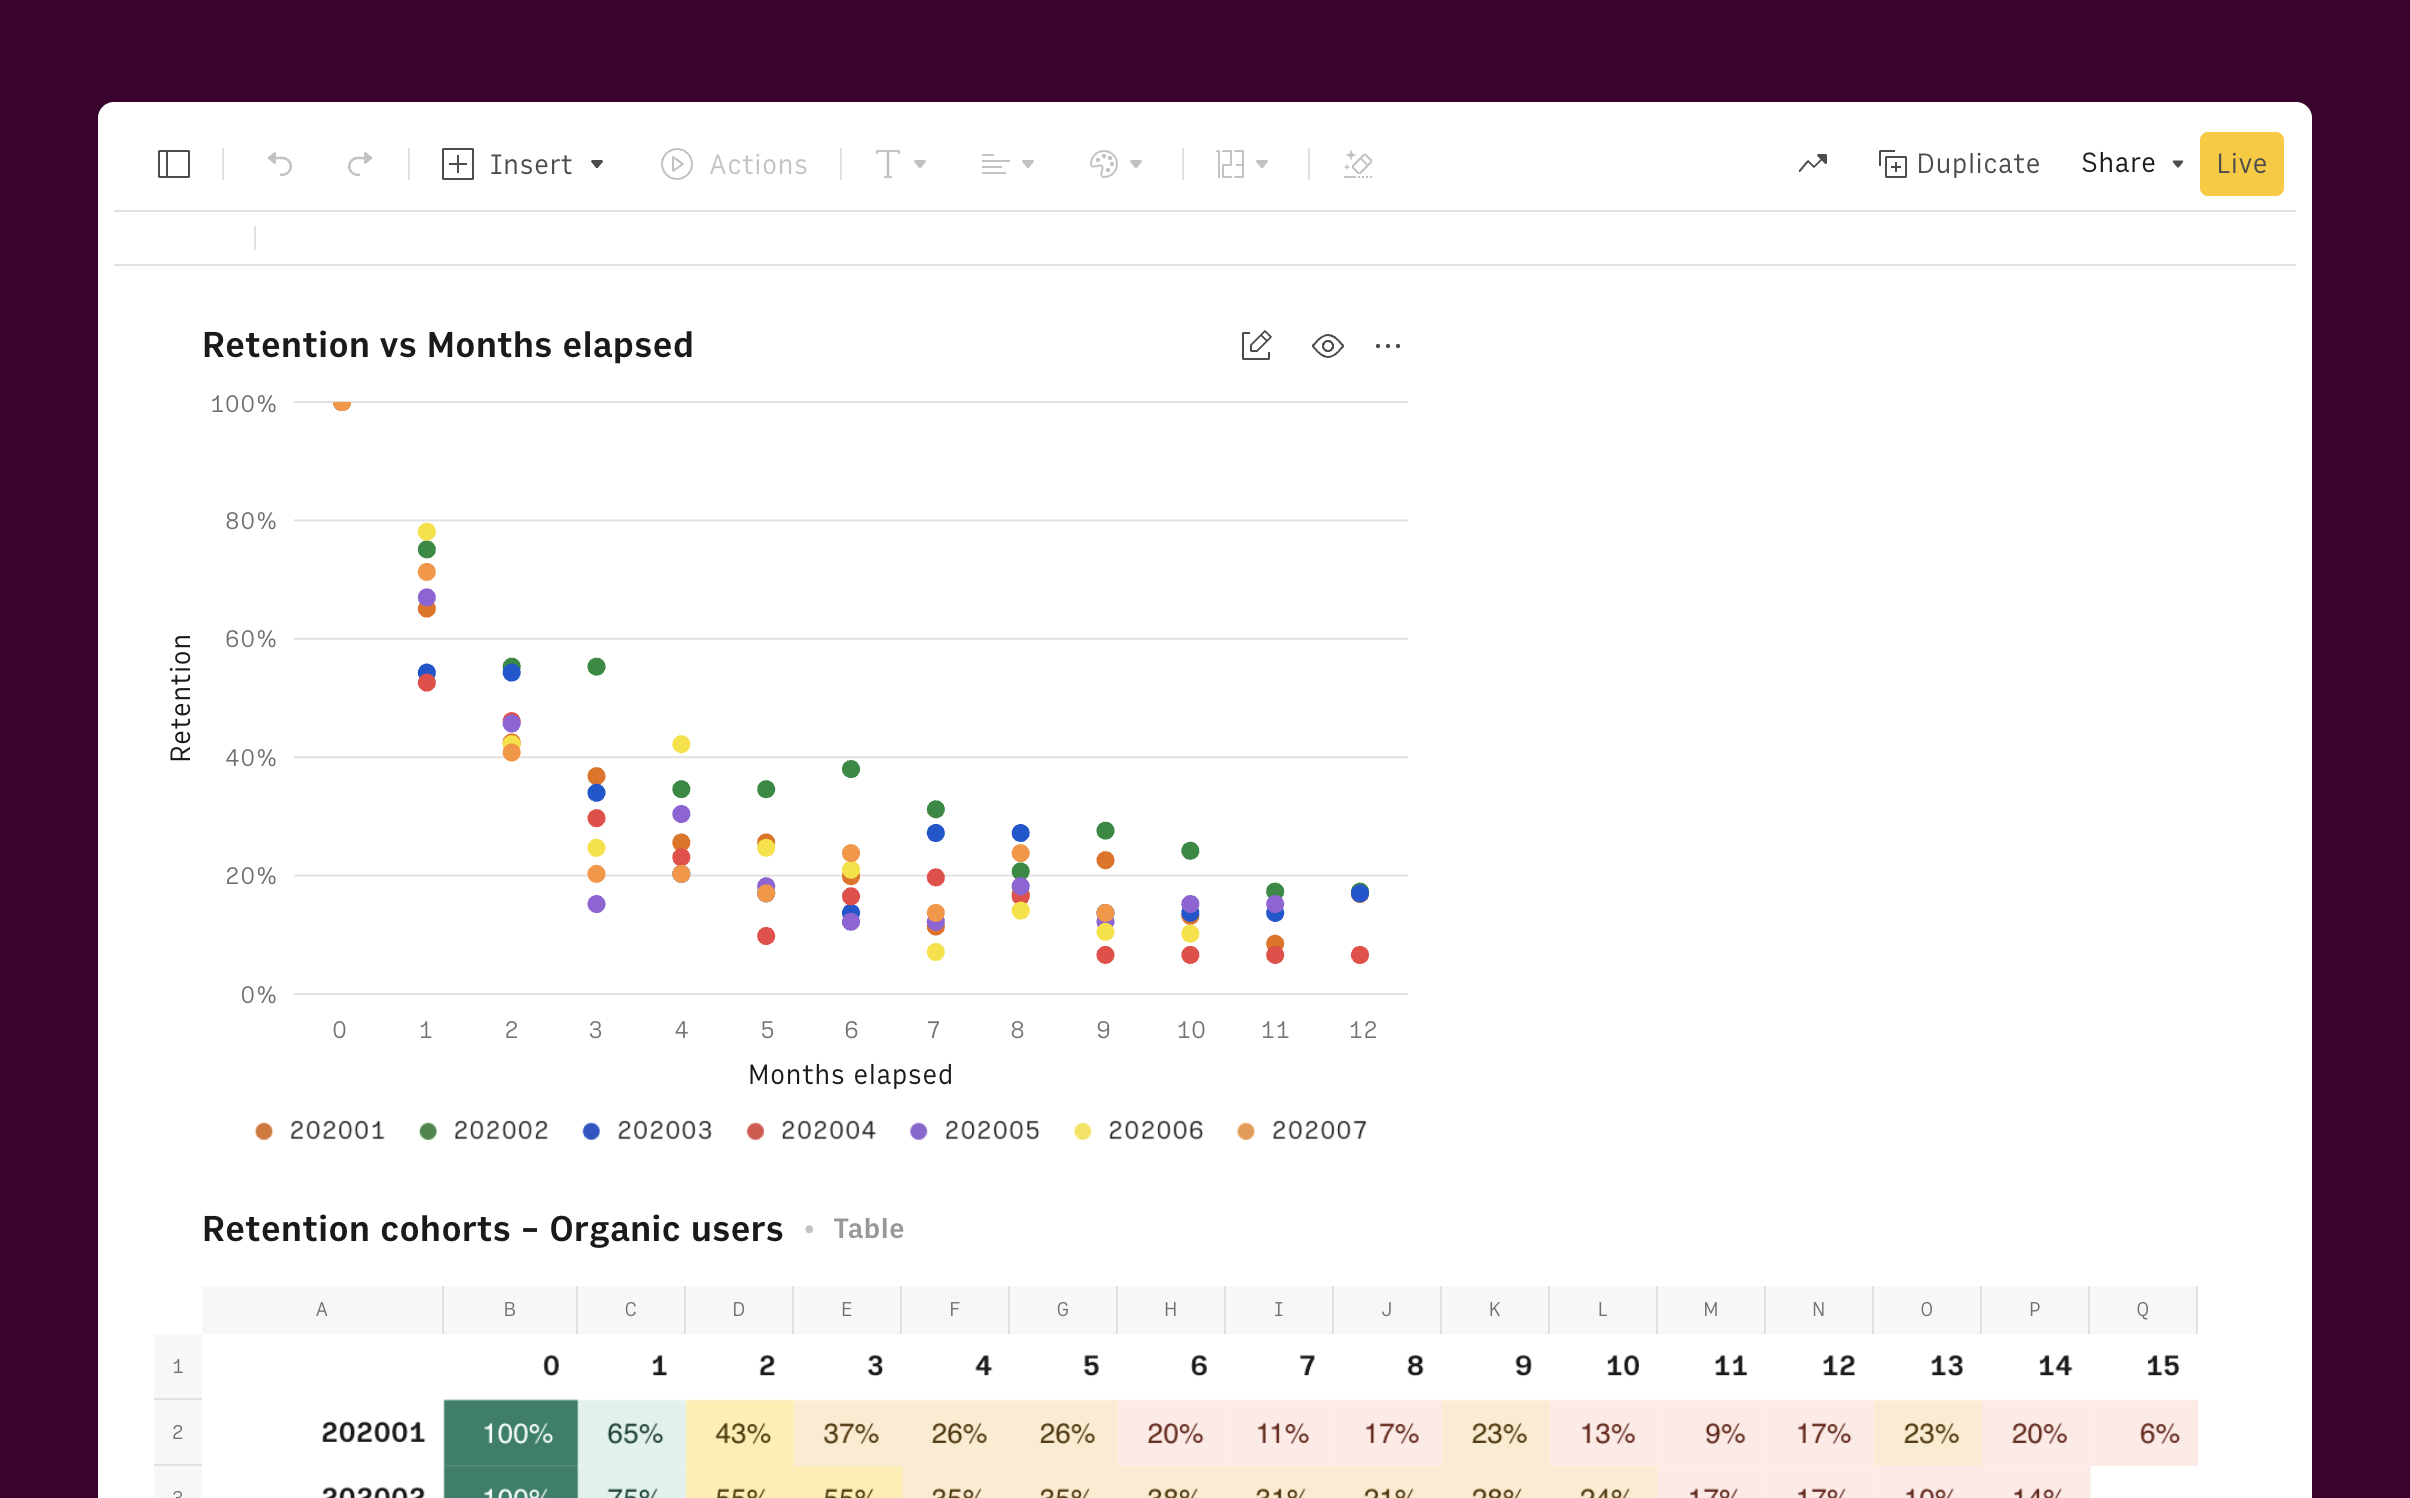 A look into the new scatter charts and conditional formatting
Sharing the data
Rows is better when your team is on it.
In 2022 we took collaboration one step further in 3 big ways.
With guests, teams can add collaborators to specific spreadsheets. Perfect to share work with clients, suppliers, or dashboards with investors.
With chart exports, analysts, marketers and content creators share beautiful branded images of their visualizations on Slack, wiki documents and Substack newsletters. Just like Rohit did in his thought-provoking 'Mythology of Genius' article.
Finally, Embeds took the meaning of sharing spreadsheets to a new level. Now anyone can take their charts, tables, calculators and forms and connect them to their Notion pages (like Nic’s Personal Finance playbook) personal Softr websites (like Mario’s salary calculator), internal team reports (like Vegconomist's LinkedIn post report), or year in review blog posts 😉
2023, the year ahead
To wrap up, we turned once again to our AI friend for a suggestion on the outlook for 2023. We got his best Tony Robbins impression, and we’re sticking with it:
“As we enter 2023, it's time to toss out those old, outdated spreadsheets and embrace the limitless potential of the coming year. This is the time to shake off the cobwebs and make some bold moves. After all, 2023 is a blank slate just waiting to be filled with all of our wildest dreams and aspirations. So let's get out there and make the most of it. Who knows, with a little hard work and a whole lot of determination, we might just surprise ourselves with what we're capable of achieving.”
Let’s shake off the cobwebs and make some bold moves. For us, that includes a mix of long awaited features - our API, Pivot tables, Freeze panes and new integrations with data warehouses - and a few surprising ones.
Here’s to a fantastic 2023,
Humberto, on behalf of the entire Rows team

