What is the QUERY function
The QUERY function in Rows allows you to use SQL (Structured Query Language) to analyze and manipulate data in your spreadsheet. It is a very powerful and versatile function that can be used to perform a wide variety of tasks, such as filtering data, calculating statistics, and even joining data from multiple sheets or tables.
How does the QUERY function work
The syntax for the QUERY function looks like this; =QUERY(data,query,[headers])
It takes 3 arguments
- data
- query
- (Optional)[headers]
Let's first define what these 3 mean.
data
This is the data from the spreadsheet range you want to query. There are 4 ways the data can be expressed;
- As something distinct, such as A1
- As an entire column, such as A
- As literals, such as 'Jack & Jill' NOTE: Each literal is separated by a comma and would be placed in its own column.
- As an aggregate function, such as SUM, COUNT, AVERAGE, MIN & MAX. Note: Aggregate functions are mostly used with the GROUP BY clause.
query
This is the SQL command that will be used against the data provided. The SQL command consists of several clauses, some of which are mandatory and others which are optional. Below is a definitive list of all clauses available within Rows.
Leaving this argument empty will result in a "SELECT *" command that will return all results from the requested data.
headers
This is how many rows are considered the headers of the data. The default is 1.
Query commands
Below we will outline the basics of what can be done through SQL, but we highly advise familiarising yourself with SQL through other educational content.
It is important to note that the clauses should always be used in this order;
| Clause | Rows | Google Sheets* |
|---|---|---|
| select | ✅ | ✅ |
| where | ✅ | ✅ |
| group by | ✅ | ✅ |
| pivot | ✅ | ✅ |
| order by | ✅ | ✅ |
| limit | ✅ | ✅ |
| label | ✅ | ✅ |
| in | ✅ | ✅ |
| not in | ✅ | ✅ |
| having | ✅ | ✅ |
| where not | ✅ | ❌ |
| as | ✅ | ❌ |
* as on 2025-04-07
SELECT
This supports 2 methods;
Selections with SELECT or mathematical operations with SUM, MIN, MAX, AVERAGE, COUNT.
WHERE
WHERE is a conditional clause used to filter the data. It accepts all arithmetic operators, such as;
- = is equal to
- != is not equal to
- > is greater than
- < is less than
- >= is greater than or equal to
- <= is less than or equal to
- contains
- not contains
- like
- is not null
- is null
- starts with
- ends with
- matches: matches uses regular expressions to evaluate the match between the value and the syntax in the where clause:
- Use '' to for exact matches (e.g.
WHERE B MATCHES 'Bananas') - Use . for partial matches (e.g. `WHERE B MATCHES '.*ana.'`)
- Use '' to for exact matches (e.g.
Note: Strings will need to be wrapped in single quotes but numbers should not be.
| Conditions | Rows | Google Sheets* |
|---|---|---|
| = (is equal to) | ✅ | ✅ |
| != (is not equal to) | ✅ | ✅ |
| > (is greater than) | ✅ | ✅ |
| < (is less than) | ✅ | ✅ |
| >= (is greater than or equal to) | ✅ | ✅ |
| <= (is less than or equal to) | ✅ | ✅ |
| contains | ✅ | ✅ |
| not contains | ✅ | ❌ |
| like | ✅ | ✅ |
| is not null | ✅ | ✅ |
| is null | ✅ | ✅ |
| starts with | ✅ | ✅ |
| ends with | ✅ | ✅ |
| matches | ✅ | ✅ |
* as on 2025-04-07
Group By
GROUP BY allows you to group the result set by one or more columns, providing a more granular view of the data.
It can be useful when you want to summarize or analyze data in your spreadsheet by groups or categories. For example, you could use the GROUP BY clause to calculate the average cost, maximum quantity, or total sales for each product category.
It is typically used in combination with one or more aggregate functions, such as SUM, AVG, MIN, MAX, or COUNT, to perform calculations on the grouped data.
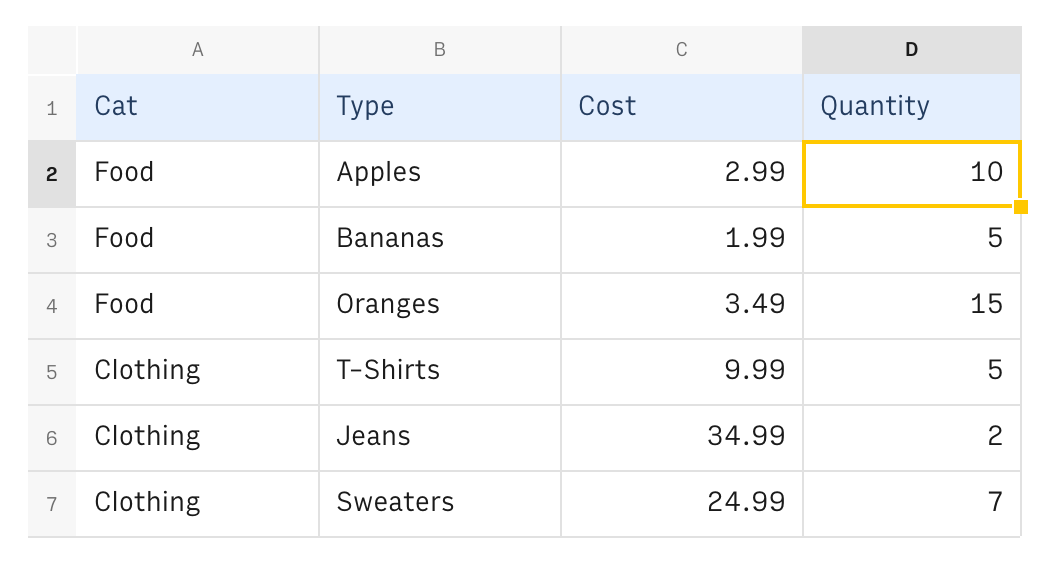
For example, consider the table below;
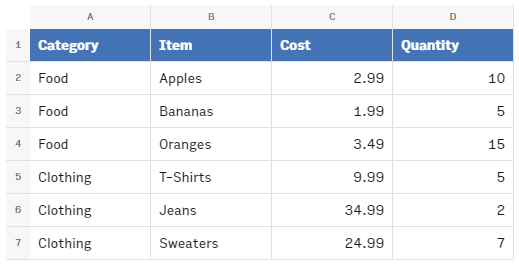
If we wanted to create a pivot table that shows the total cost of each item within each category, we can use the following QUERY function:
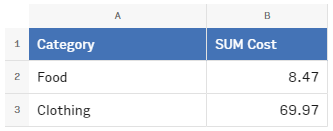
=QUERY(A1:D7,"SELECT A, SUM(C) GROUP BY A")
This produces the following table:
Pivot
PIVOT is used to rearrange and summarize the data in a table. It allows you to transpose the data from a horizontal orientation (rows) to a vertical orientation (columns), or vice versa. This can be useful for creating pivot tables, which are a common way of summarizing and analyzing large sets of data.
Take the table below as an example:
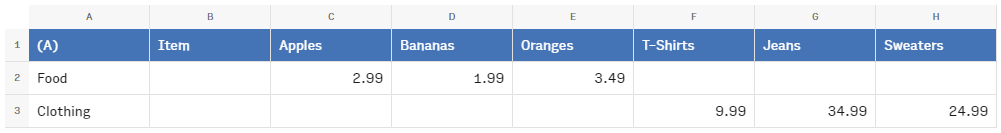
For example, if we wanted to create a pivot table that shows the total cost of each item within each category, we could use the following QUERY function:
=QUERY(A2:D7,"SELECT A, SUM(C) group by A PIVOT B")
In this example, the PIVOT clause is used to convert the Item data from a horizontal orientation (rows) to a vertical orientation (columns), with one column for each Item. The SUM function is used to calculate the total quantity sold for each product. The result of this would be the table below:
Order By
ORDER BY is used in the QUERY function to sort the rows of a table based on the values in one or more columns.
It can be useful when you want to present your query results in a specific order, e.g.alphabetical, by date, or by a custom order that you specify.
Ascending order is the default. You can also use the DESC keyword with the ORDER BY clause to specify that the rows should be sorted in descending order.e.g. to sort in reverse alphabetical order, by the latest date, or by the highest or lowest values in a column.
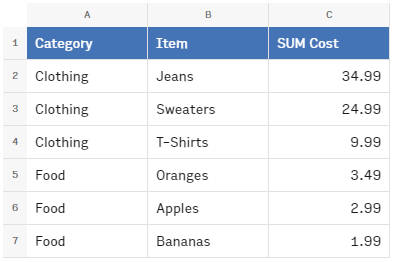
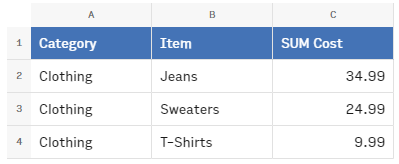
For example, if we wanted to create a table that shows the cost of each item within each category, sorted by the cost in descending order, we could use the following QUERY function:
=QUERY(A1:D7,"SELECT A, B, SUM(C) GROUP BY A, B ORDER BY sum(C) DESC")
This would produce the following table:
Limit
LIMIT is used in the QUERY function to specify the maximum number of rows that a query should return.
It can be useful when you have a large dataset and only want to display a limited number of rows in your query results. For example, you could use the LIMIT clause to display the top 10 most expensive items, the top 5 best-selling products, or the first 100 entries in a database.
For example, if we wanted to create a table that shows the cost of the most expensive three items, we could use the following QUERY function:
=QUERY(A1:D7,"SELECT A, B, SUM(C) GROUP BY A,B ORDER BY SUM(C) DESC LIMIT 3")
This would produce the following table:
Offset
OFFSET is used in the QUERY function to specify the number of rows to skip at the beginning of the table before returning the query results.
It can be useful when you want to paginate your query results or display only a portion of the data in your table. For example, you could use the OFFSET clause to display the next 10 items in a list, the previous 5 entries in a database, or the second half of a large dataset.
You can also use the LIMIT clause in combination with the OFFSET clause to specify the number of rows to return in your query results.
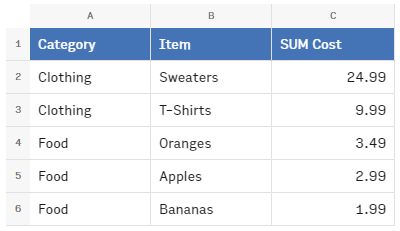
For example, if we wanted to create a table that shows the cost of the first three items within each category, starting from the second item, we could use the following QUERY function:
=QUERY(A1:D7,"SELECT A, B, SUM(C) GROUP BY A,B ORDER BY SUM(C) DESC OFFSET 1")
This would produce the following table:
Label
Label is used to rename the headers of the columns in the QUERY function. Use the following syntax to rename a colum:
1label column_id label_stringExample:
=QUERY(A1:D7,"SELECT * Label A 'Cat', B 'Type'")
This will label column A with Cat and col B with Type.
IN
The IN clause filters rows based on whether a column's value matches any value in a specified list. It’s useful for selecting data from a predefined set.
Example:
=QUERY(A1:C5, "SELECT * WHERE B IN ('Fruit', 'Vegetable')")

This will return all rows since both categories match the condition.
HAVING
The HAVING clause filters aggregated data (used with GROUP BY). It’s similar to WHERE but operates on grouped results.
Example: Using the same table, to find categories with a total Quantity greater than 25:
=QUERY(A1:C5, "SELECT B, SUM(C) GROUP BY B HAVING SUM(C) > 25")

WHERE NOT
The WHERE NOT clause excludes rows that match the given condition.
Example: To exclude rows where the Category is "Fruit":
=QUERY(A1:C5, "SELECT * WHERE NOT B = 'Fruit'")

AS
The AS clause is used to assign an alias to a column or expression in your query. This can make your output more readable or allow you to refer to calculated fields by a more descriptive name.
This clause is especially useful when you're using aggregate functions or calculations in your SELECT statement and want to label the resulting column.

Functions
In Rows, the QUERY function supports a range of aggregate functions that allow you to perform calculations on groups of data. These are typically used in combination with the GROUP BY clause, but can also appear in SELECT, ORDER BY, and HAVING clauses.
Here are the supported functions:
| Category | Function | Description |
|---|---|---|
| Aggregation | AVERAGE | Returns the average (mean) of a numeric dataset. |
| Aggregation | MAX | Returns the maximum value in a numeric dataset. |
| Aggregation | MIN | Returns the minimum value in a numeric dataset. |
| Aggregation | SUM | Returns the total sum of values in a numeric dataset. |
| Aggregation | MEDIAN | Returns the median value of a numeric dataset. |
| Aggregation | STDEV | Returns the standard deviation of a numeric dataset. |
| Aggregation | STDEVP | Returns the population standard deviation of a numeric dataset. |
| Aggregation | VAR_P | Returns the population variance of a numeric dataset. |
| Aggregation | COUNTA | Counts the number of non-empty cells in a range. |
| Aggregation | COUNTROWS | Counts the number of rows in a dataset. |
| Scalar | YEAR | Extracts the year from a given date. |
| Scalar | MONTH | Extracts the month (1–12) from a given date. |
| Scalar | DAY | Extracts the day (1–31) from a given date. |
| Scalar | HOUR | Extracts the hour (0–23) from a given time. |
| Scalar | MINUTE | Extracts the minute (0–59) from a given time. |
| Scalar | SECOND | Extracts the second (0–59) from a given time. |
| Scalar | WEEKDAY | Returns the day of the week (1–7) for a given date, where Sunday = 1. |
| Scalar | TO_DATE | Converts a text string into a date. |
| Scalar | DATEDIF | Returns the difference between two dates in a specified unit (e.g., days, months, or years). |
| Scalar | WEEKNUM | Returns the week number (1–53) for a given date, where Sunday is the start of the week. |
| Scalar | ISOWEEKNUM | Returns the ISO week number (1–53) for a given date, with Monday as the first day of the week. |
| Scalar | UPPER | Converts a text string to uppercase. |
| Scalar | LOWER | Converts a text string to lowercase. |
| Scalar | RIGHT | Extracts a specified number of characters from the right side of a string. |
| Scalar | LEFT | Extracts a specified number of characters from the left side of a string. |
| Scalar | VALUE | Converts text that looks like a number into an actual numeric value. |
| Scalar | SUBSTITUTE | Replaces occurrences of a specific substring within a text string with another substring. |
| Scalar | REGEXREPLACE | Replaces text using regular expressions to match patterns in a string. |
| Scalar | TEXT | Formats a value as text in a specified format (e.g., for dates, numbers). |
Notes:
- Function names are case-insensitive (sum() and SUM() are equivalent).
- You can use multiple functions in the same query (e.g.,
SELECT A, COUNT(B), AVG(C)). - These functions must reference valid columns containing numeric data (except COUNT(), which works on any type).
How Rows is different from Google Sheets’ QUERY() function
The third argument (headers argument) functions a little differently in both languages.
- Google
- If the argument is not specified, Google tries to identify the header row(s) automatically from the range argument, it can match one or more rows;
- If the argument is specified then it will respect the nr of header rows;
- Rows
- If the argument is not specified, no header rows are identified; Same as if the argument value=0;
- If the argument is specified then it will respect the number of header rows; There is an exception to this rule in Rows which is when you use the pivot clause. This clause will automatically produce headers based on the columns it specifies.
Current limitations and planned improvements
- Scalar Functions
- Select time(B), date(B), upper(A), lower(A)
- Arithmetic Operators
- Select 2 * A, -1 + B, sum(C) / 2
- Update/Set/Insert/Delete
- Set A=2, B=C, D='updated' Where F>2
- Clause Options
- Where A='Some Text' Options CASE_INSENSITIVE
- Improve date/time handling
- Select Where A='2022-10-02' Select Where date(A)='2022-10-02' Select * Where A=date('2022-10-02' )
Common mistakes to avoid with QUERY()
Here are some common mistakes that people make when using the QUERY function in Rows:
- Forgetting to enclose the query in quotes: The query parameter of the QUERY function must be enclosed in quotation marks, otherwise it will not be recognized as a string and will produce an error.
- Using the wrong column or cell references: It is important to use the correct column and cell references in your query, otherwise you may get incorrect or unexpected results.
- Using the wrong syntax: SQL has a specific syntax that must be followed in order for the query to be valid. If you make a mistake with the syntax, your query will not work as expected.