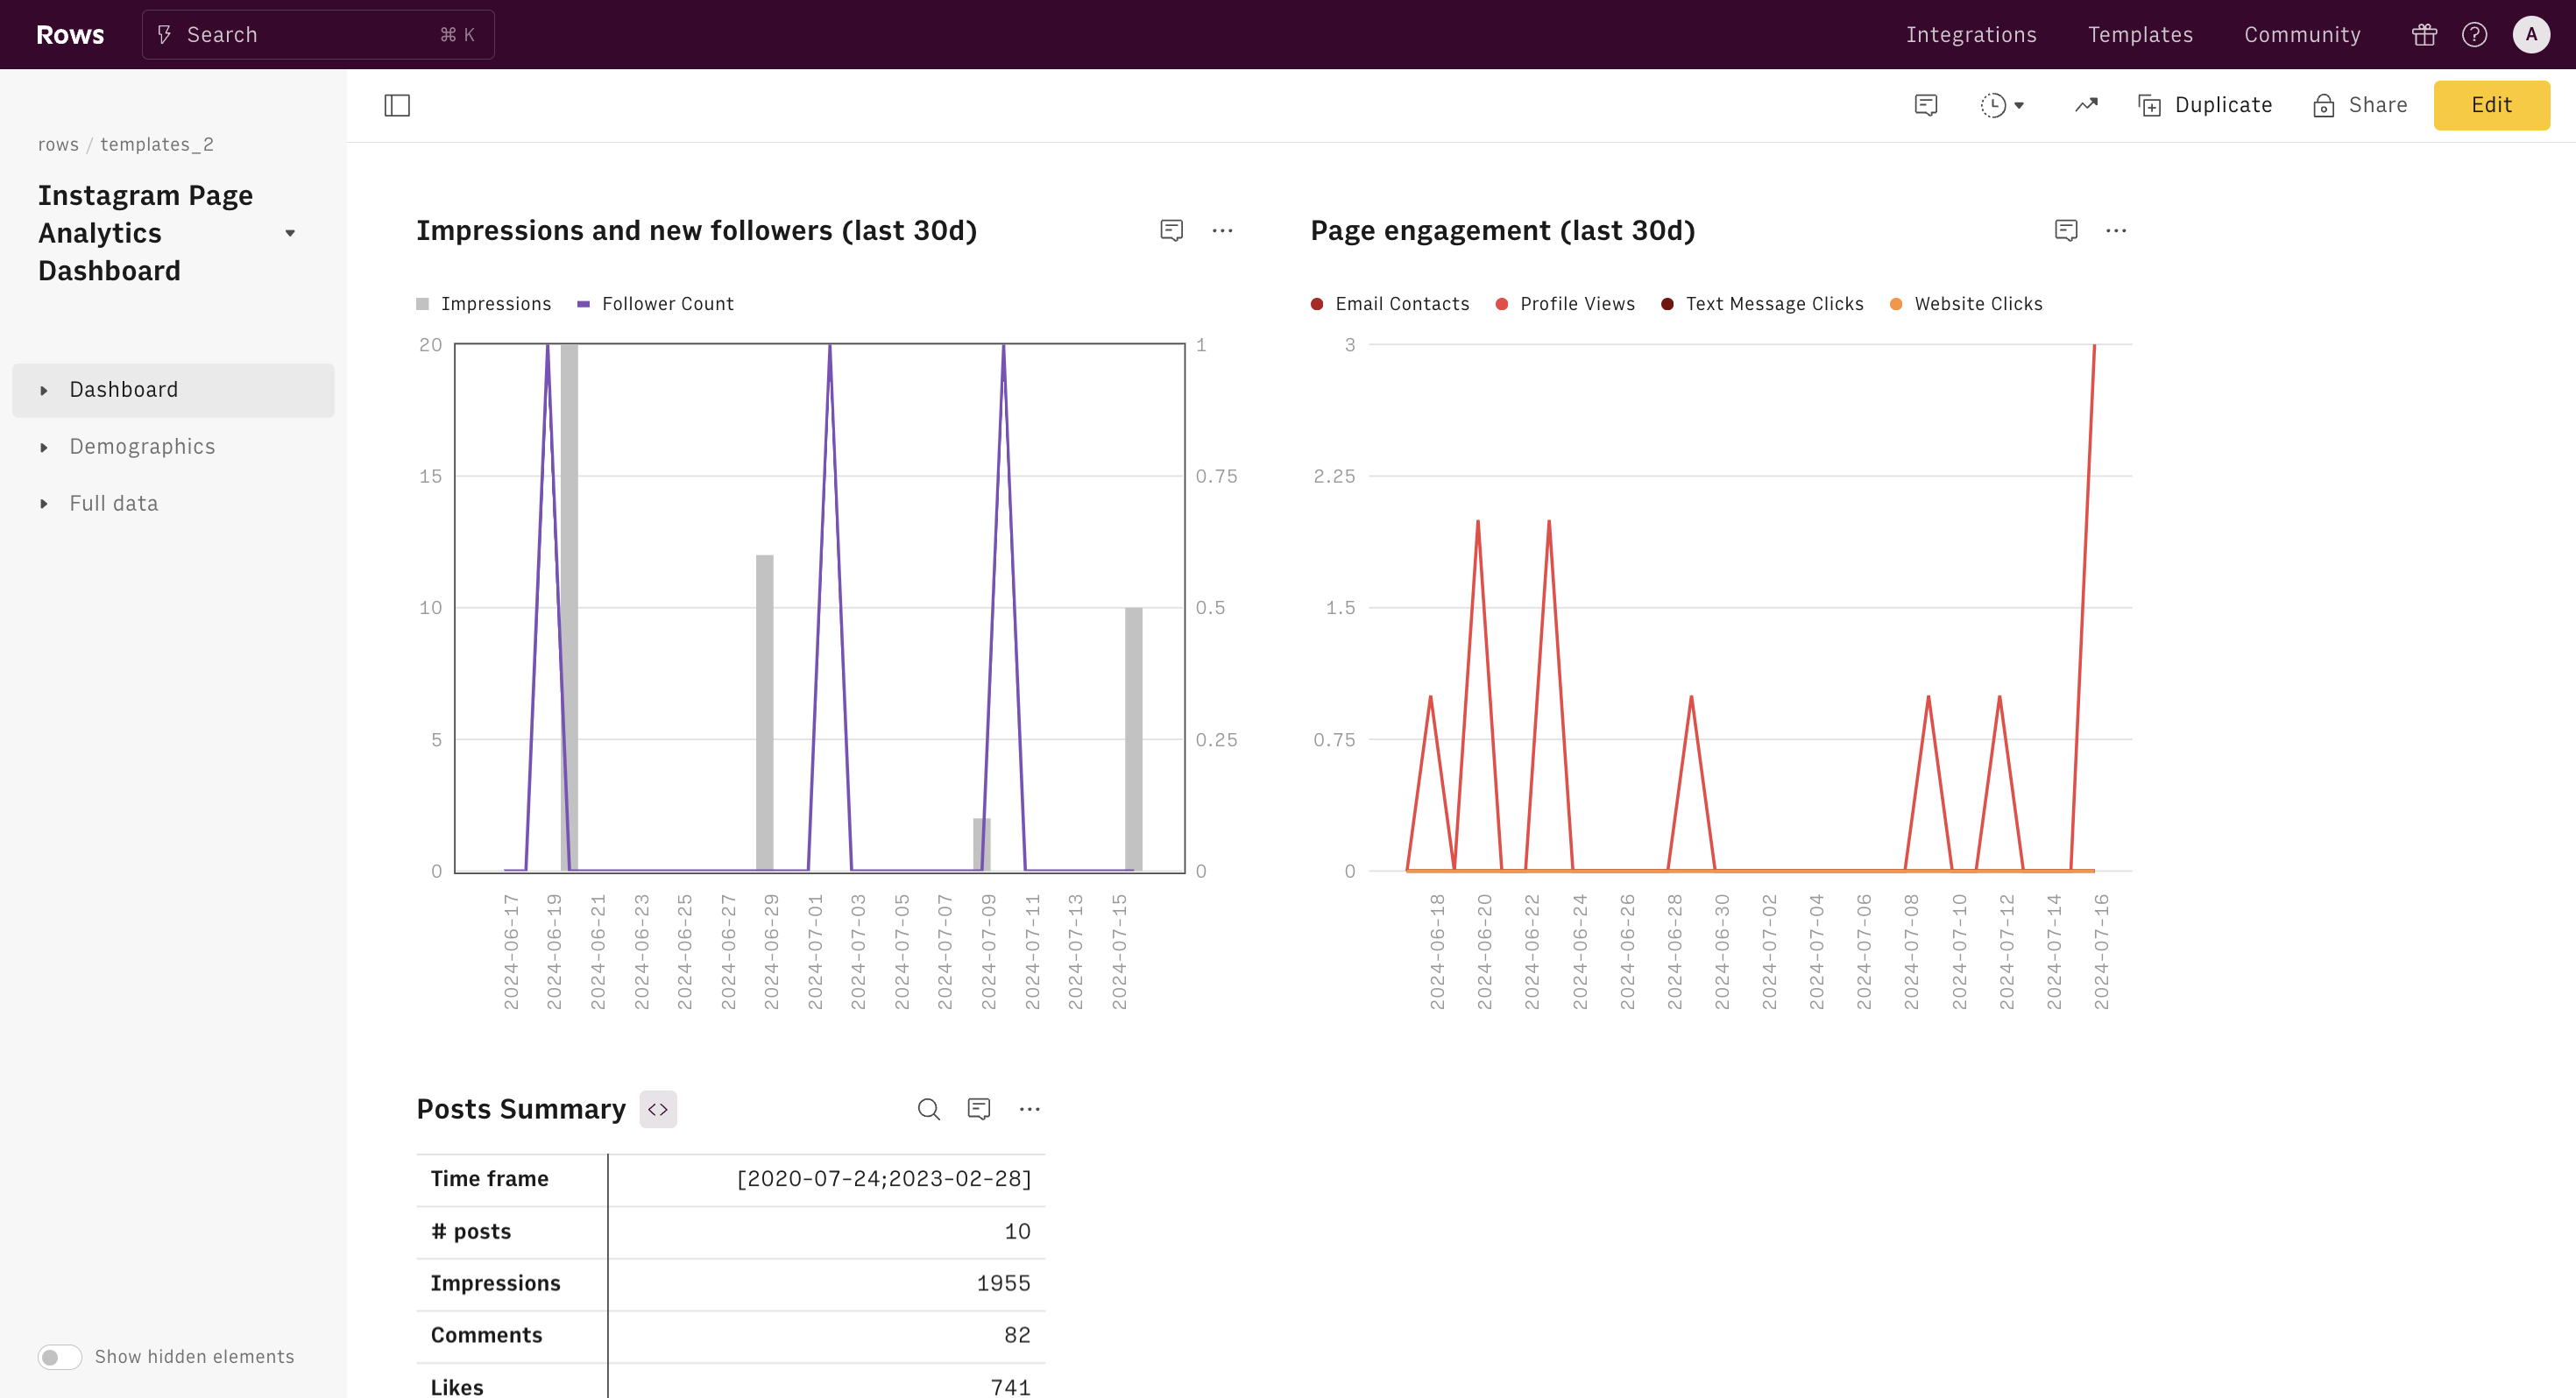
About YouTube Analytics Dashboard
What is a YouTube Analytics Dashboard
Welcome to the YouTube Analytics Dashboard, your all-in-one solution for comprehensive insights into your YouTube channel’s performance. This powerful tool provides you with a detailed overview of your YouTube stats, including views, total videos, and location. Designed to help you monitor and enhance your YouTube strategy, our dashboard covers every critical aspect of your channel analytics.
Key YouTube Channel Analytics Components
This Analytics Dashboard pull Youtube Data directly from your channel and let you automate analysis and track its performance over time.
Here are the main components:
- Channel General Stats: Overview of your total views, number of videos, and geographical reach.
- Last 30 Days Summary: Detailed metrics on views, estimated minutes watched, subscribers gained and lost, likes, dislikes, comments, and shares.
- Views and Engagement by Week: Weekly breakdown of your views and engagement metrics.
- Net New Subscribers Trend: Track YouTube subscriber growth over time.
- Top 10 Most Liked Videos: See which videos are resonating most with your audience.
- Top 10 Most Viewed Videos: Identify your most popular content.
- Demographics Breakdown: Insights into your viewers by age, top 10 countries by views, view source, and playback location.
How to Use This YouTube Analytics Dashboard
Getting started with the YouTube Analytics Dashboard is simple. Just follow the instructions in the panel, connect your YouTube account to Rows, and the data will automatically get fetched.
This seamless integration allows you to leverage the flexibility of a spreadsheet to analyze your metrics without worrying about data collection and import.
The Importance of Monitoring YouTube Metrics
Understanding and monitoring key metrics is essential for the growth and success of any YouTube channel. By using our dashboard, you can:
- Track your channel’s performance in real-time with YouTube real time views and YouTube realtime views.
- Identify trends and patterns in your audience’s behavior using YouTube analytics views and YouTube viewer analytics.
- Optimize your content strategy based on actionable insights from YouTube analytics for other channels.
- Monitor engagement and adapt your strategies to increase viewer retention using analytics yt.
Practical Use Cases and Target Personas
Our YouTube Analytics Dashboard is perfect for a variety of users, including:
- Content Creators: Optimize video performance and grow your subscriber base using YouTube subscriber analytics and YouTube subscribers stats.
- Marketing Professionals: Analyze campaign effectiveness and audience engagement with YouTube tracking and YouTube video analytics.
- Social Media Managers: Track performance across different platforms and adjust strategies with YouTube data tools and YouTube metrics.
- Businesses: Monitor brand reach and engagement on YouTube using YouTube performance and YouTube traffic sources.
Enhancing Your YouTube Strategy with Key Insights
By using our YouTube Analytics Dashboard, you can get critical insights about your channel overall performance, tracking your subscriber growth over time with the YouTube subscriber graph, understanding your audience demographics to tailor your content with YouTube demographic data, and diving deep into the performance of individual videos with YouTube video information.
Our YouTube Analytics Dashboard helps you make sense of vast amounts of data, from understanding what unique viewers mean on YouTube to checking YouTube channel compare stats. Whether you are tracking YouTube subscribers or analyzing YouTube impressions, our tool makes analytics easy. It's the perfect solution for anyone looking to analyze YouTube channels, whether you are a beginner or an advanced user.
How it works
How it works
Get started
Click on 'Use template' and start using it right away. No forms, no signup. Your data first.
Connect your YouTube account
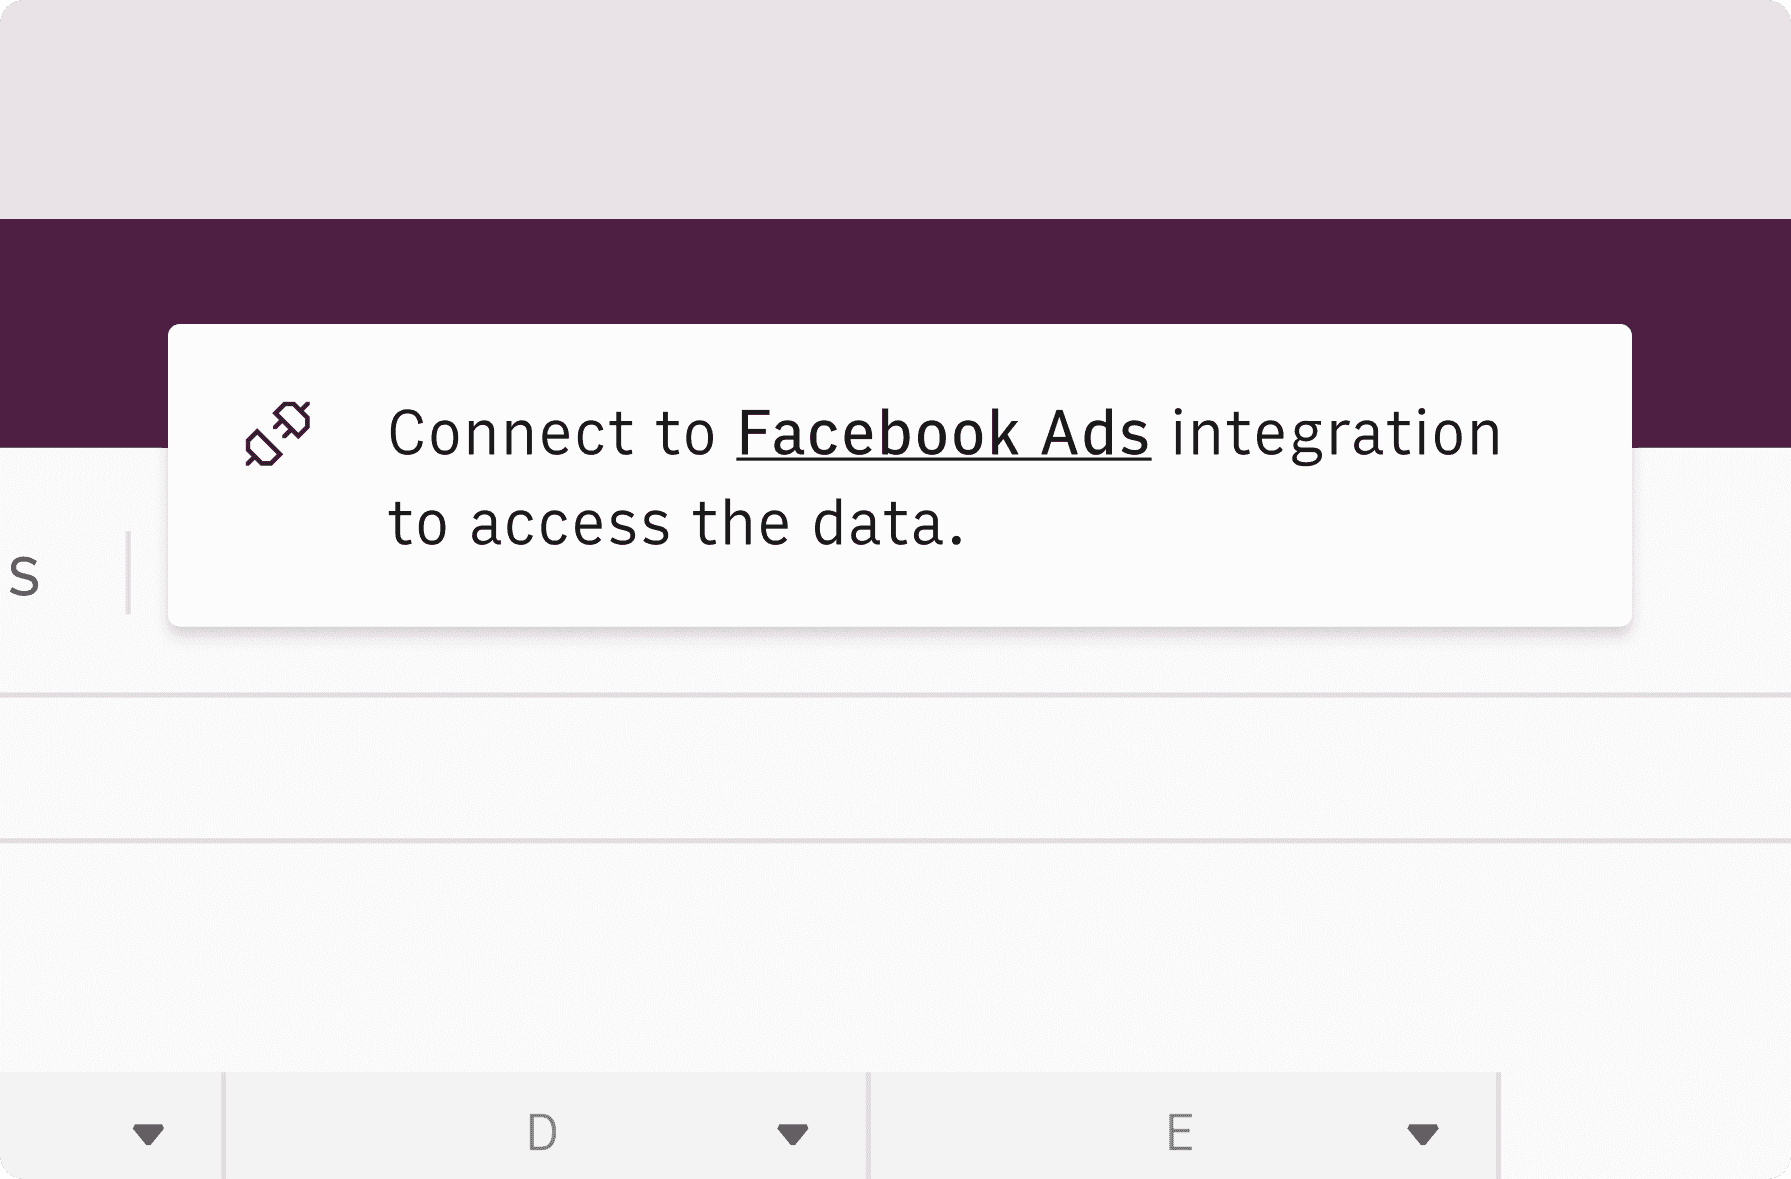
Once landed on the spreadsheet, follow the instructions to connect the required integration and pick your account.
Customize the template and schedule refresh
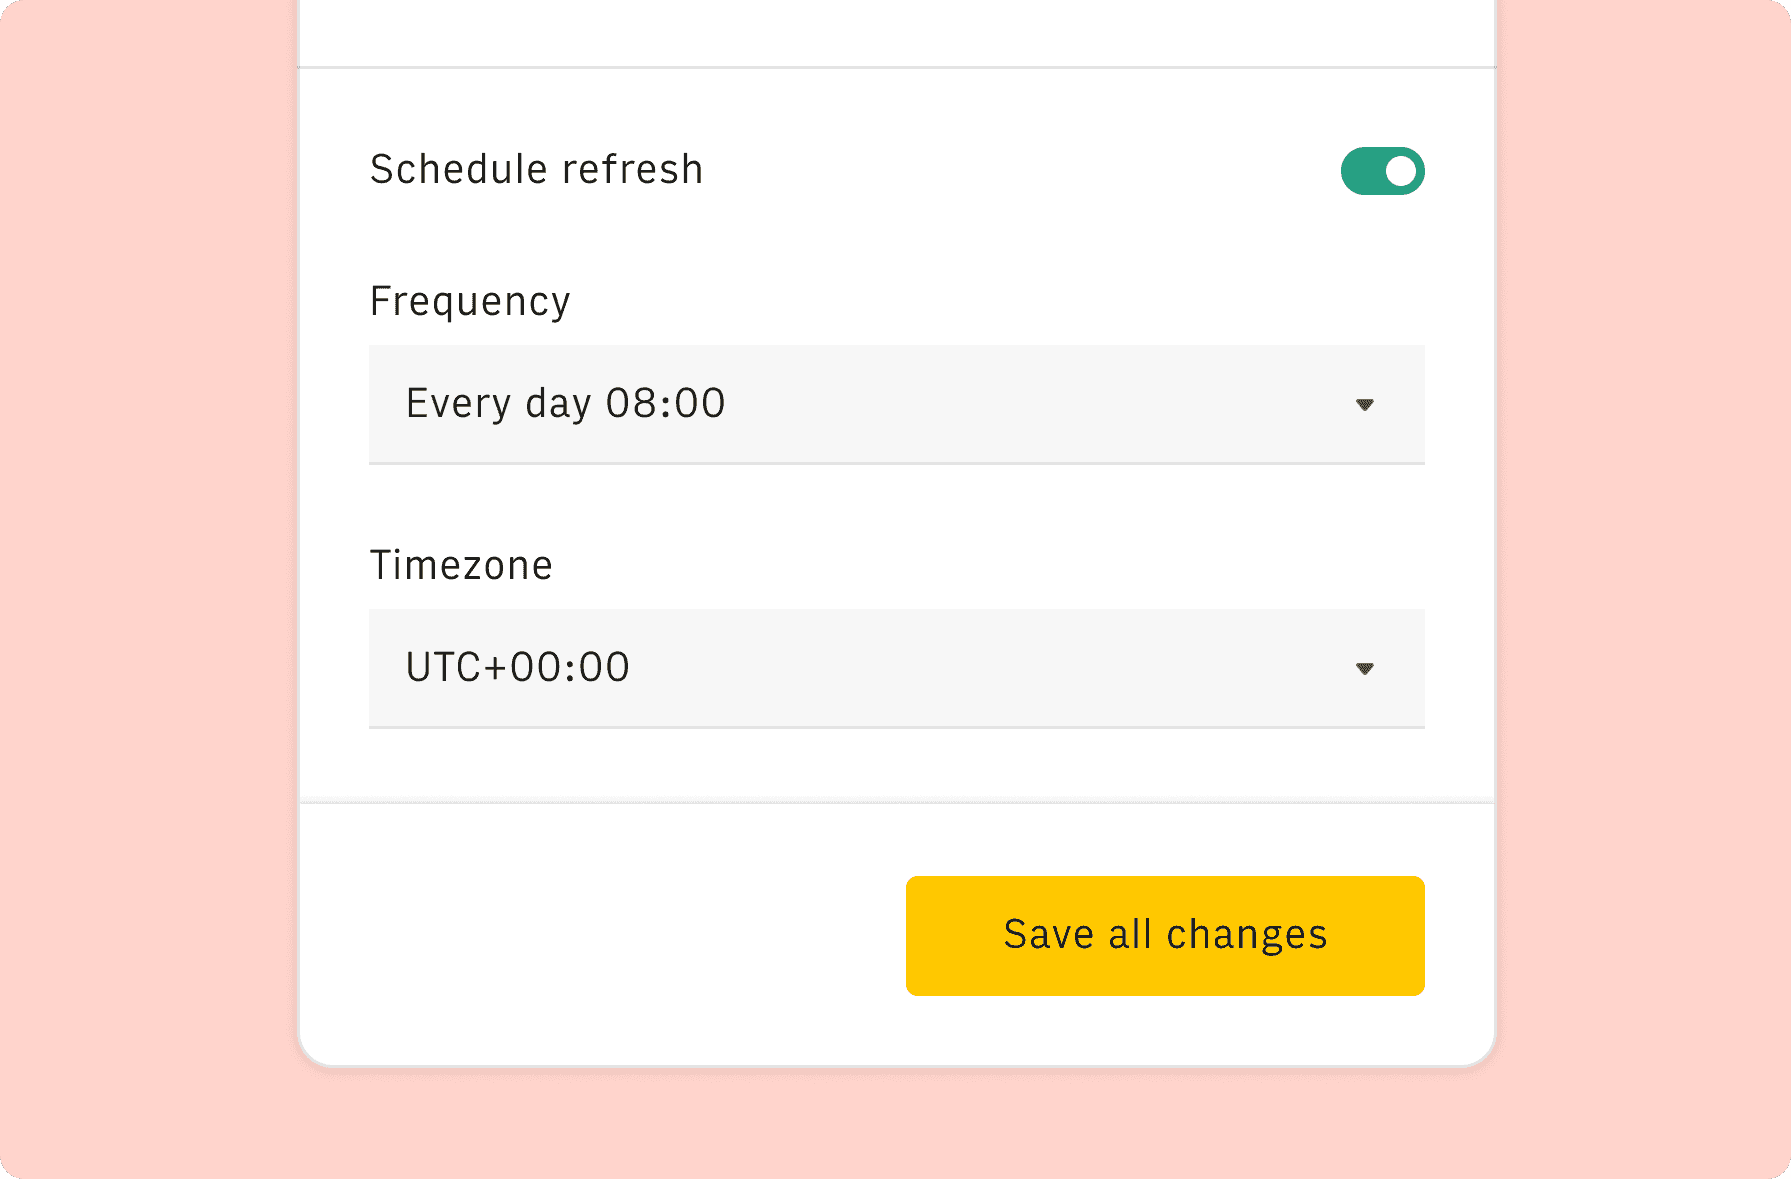
Once the integration has been connected, all tables will update automatically with your own data. Click on 'Edit Source' to change the retrieved data and automate the data refresh. You can then insert a chart or a pivot table, add a column or personalize formats, using all the regular functions and shortcuts that make spreadsheets great.
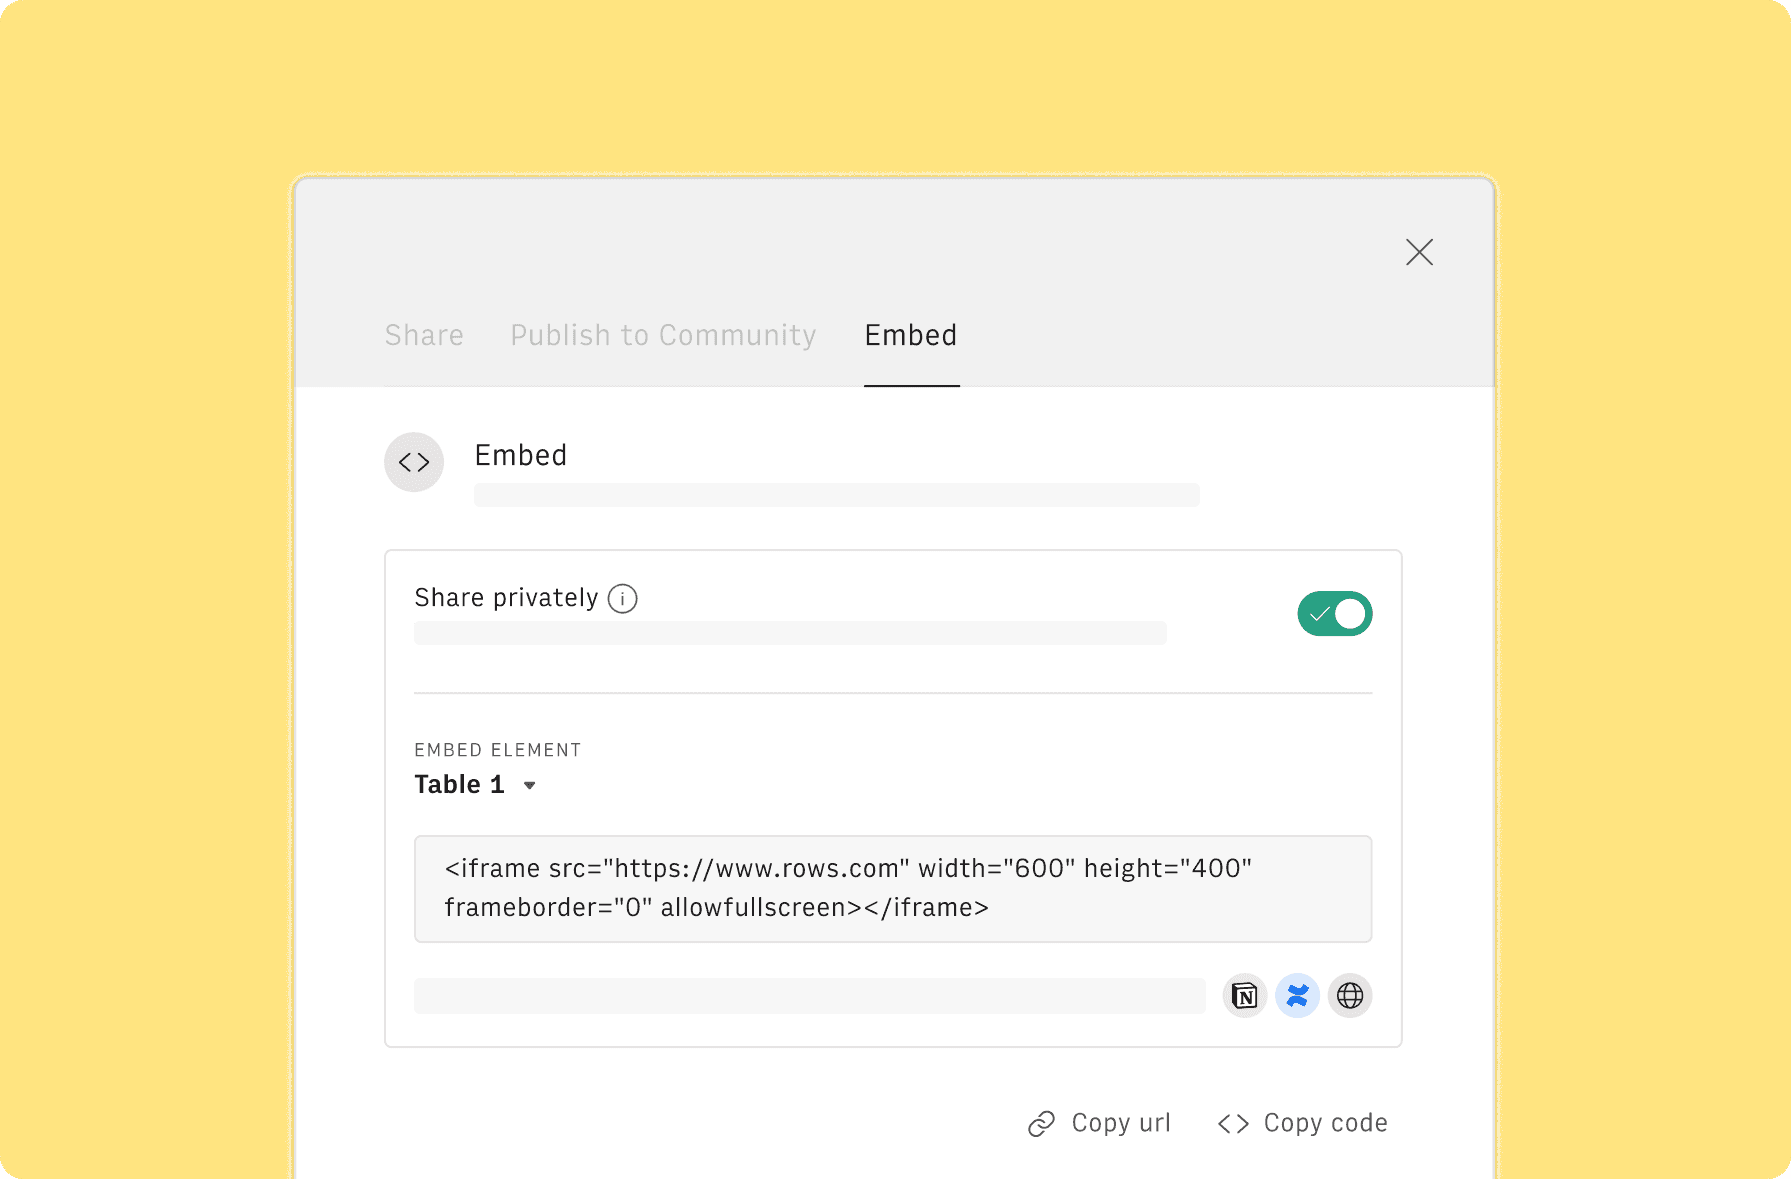
Embed tables and charts
Click on the option menu to embed tables and chart on your Notion, Confluence or any other iframe-ready documents.
Questions and answers
Can I use Rows for free?
More than a YouTube Analytics Dashboard
Rows is your new AI Data Analyst. It lets you extract from PDFs, import your business data, and analyze it using plain language.
Signup for free
Import your business data
Extract from PDFs and images, import from files, marketing tools, databases, APIs, and other 3rd-party connectors.
Know moreAnalyze it with AI
Ask AI✨ any question about your dataset - from VLOOKUPs to forecasting models - and surface key insights, trends, and patterns.
Know moreCollaborate and Share
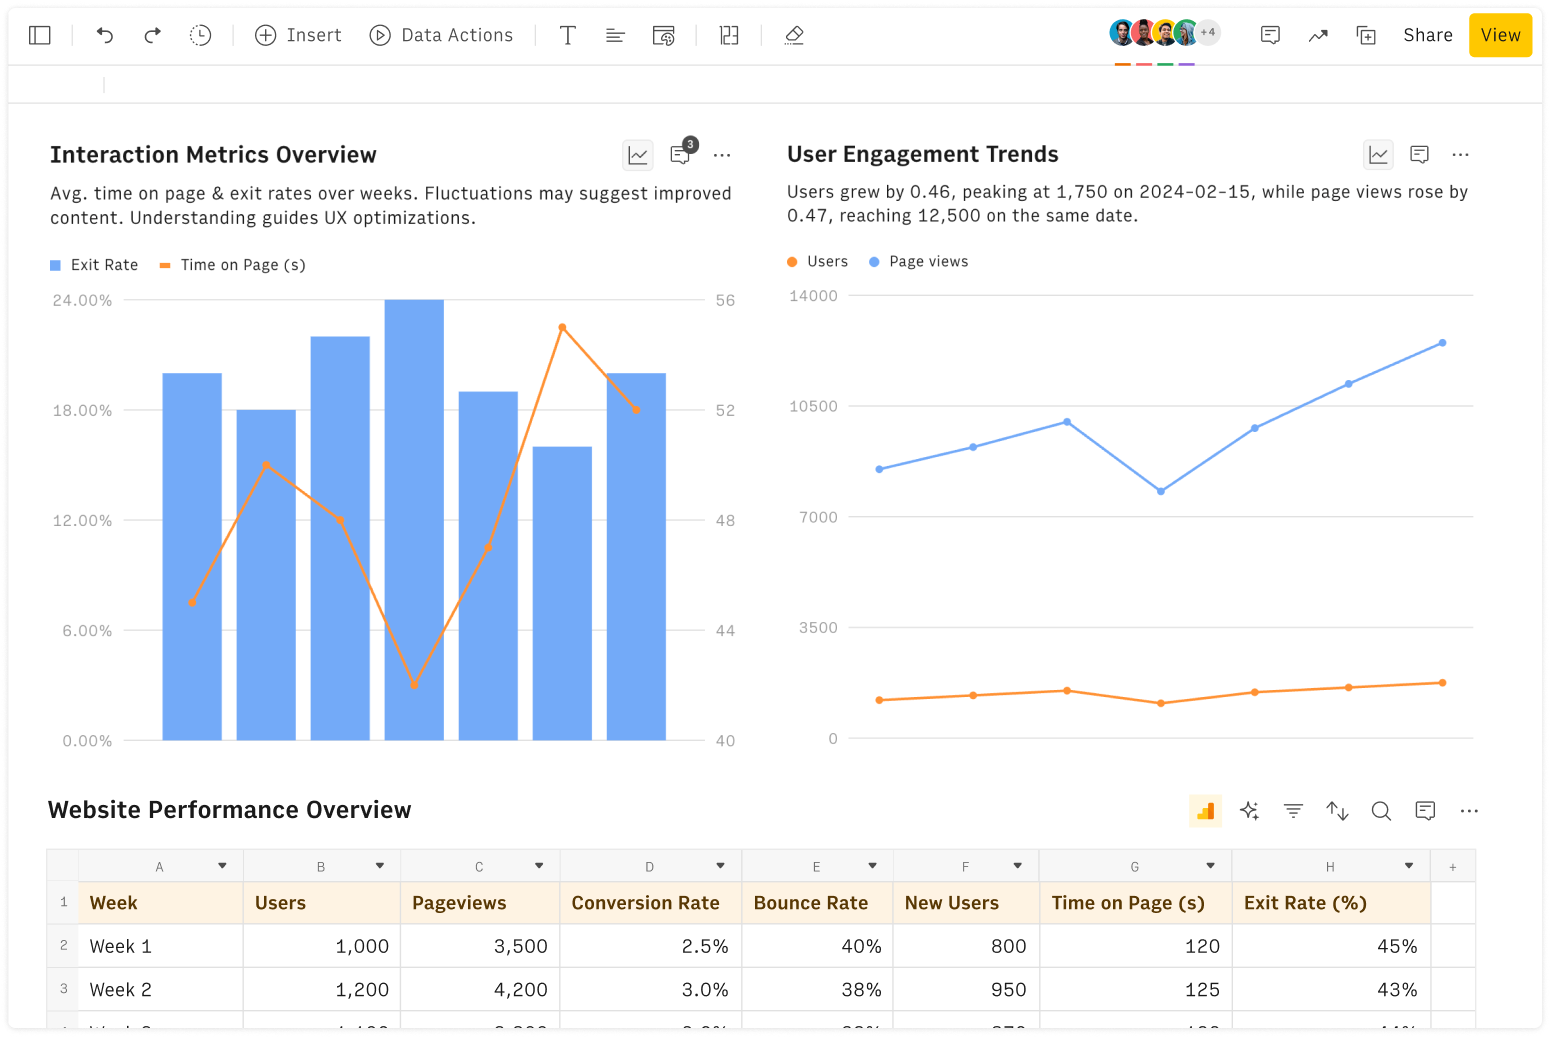
Seamlessly collaborate and share stunning reports with dynamic charts, embed options, and easy export features.
Know more


