
TikTok Analytics Dashboard
Get a summary of your TikTok page analytics, including the main KPIs of your videos.
 100% spreadsheet
 Connected to your data
 Daily+ refresh
 Embed everywhere
About TikTok Analytics Dashboard
Introduction to the TikTok Analytics Dashboard
Welcome to the ultimate TikTok Analytics Dashboard, your go-to tool for monitoring and analyzing your TikTok performance. This comprehensive dashboard offers a detailed overview of key metrics such as TikTok viewer counts, follower counts, likes, and video counts.
Gain insights into your weekly engagement trends, view the most liked and shared videos, and track cumulative engagement metrics to stay ahead in the TikTok game.
TikTok Analytics Components
Our TikTok Analytics Dashboard includes:
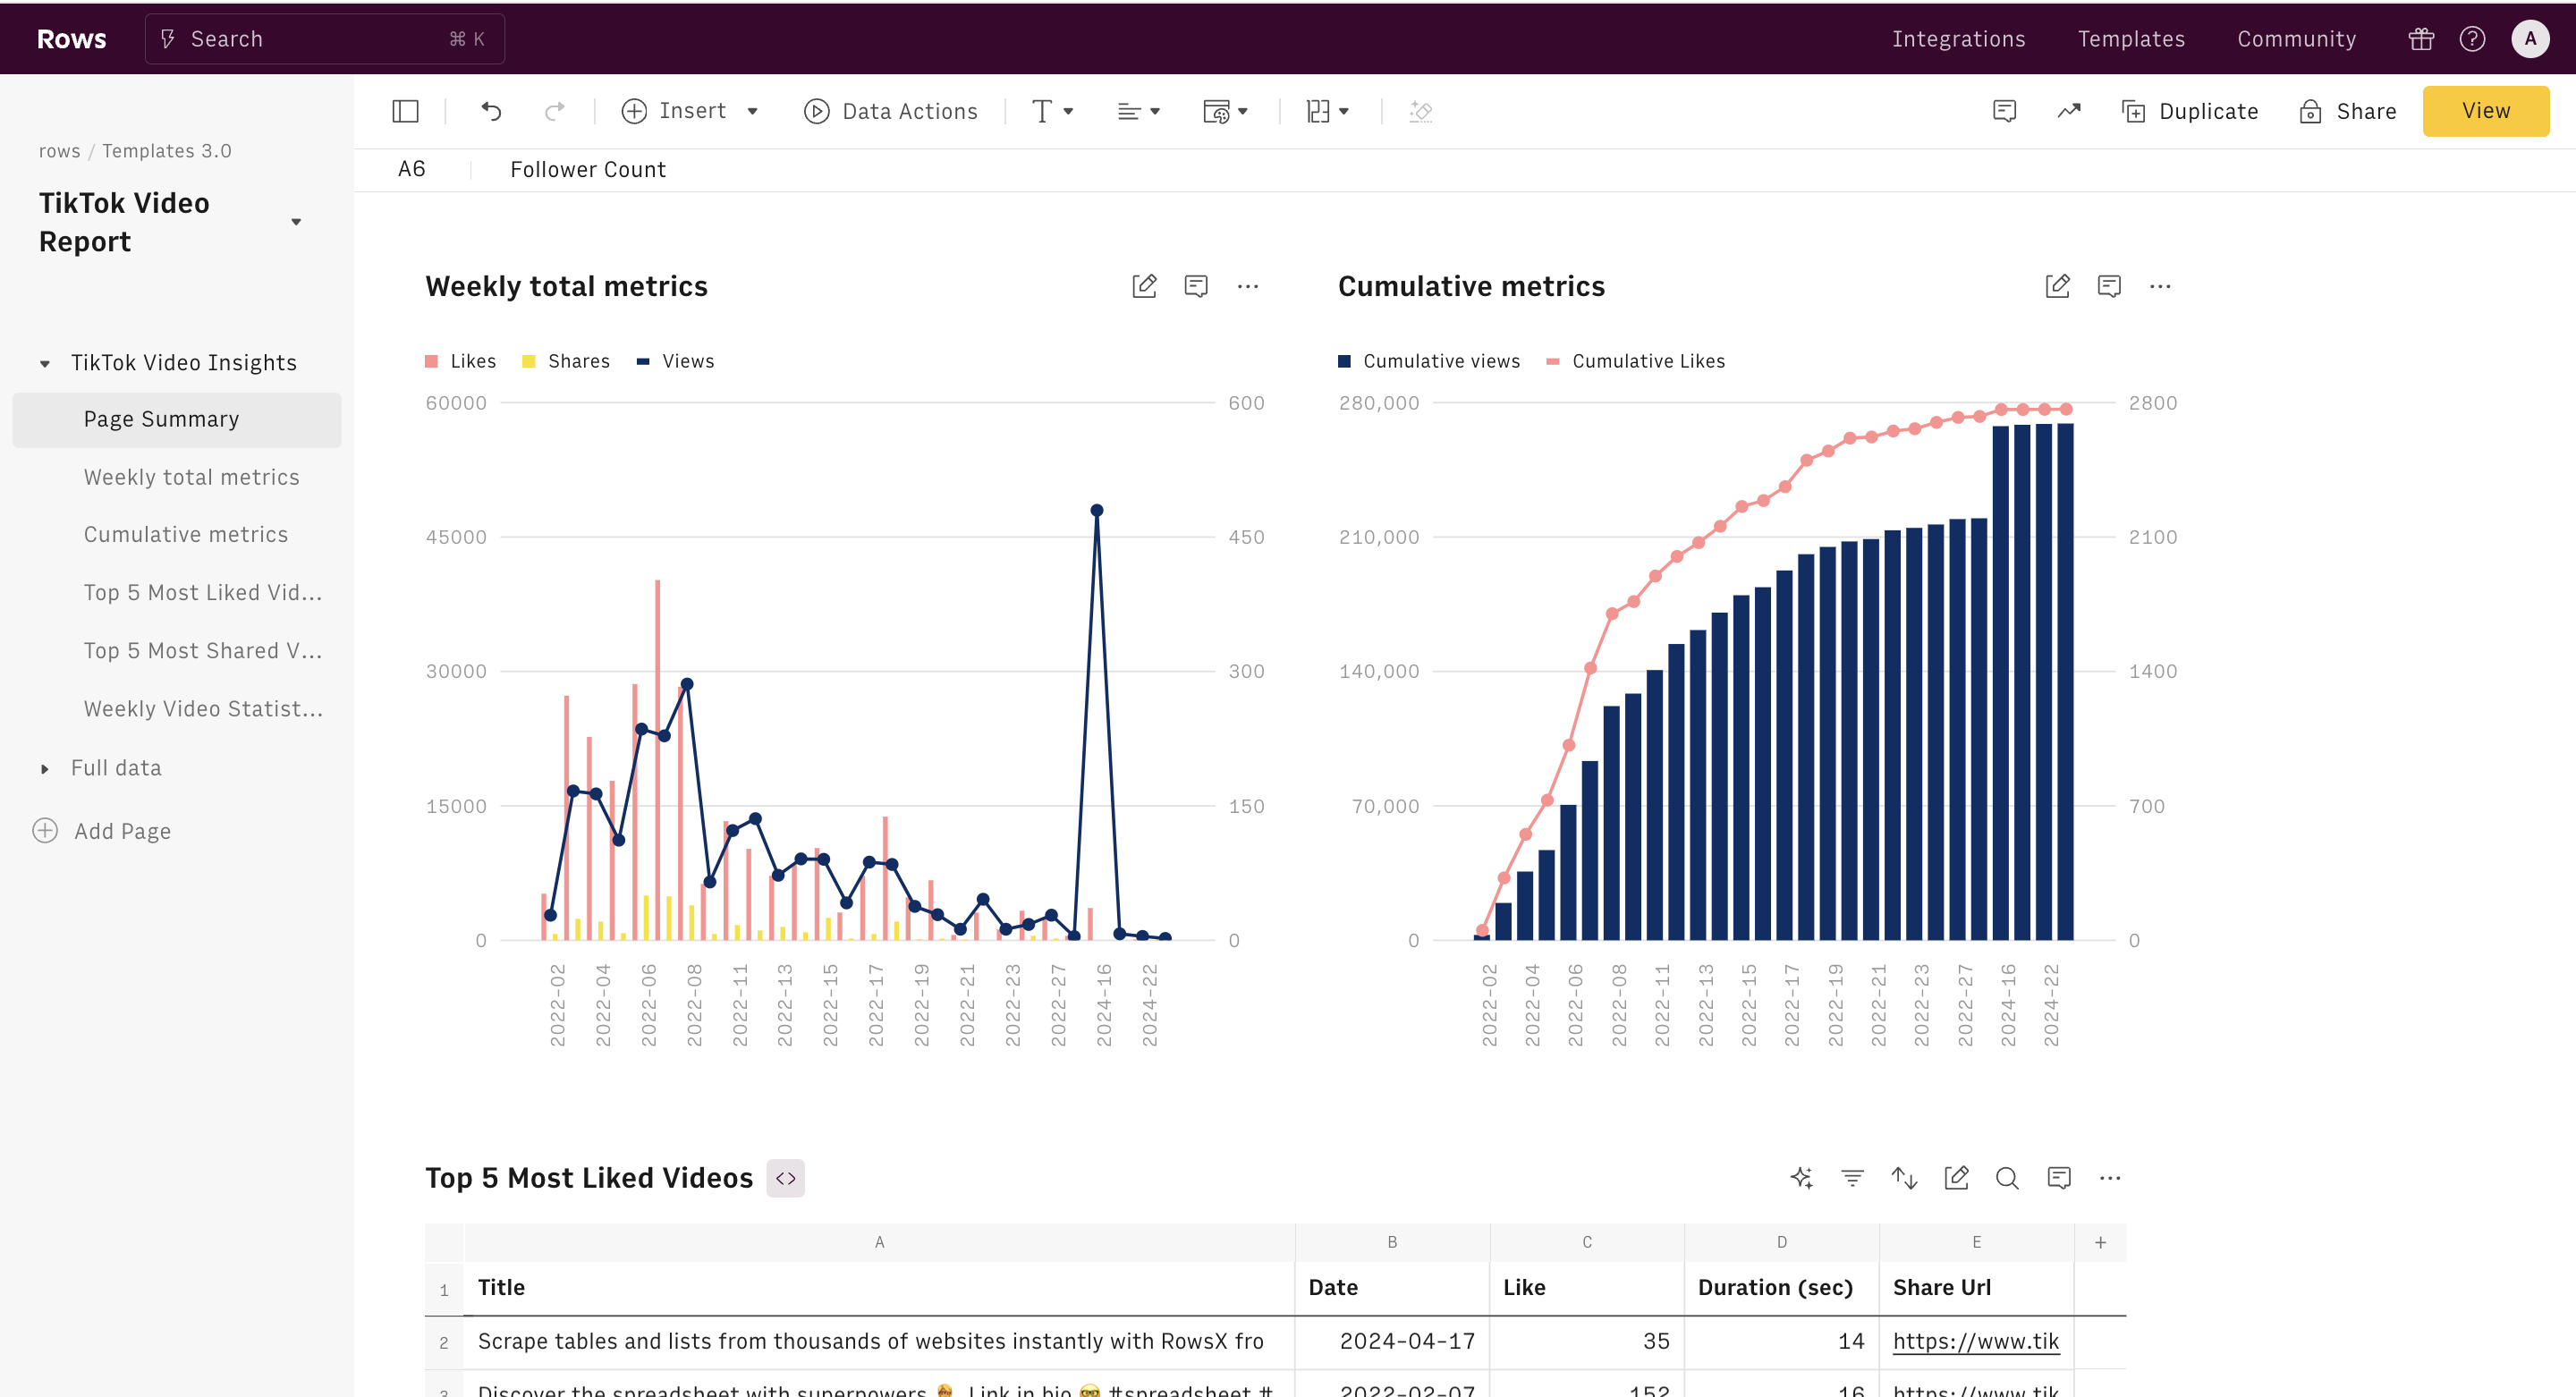
- Page Summary: Displays crucial metrics like follower count, following count, likes count, and video count, giving you a snapshot of your TikTok presence.
- Weekly Trend of Engagement Metrics: Monitor likes, views, and shares over time to identify trends and patterns in your audience's behavior.
- Weekly Cumulative Engagement Metrics: Track the cumulative performance of your content to see how engagement builds over time.
- Top Shared Videos: Discover which videos are getting the most shares, helping you understand what resonates with your audience.
- Top Liked Videos: Identify your most popular content by likes, allowing you to replicate successful strategies.
How to Use this TikTok Analytics Tool
Getting started with our TikTok Analytics Dashboard is simple:
- Connect Your TikTok Account: Follow the instructions in the panel to link your TikTok account.
- Automatic Data Fetching: Once connected, your data will be automatically fetched and updated in the dashboard.
- Analyze and Act: Use the insights provided to refine your content strategy, engage with your audience, and grow your TikTok presence.
Why monitoring your TikTok performance
Monitoring key metrics with this TikTok Analytics Dashboard is crucial for several reasons:
- Understand Your Audience: Gain insights into your TikTok audience demographics and behavior, helping you tailor content to their preferences.
- Track Performance: With tools like the TikTok follower live count and video analytics, you can track your performance in real-time.
- Optimize Content: Use data from the TikTok analytics viewer and engagement metrics to optimize your content strategy.
- Measure Success: Assess the effectiveness of your TikTok campaigns and content with robust analytics tools.
Practical Use Cases and Personas
This dashboard is perfect for content creators, social media managers, marketers, brands, and influencers.
Content creators can monitor their TikTok metrics and improve their content based on data-driven insights.Social media managers will find the TikTok analytics tracker invaluable for managing and growing multiple TikTok accounts effectively.
Marketers can leverage TikTok advertising metrics to optimize ad campaigns and maximize ROI, while brands can gain a deep understanding of TikTok audience insights to tailor their brand’s presence on the platform.
Influencers can track engagement and follower growth to enhance their influence and attract collaborations.
Benefits of Using Our TikTok Analytics Dashboard
By using our TikTok Analytics Dashboard, you can effectively track your TikToks with real-time updates and detailed metrics. It helps boost engagement by identifying the content that drives interaction and replicating its success.
Monitor follower growth and optimize your strategy to attract more followers, ensuring you stay ahead of trends with the TikTok trend tracker.
The dashboard provides a comprehensive analysis of your TikTok performance, from follower statistics to video views count, empowering you to make data-driven decisions and transform your TikTok strategy. Embrace the power of analytics and take your TikTok game to the next level with actionable insights from our dashboard.
How it works


How it works
Get started
Click on 'Use template' and start using it right away. No forms, no signup. Your data first.
Connect your TikTok account
Once landed on the spreadsheet, follow the instructions to connect the required integration and pick your account.
Customize the template and schedule refresh
Once the integration has been connected, all tables will update automatically with your own data. Click on 'Edit Source' to change the retrieved data and automate the data refresh. You can then insert a chart or a pivot table, add a column or personalize formats, using all the regular functions and shortcuts that make spreadsheets great.
Embed tables and charts
Click on the option menu to embed tables and chart on your Notion, Confluence or any other iframe-ready documents.


Questions and answers
Can I use Rows for free?
More than a TikTok Analytics Dashboard
Rows is your new AI Data Analyst. It lets you extract from PDFs, import your business data, and analyze it using plain language.
Signup for free

Import your business data
Extract from PDFs and images, import from files, marketing tools, databases, APIs, and other 3rd-party connectors.
Know moreAnalyze it with AI
Ask AI✨ any question about your dataset - from VLOOKUPs to forecasting models - and surface key insights, trends, and patterns.
Know moreCollaborate and Share
Seamlessly collaborate and share stunning reports with dynamic charts, embed options, and easy export features.
Know more