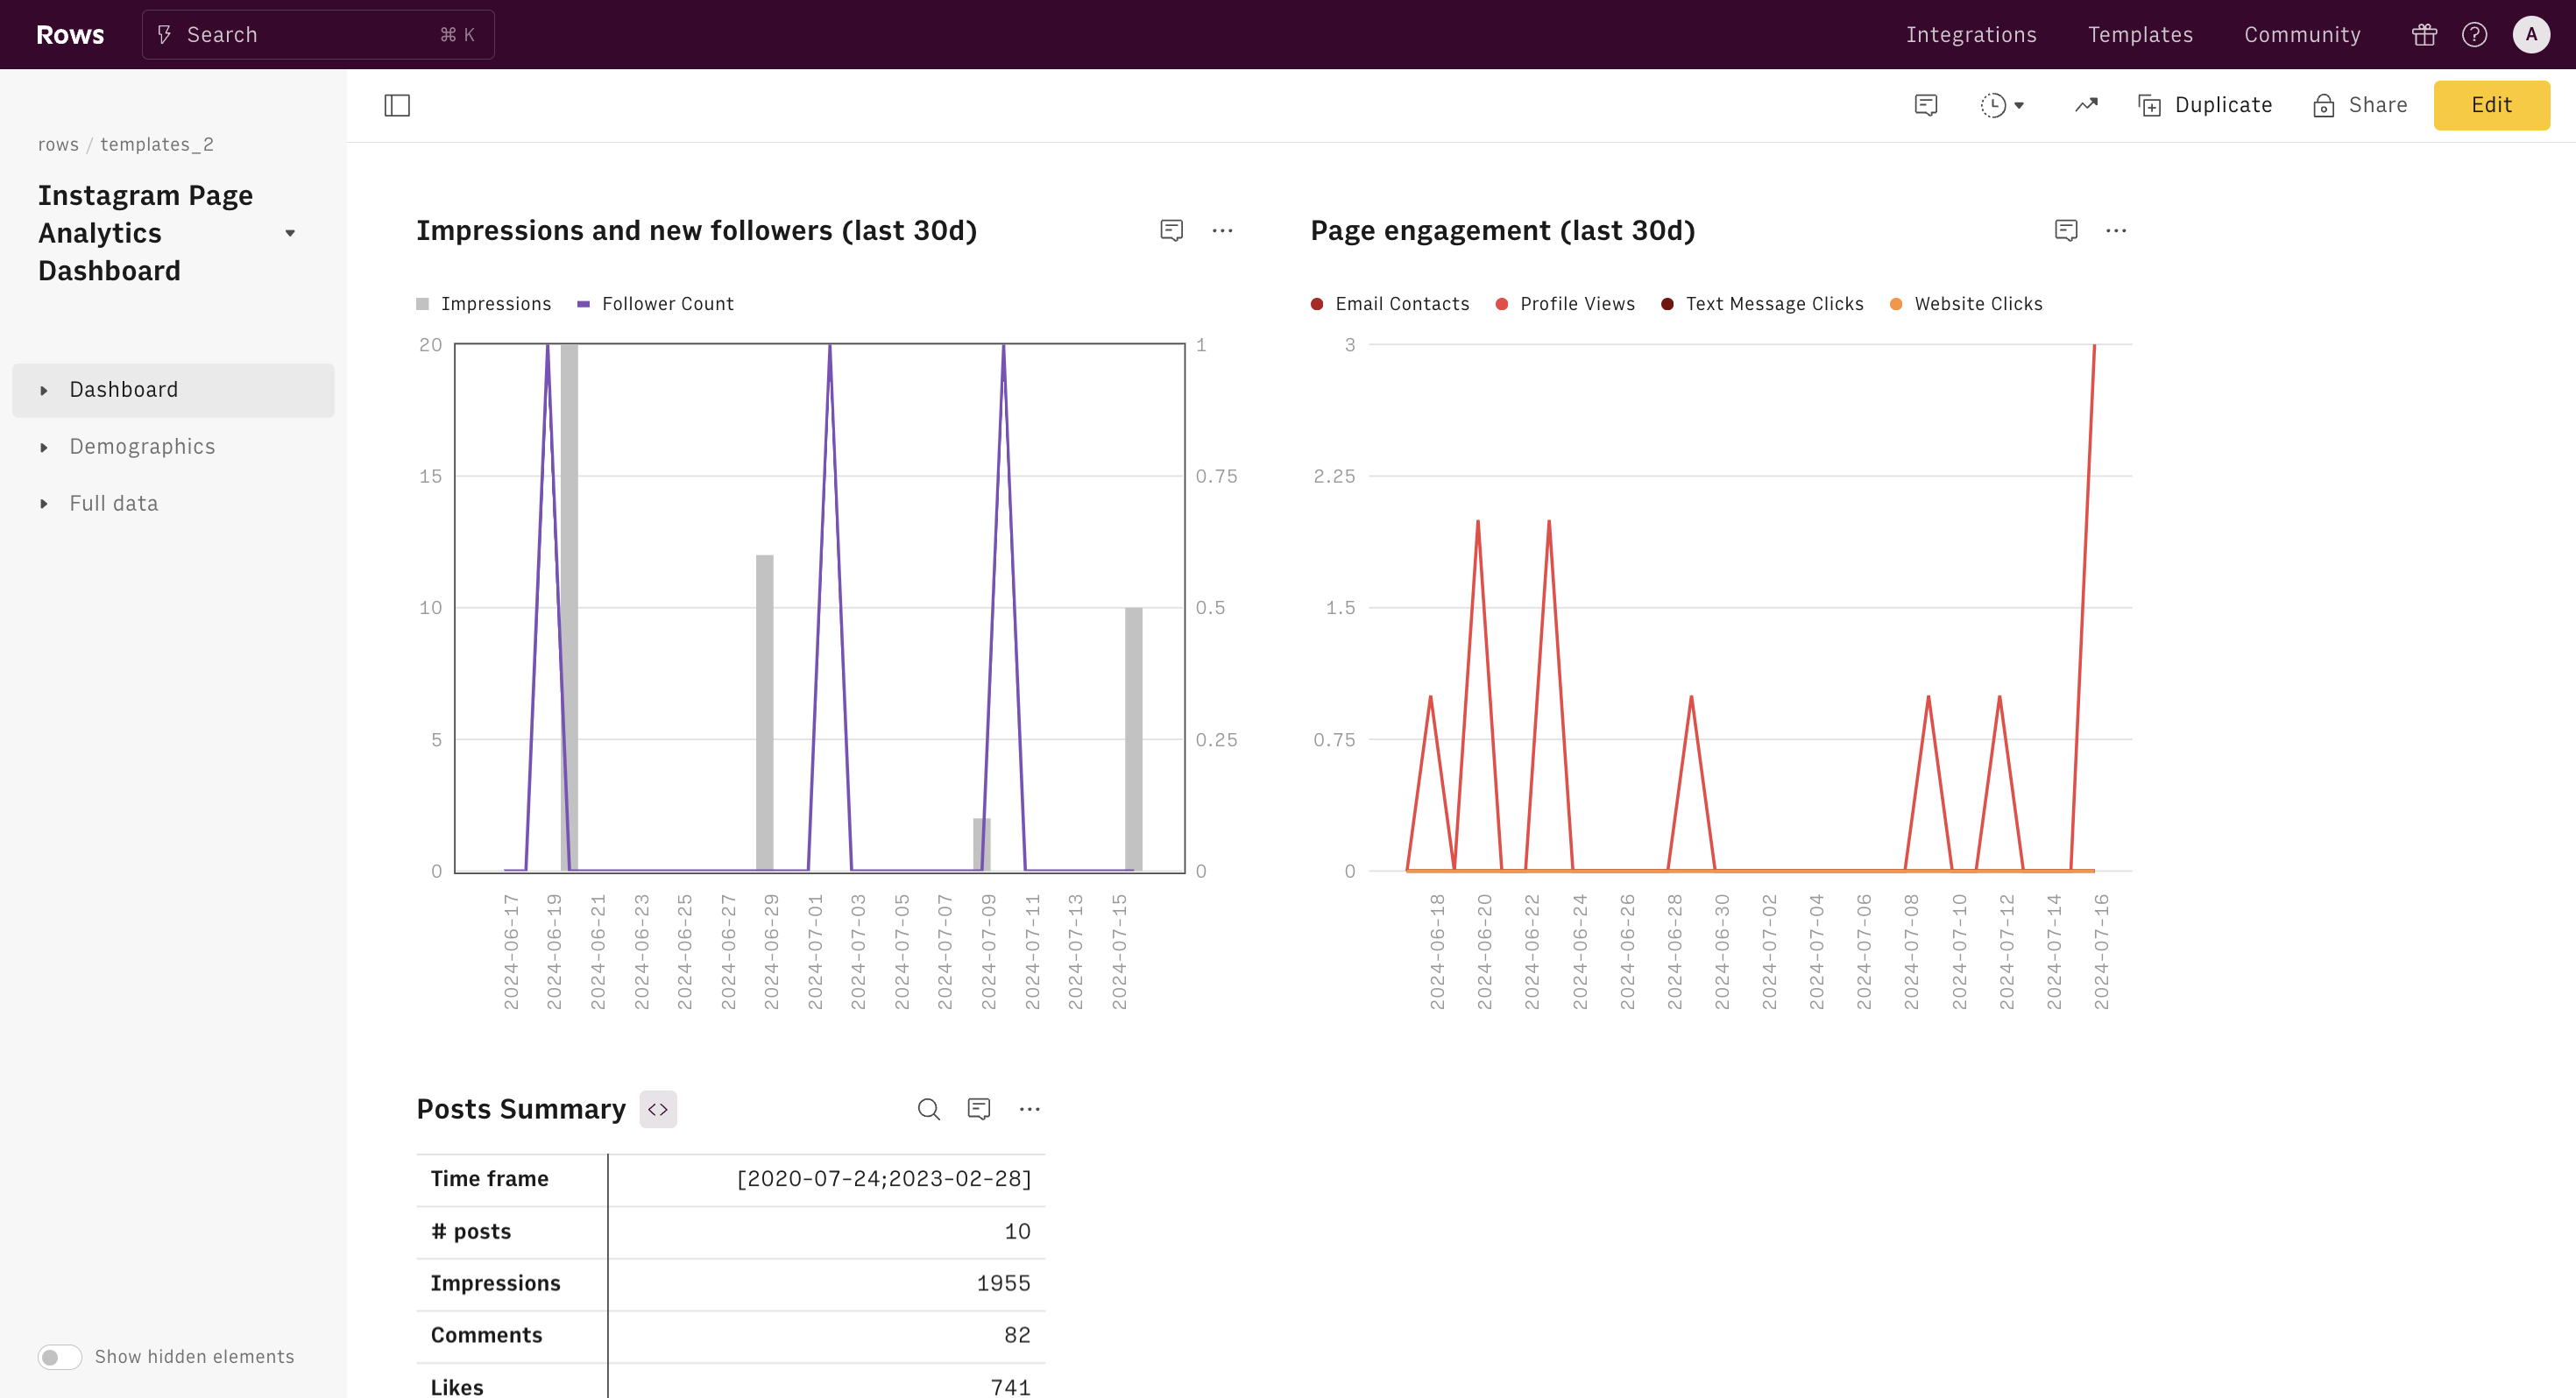
About Google Ads Keywords Report
What Is Google Ads Keywords Report
The Google Ads Keywords Report is a powerful tool designed to help marketers and advertisers gain deep insights into their keyword performance within Google Ads campaigns. This report provides a comprehensive overview of how individual keywords are performing, allowing you to make data-driven decisions to optimize your advertising efforts.
Importance and Benefits
Understanding your keyword performance is crucial for maximizing the effectiveness of your Google Ads campaigns. This report helps you identify which keywords are driving traffic, conversions, and ROI, enabling you to allocate your budget more efficiently and improve your overall ad performance.
Key Features of the template
Our Google Ads Keywords Report tracker offers a range of powerful features to help you analyze and optimize your keyword performance:
- Real-time data import from your Google Ads account
- Customizable date range selection for flexible analysis
- Comprehensive metrics including impressions, clicks, CTR, cost, conversions, and more
- Ability to filter and sort data based on various parameters
- Option to save and export reports for further analysis or presentation
How to Set Up the Google Ads Keywords Report
Step 1: Access the Template
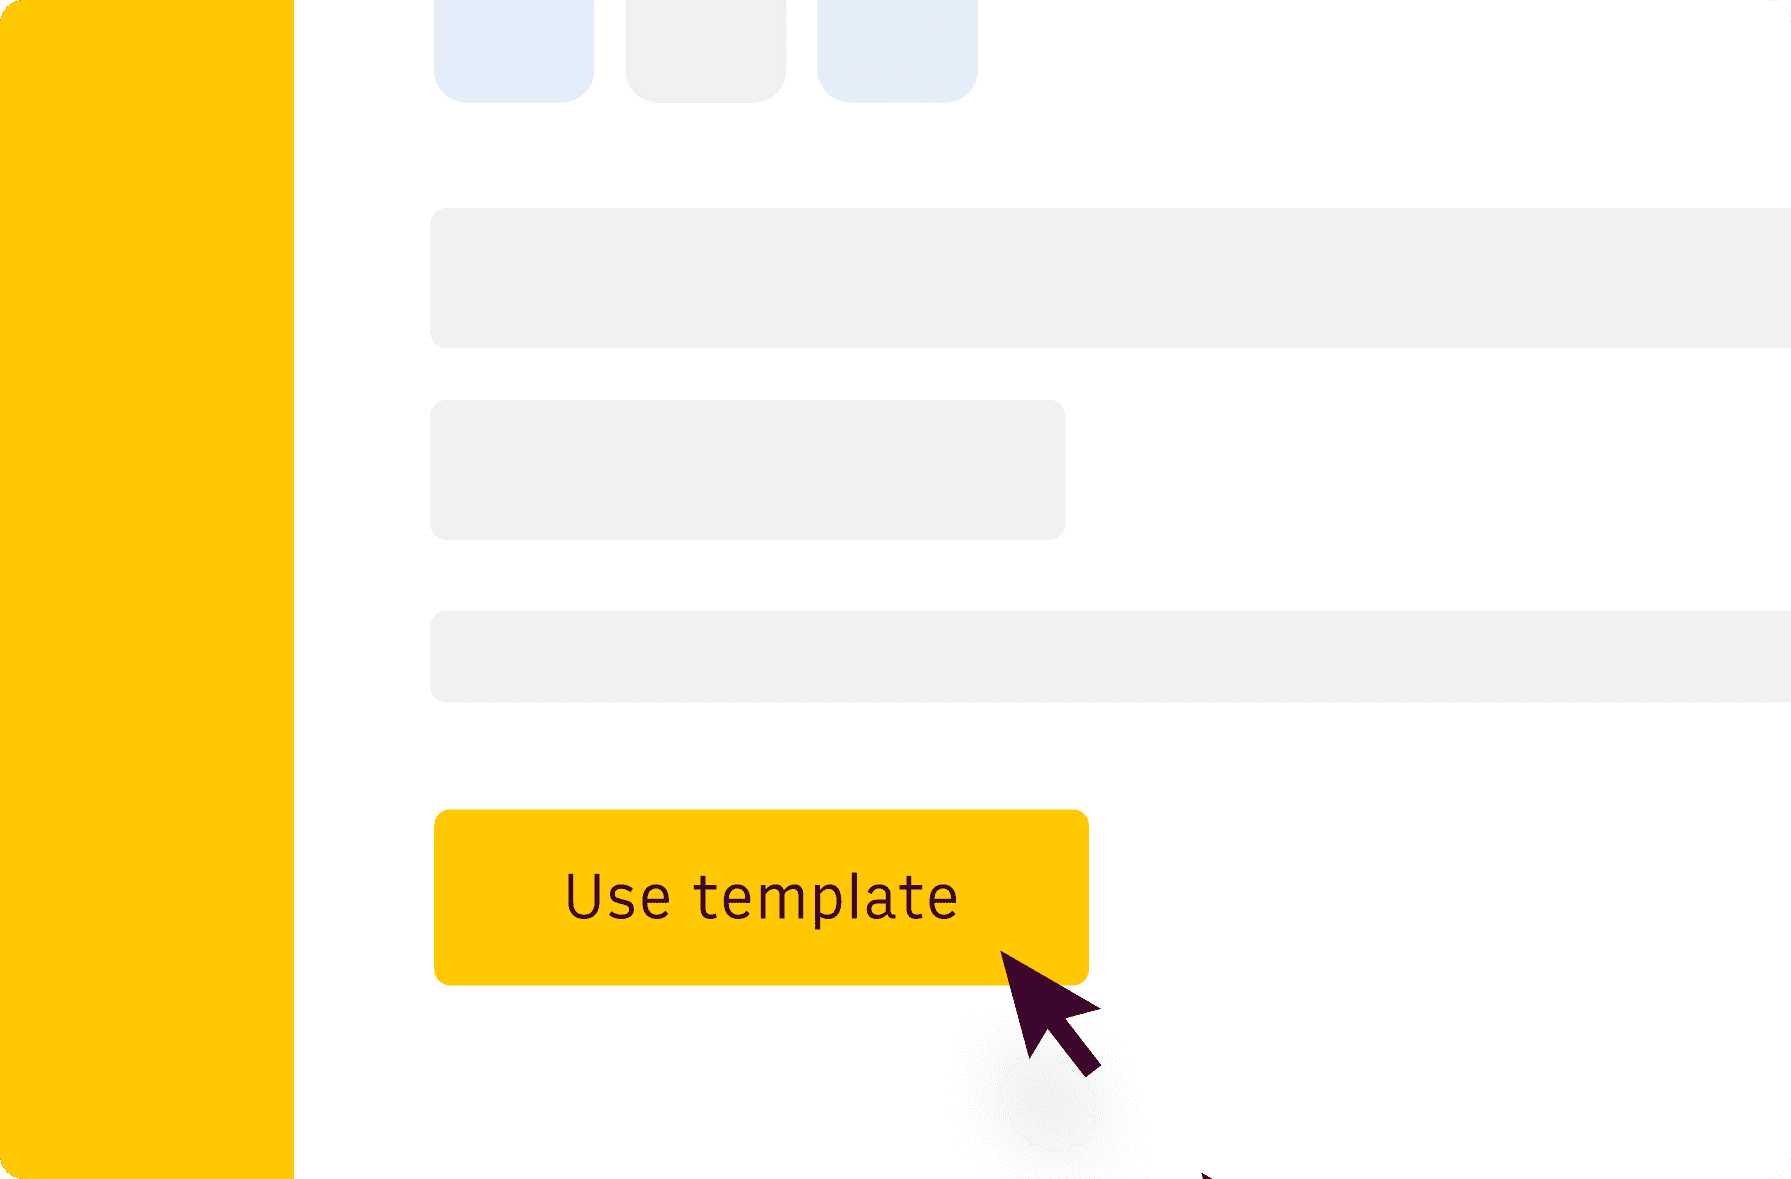
On this page, click on the "Use template" button and save the template in one of your folders.
Step 2: Connect Your Google Ads Account
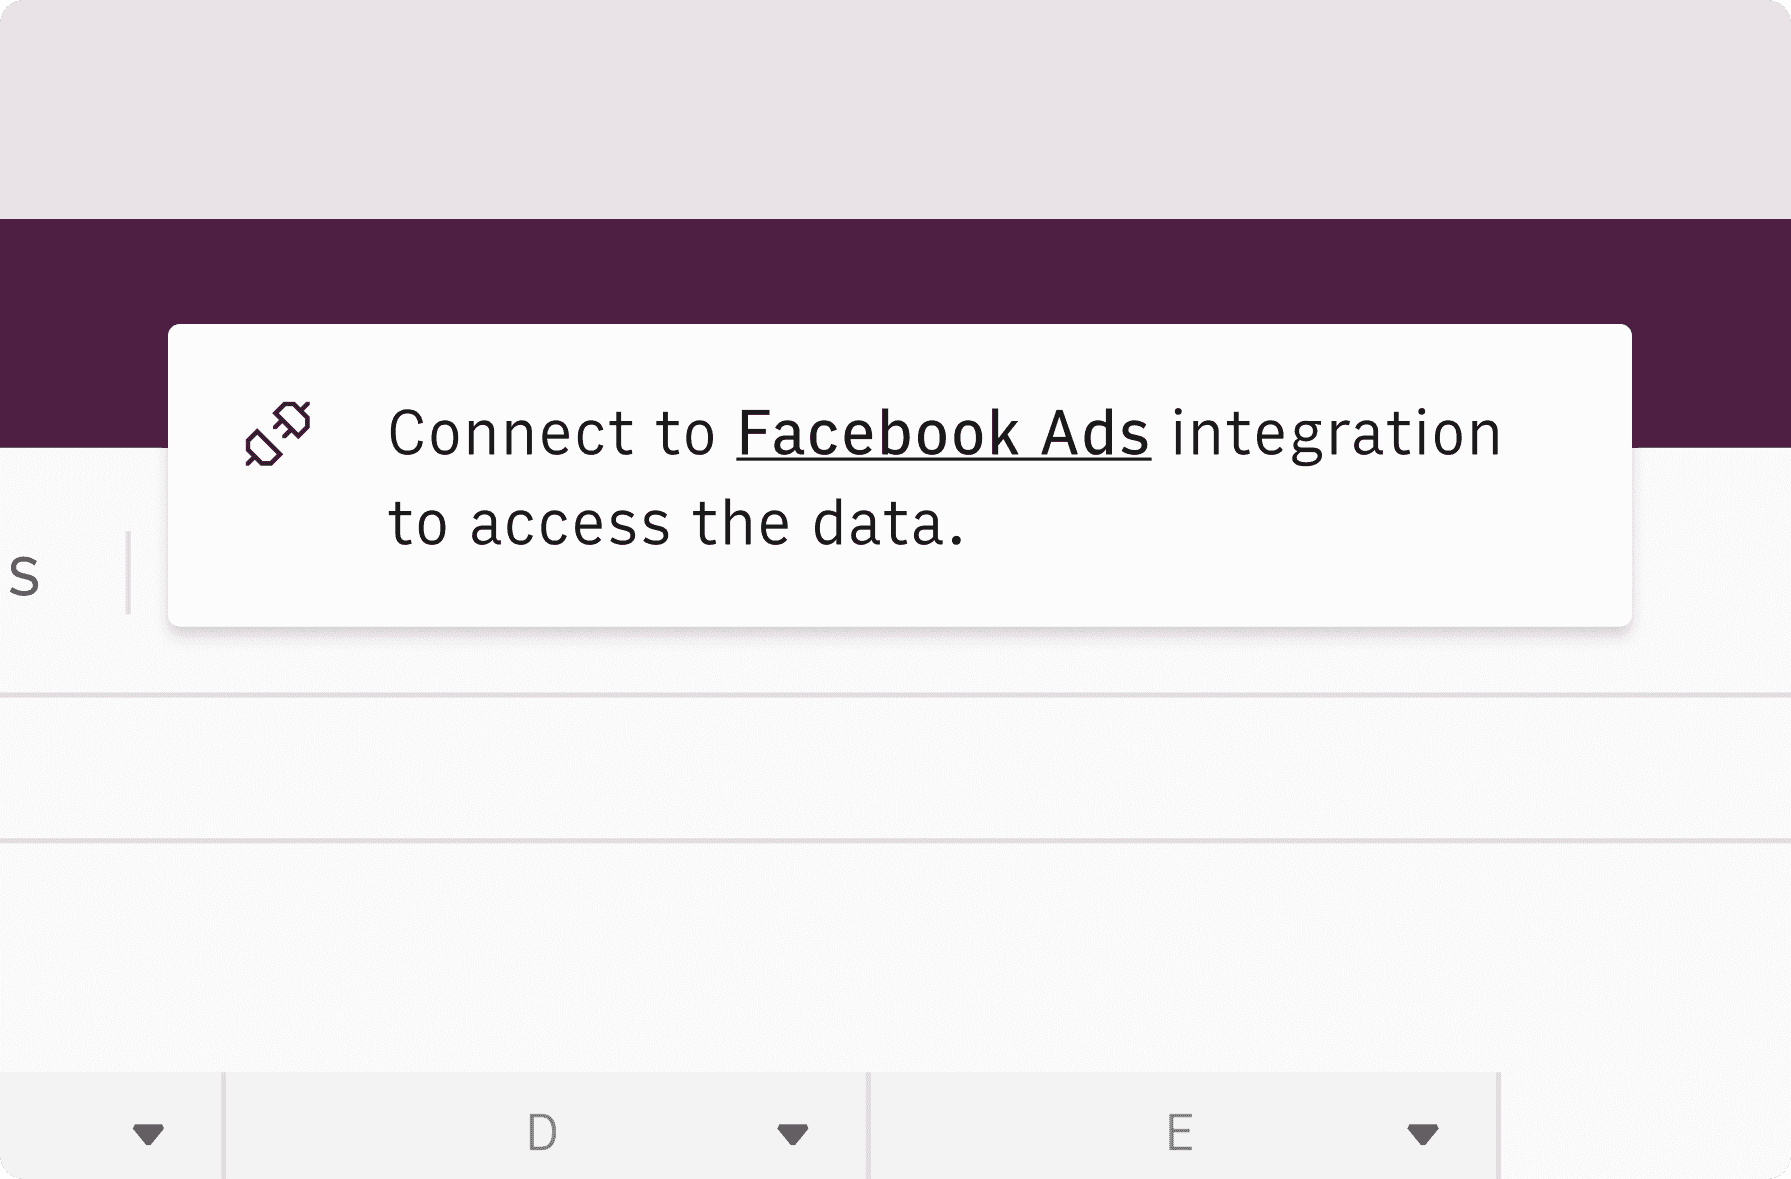
Follow the instructions to connect your Google Ads account. This template is connected directly to your account and will import live data from it.
Step 3: Select Date Range
Pick a date range for your report to analyze keyword performance over a specific period.
Key Components to Focus on the template
Our Google Ads Keywords Report template is designed to provide you with comprehensive insights into your campaign performance.
Here are the key components of the template and what you should focus on:
Summary of Campaigns Table
This table offers top-level insights for each of your campaigns based on their status. It provides a quick overview of:
- Campaign performance metrics (impressions, clicks, CTR, average CPC)
- Cost and conversion data
- Campaign status (active, paused, or removed)
Use this table to get a bird's-eye view of your overall campaign performance and quickly identify which campaigns are performing well and which may need attention.
Top Keywords Tables
The template includes several tables focusing on keywords, highlighting the top performers based on different metrics:
- Top Keywords by Cost: Identify which keywords are consuming the most budget. This can help you decide if the spend is justified by the results.
- Top Keywords by Conversions: See which keywords are driving the most conversions. These are your star performers and might deserve more budget allocation.
- Top Keywords by Clicks: Understand which keywords are generating the most traffic to your website. High clicks but low conversions might indicate a need for landing page optimization.
Ad Groups Report
This page of the template allows you to dive deeper into specific ad groups within a selected campaign. You can:
- Choose a campaign from a dropdown menu
View detailed performance metrics for each ad group within that campaign Compare ad group performance side by side
Use this report to identify top-performing ad groups, spot underperforming ones, and make data-driven decisions about budget allocation and optimization at the ad group level.
Full Data Page
The full data page contains comprehensive data about all your campaigns and ad groups. This is where you can:
- Access live granular data on every aspect of your Google Ads account
- Apply custom filters and sorting to find specific information
- Export data for further analysis or reporting
Use this page when you need to perform in-depth analysis, create custom reports, or investigate specific aspects of your account performance.
Analysis Tips
When using this template, consider the following tips:
- Regularly review all sections to get a complete picture of your account performance.
- Look for trends over time using the date range selector.
- Use the insights from each section to inform your optimization strategies.
- Pay attention to the relationship between different metrics (e.g., high clicks but low conversions might indicate targeting or landing page issues).
Don't forget to consider external factors (like seasonality or market changes) when interpreting the data.
How it works
How it works
Get started
Click on 'Use template' and start using it right away. No forms, no signup. Your data first.
Connect your Google Ads account
Once landed on the spreadsheet, follow the instructions to connect the required integration and pick your account.
Customize the template and schedule refresh
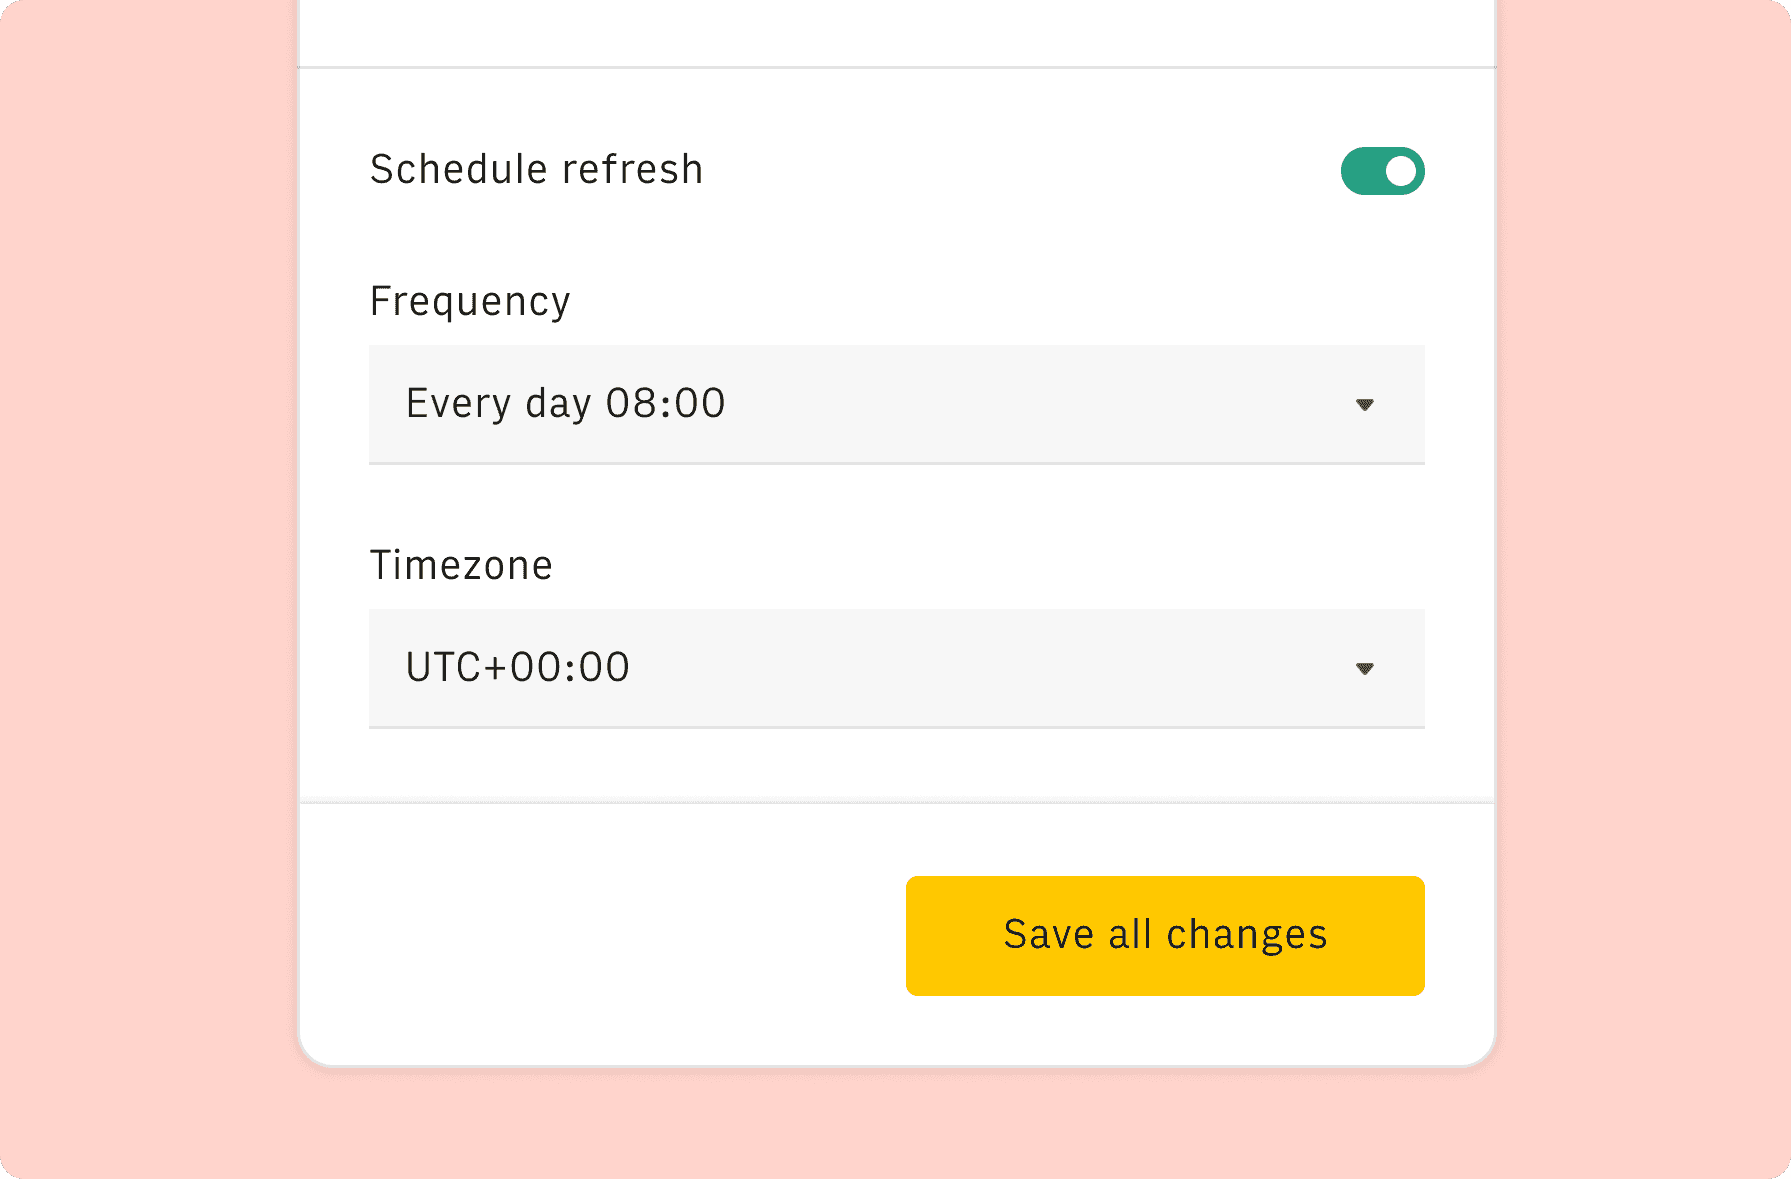
Once the integration has been connected, all tables will update automatically with your own data. Click on 'Edit Source' to change the retrieved data and automate the data refresh. You can then insert a chart or a pivot table, add a column or personalize formats, using all the regular functions and shortcuts that make spreadsheets great.
Embed tables and charts
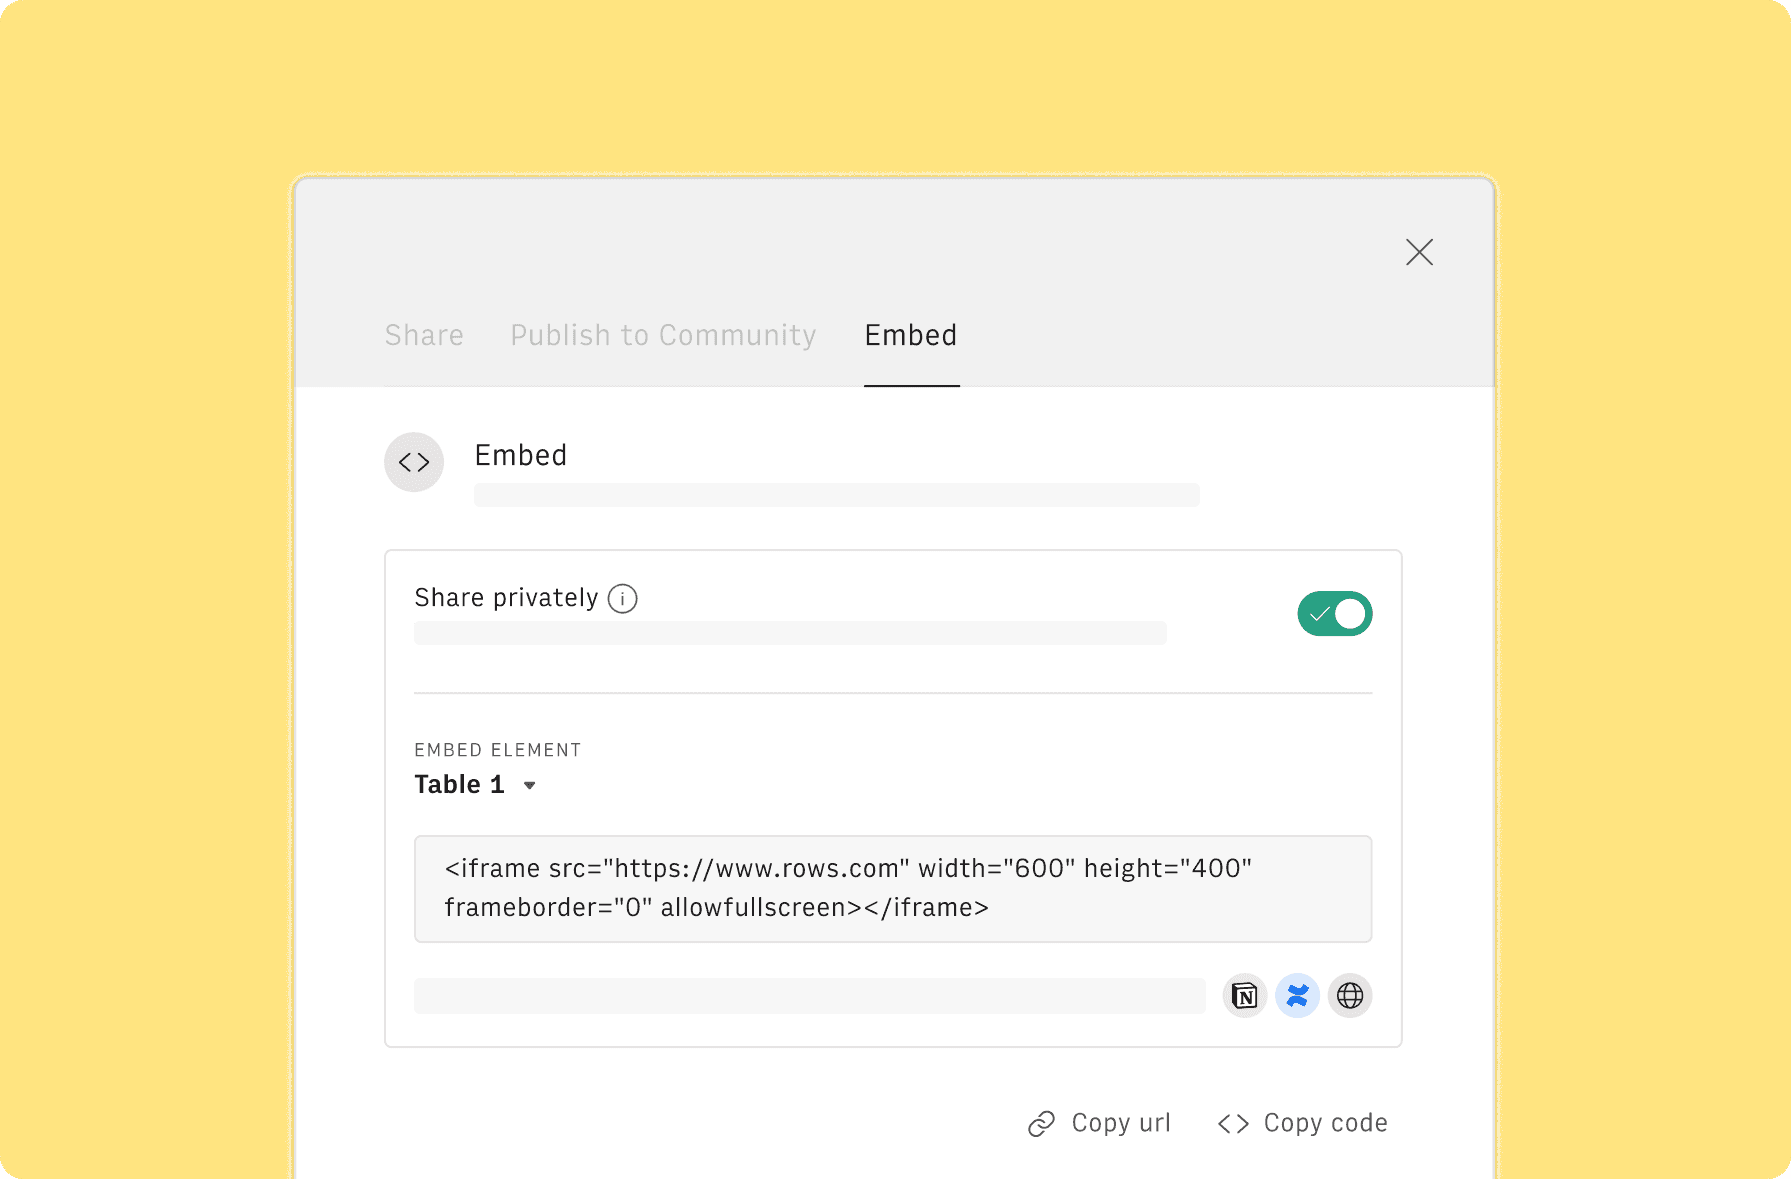
Click on the option menu to embed tables and chart on your Notion, Confluence or any other iframe-ready documents.
Questions and answers
Can I use Rows for free?
More than a Google Ads Keywords Report
Rows is your new AI Data Analyst. It lets you extract from PDFs, import your business data, and analyze it using plain language.
Signup for free
Import your business data
Extract from PDFs and images, import from files, marketing tools, databases, APIs, and other 3rd-party connectors.
Know moreAnalyze it with AI
Ask AI✨ any question about your dataset - from VLOOKUPs to forecasting models - and surface key insights, trends, and patterns.
Know moreCollaborate and Share
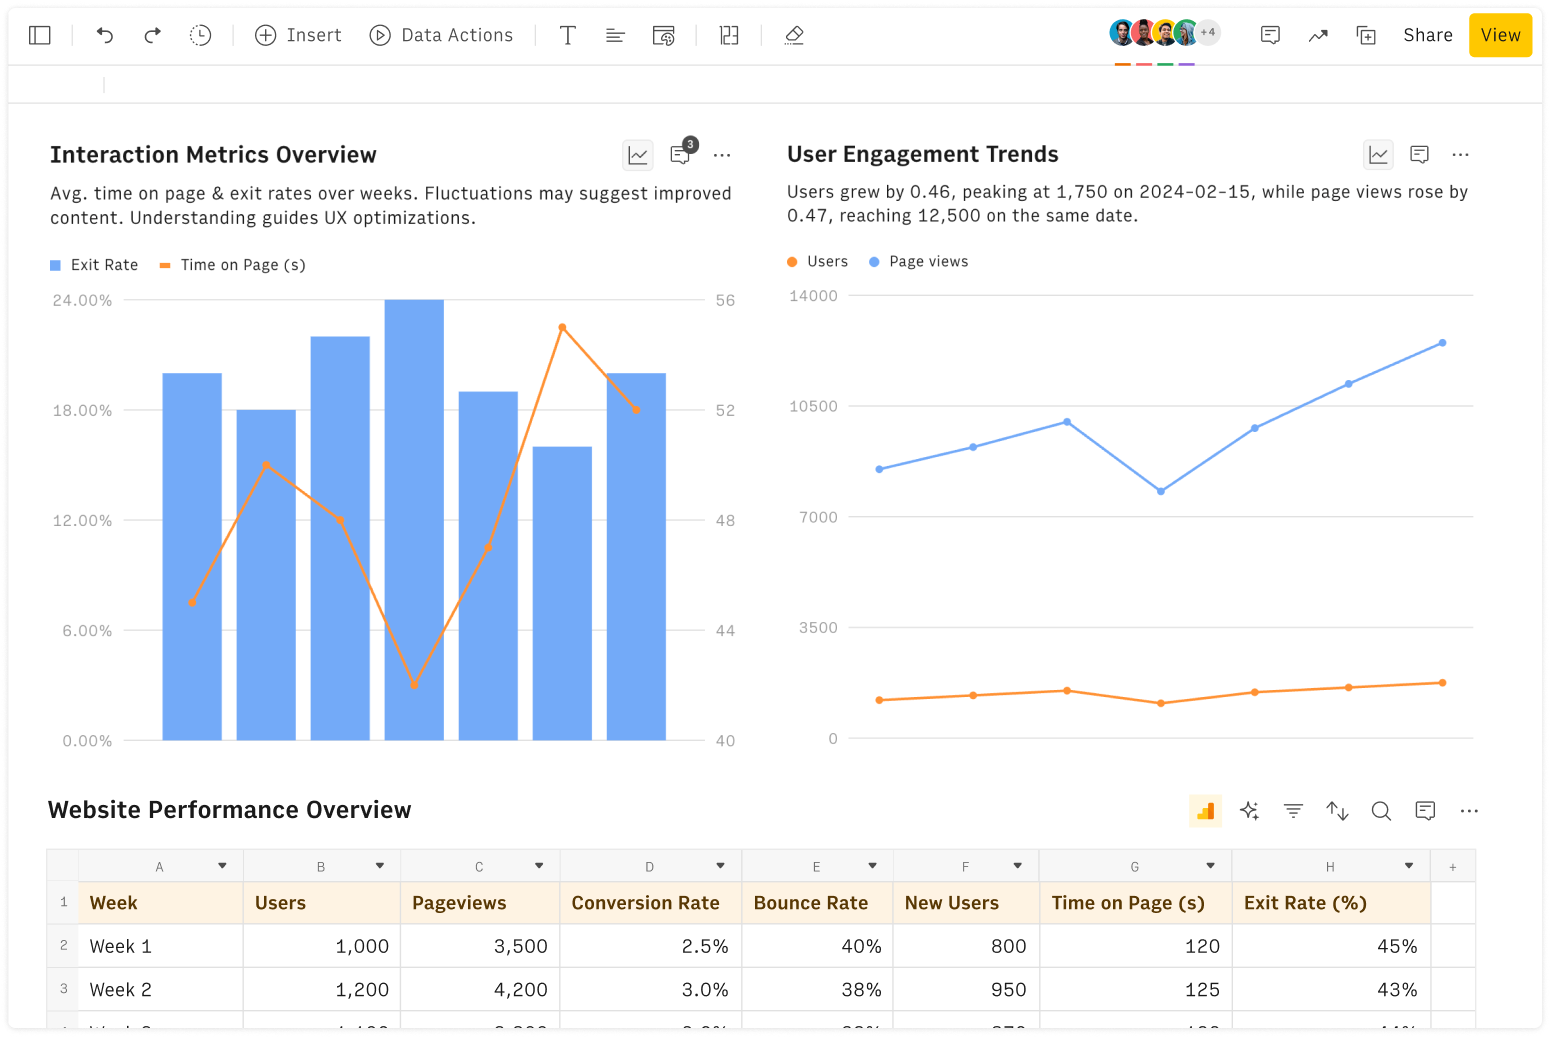
Seamlessly collaborate and share stunning reports with dynamic charts, embed options, and easy export features.
Know more


