Intro
Making an internet business succeed is very much about deeply understanding the so-called ‘user journey’, that is how people interact and engage with your product along the whole funnel: from approaching the website and engaging with your content, to using your features and coming back.
The American cancer society is one of the world's leading institutions in cancer research. It's been working for more than a century, and after having converted part of its business - especially the lead generation - to online, they have soon realized the need to know how users consume its website, with the ultimate aim of channelizing its marketing efforts and reaching their revenue goal.
As a first step, they classified their website users into three buckets: information seekers, event participants, and potential donors. They then use analytics tools to introduce a scoring system for each dimension using custom metrics to check whether they have met their goals. Finally, they focused on retention, designing specific remarketing campaigns for these audiences. Thanks to this approach, revenues have soared by 5.4% year over year.
What is Google Analytics
Google Analytics is the web analytics tool offered by Google, that allows marketing and product managers to map the flow of visitors to a set of specific funnel steps that result in conversions or signups. Along this flow, many KPIs can be evaluated to infer how your users used or perceived specific parts of their journey.
Despite being a powerful dashboard, every time you need the flexibility of a spreadsheet you find yourself exporting/importing .csv files.
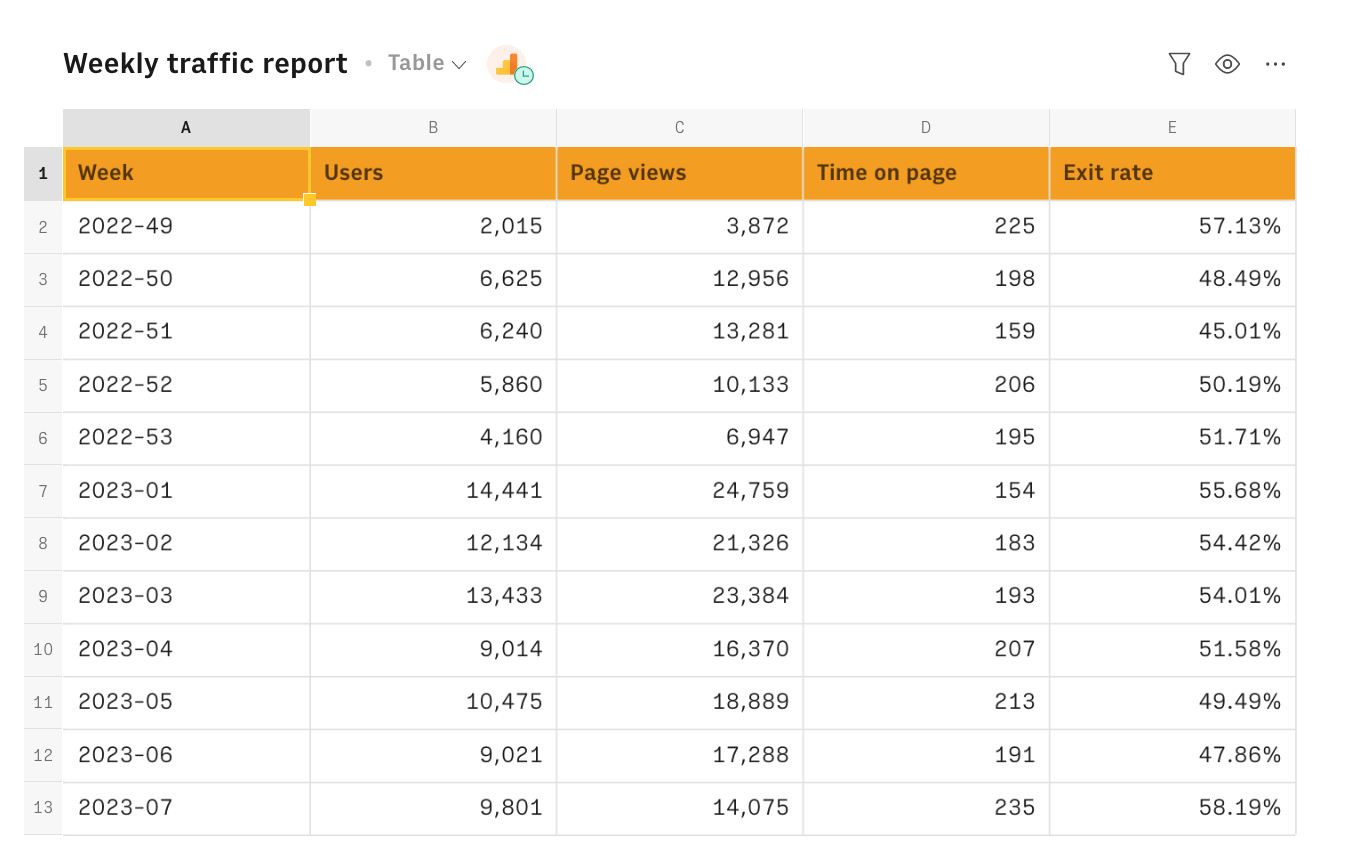
In this short guide, we’ll walk you through everything you need to create a dynamic custom Google Analytics report directly in Rows. Here’s a sneak peek at what you will get:
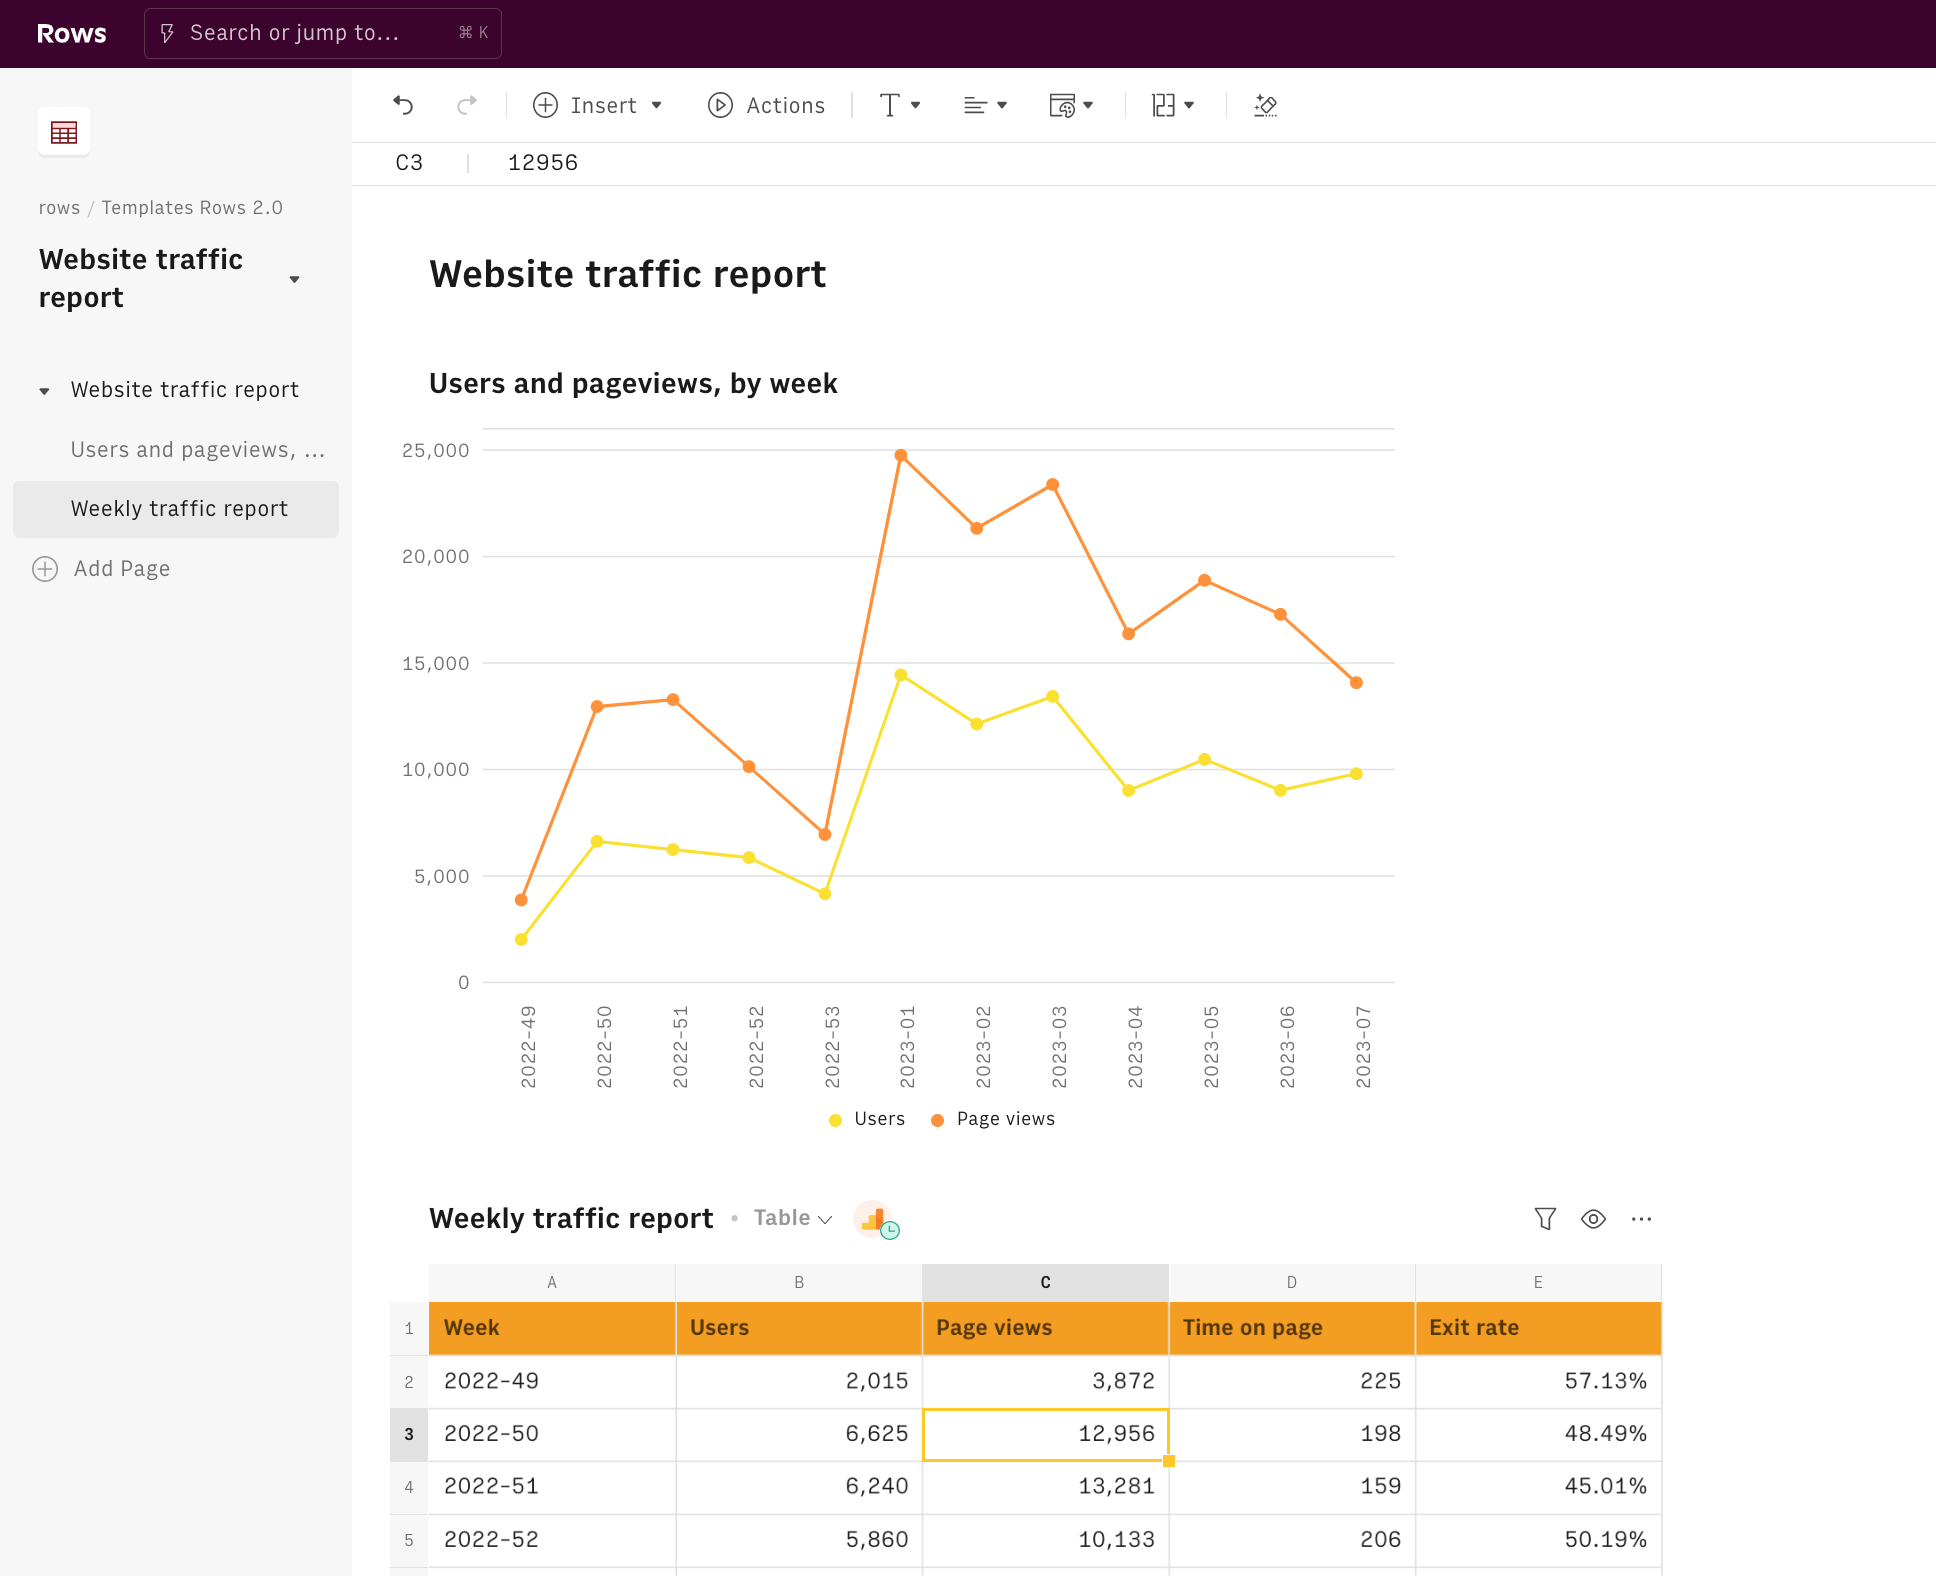
Let's go!
To understand how we’re going to build it, let’s go step by step.
First of all, you need to enable the Google Analytics integration.
Click on the Connect button and follow the instructions. The Google Auth page will open: enter your Google credentials and authorize Rows to retrieve your data.
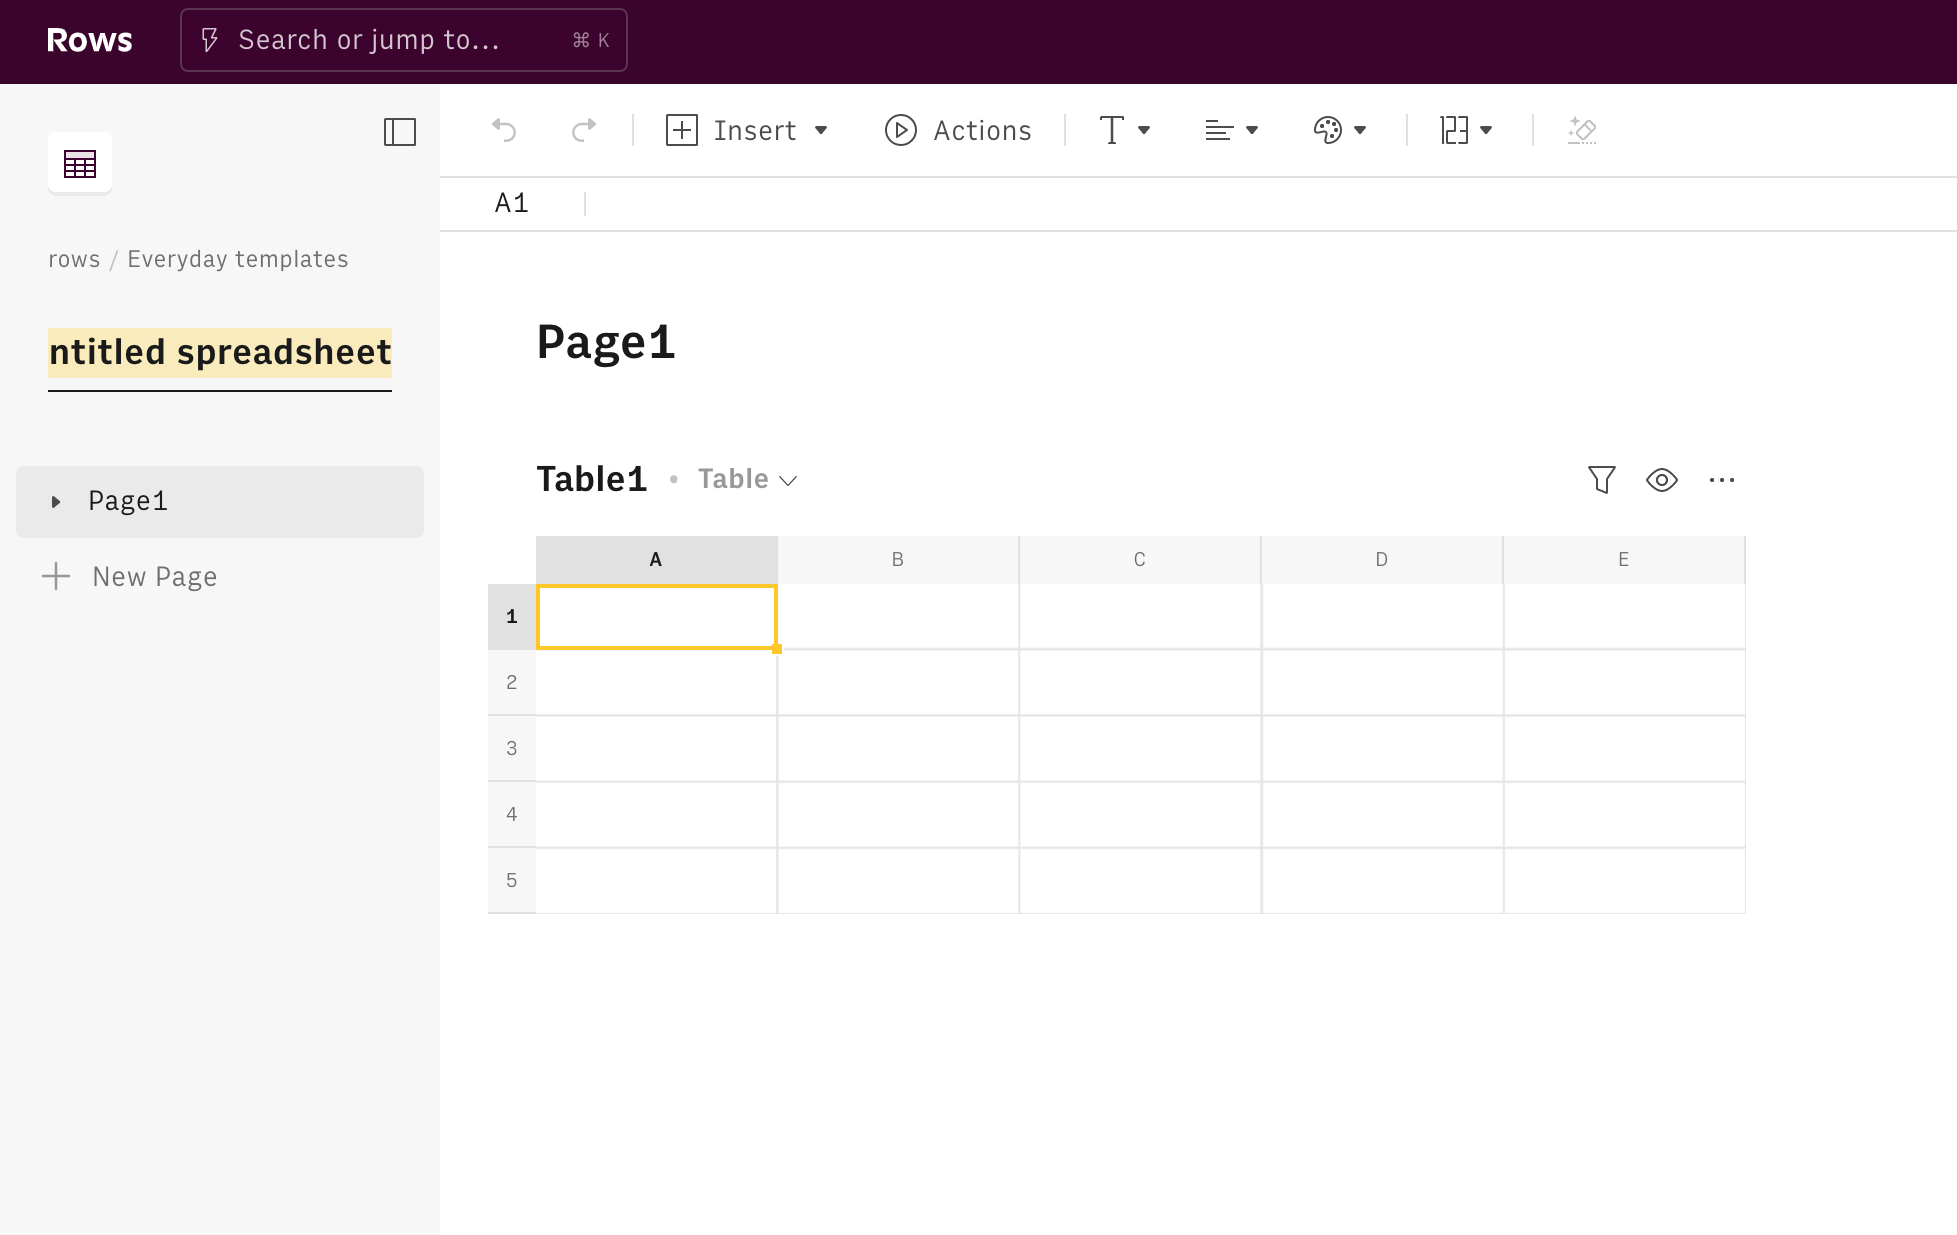
Now you are ready to build your report. Click on the Create spreadsheet button at the top of your dashboard.
Once you land on your spreadsheet, first of all, rename it: click on its title in the top left corner and type the new name. Use it also as a title for the first page, by pasting it on the page title. It'll be easier to find it later on.
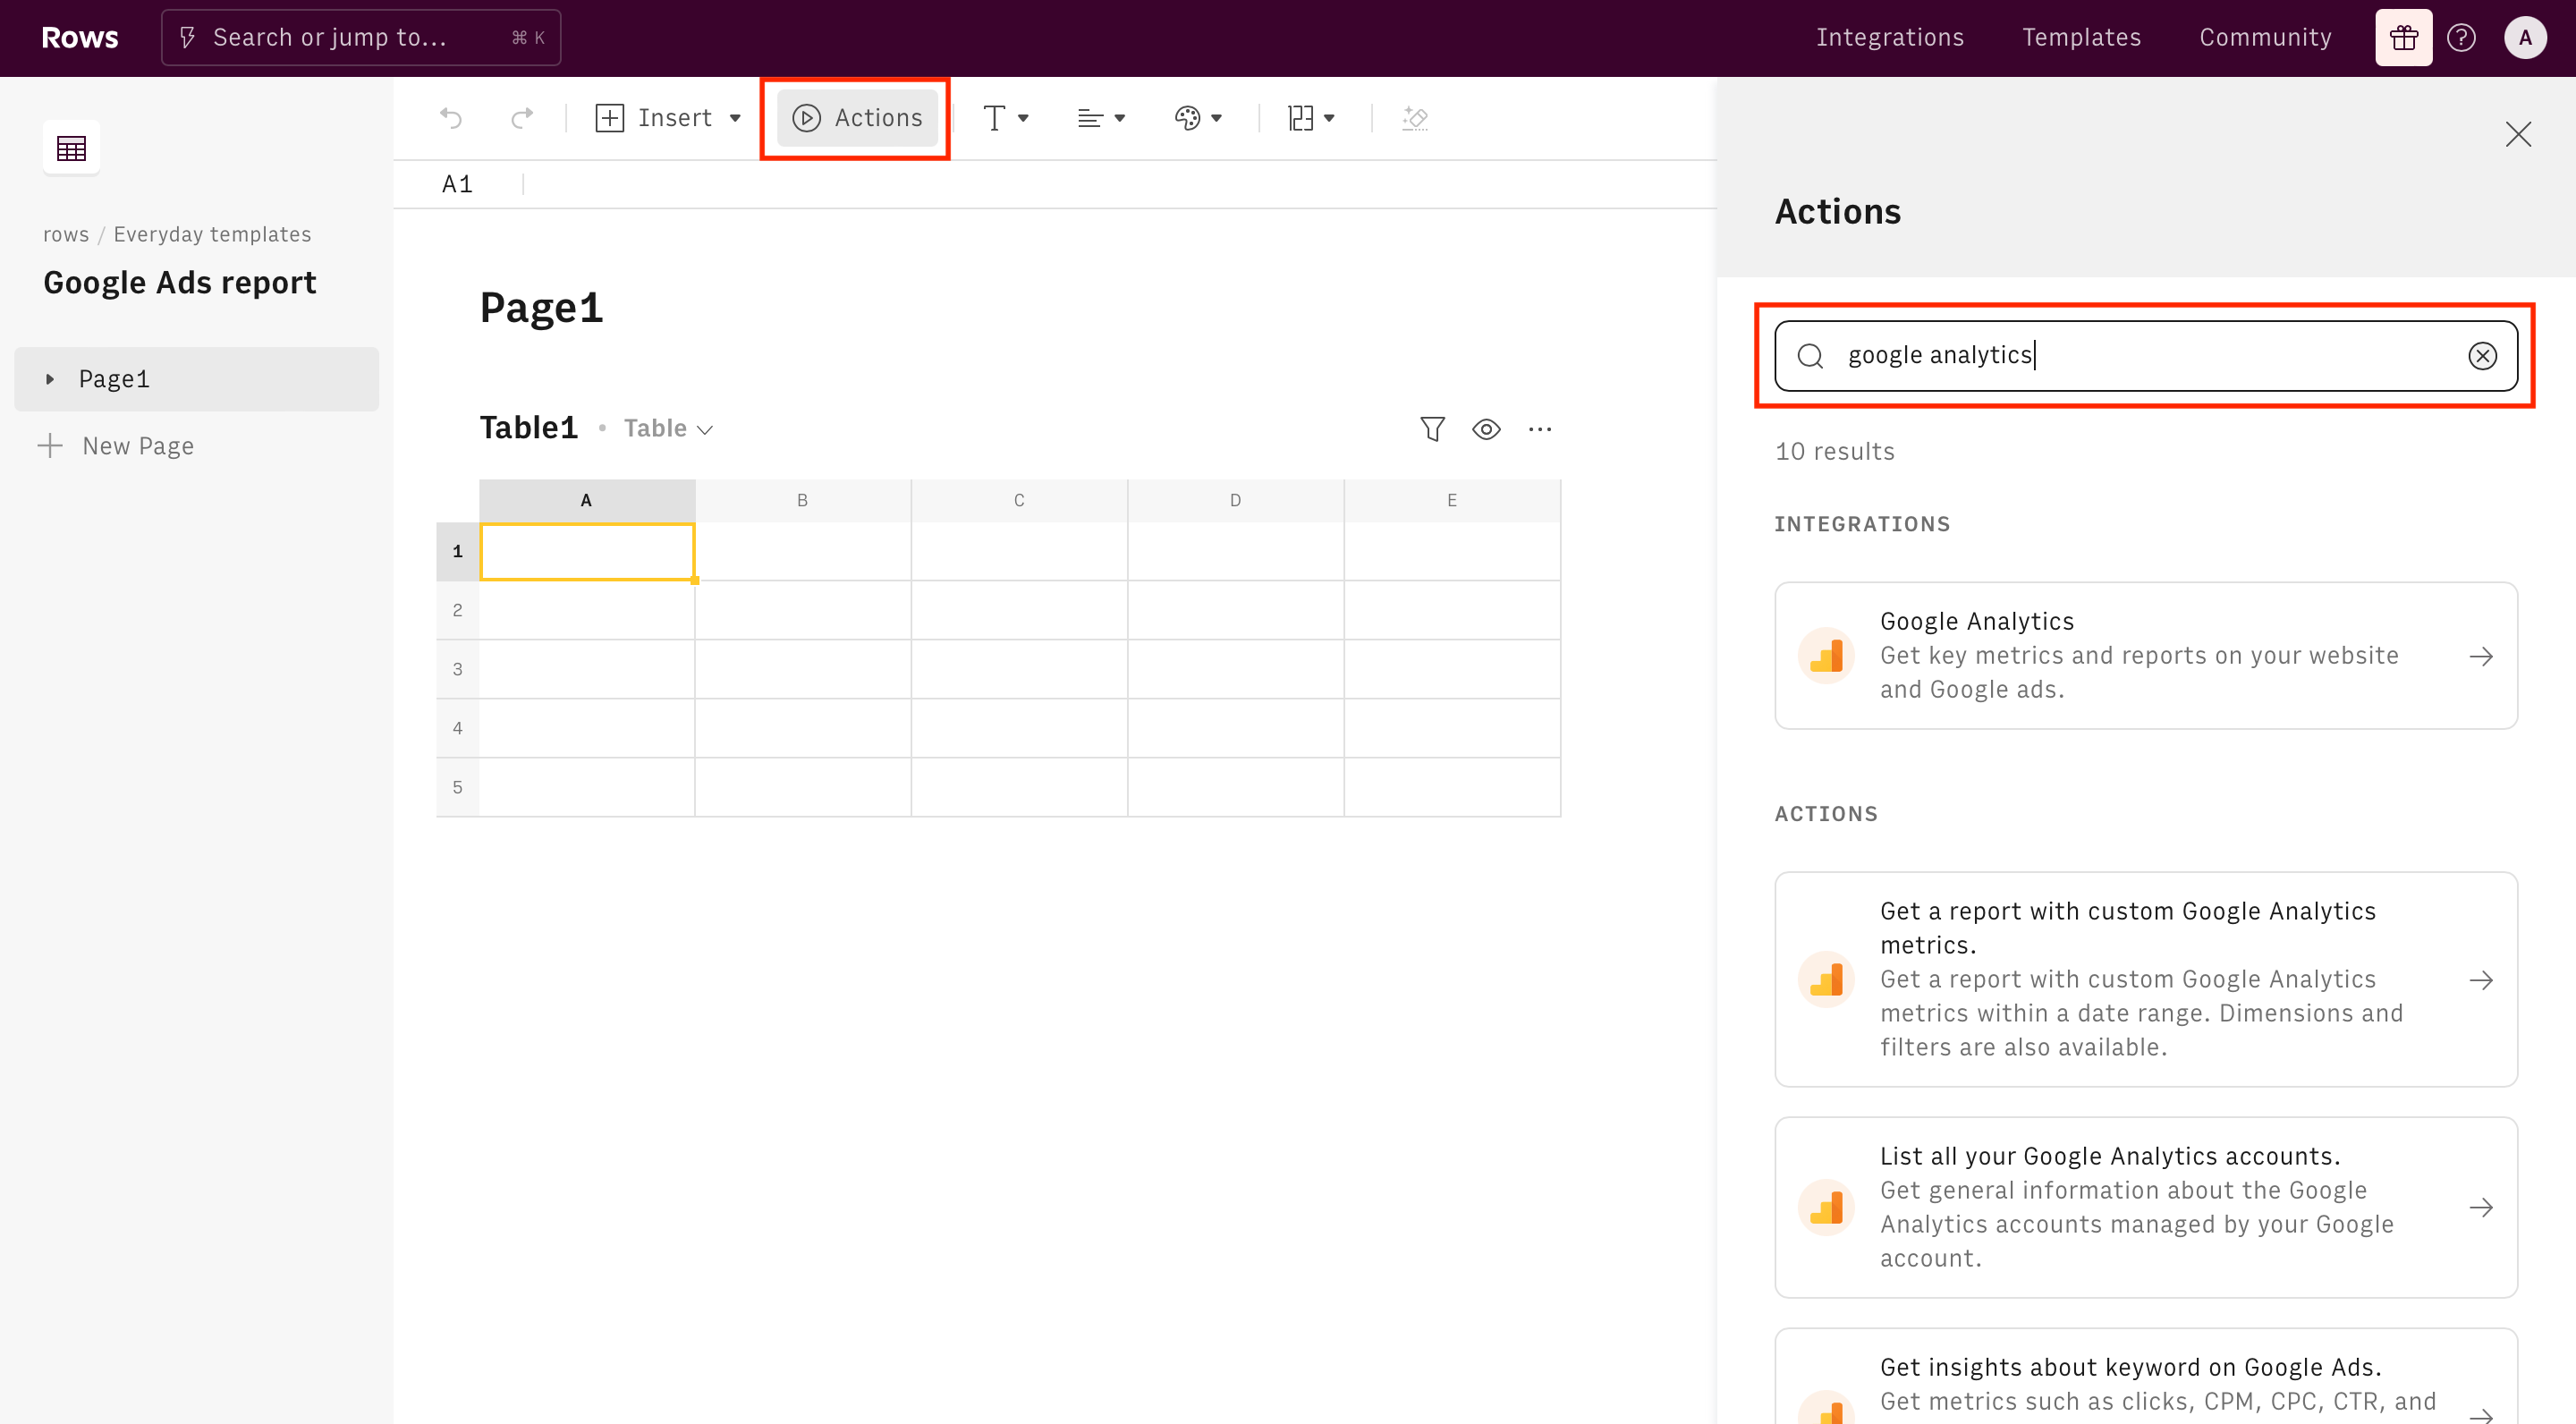
Rows allows you to have multiple tables on the same page, giving you a neat view of your data. Hit Actions in the toolbar. Look for our Google analytics functions: many are available, depending on your ultimate goal, such as:
Get a report with custom Google Analytics metrics,
Get page metrics,
Get session metrics,
Get insights about search queries on Google Ads.
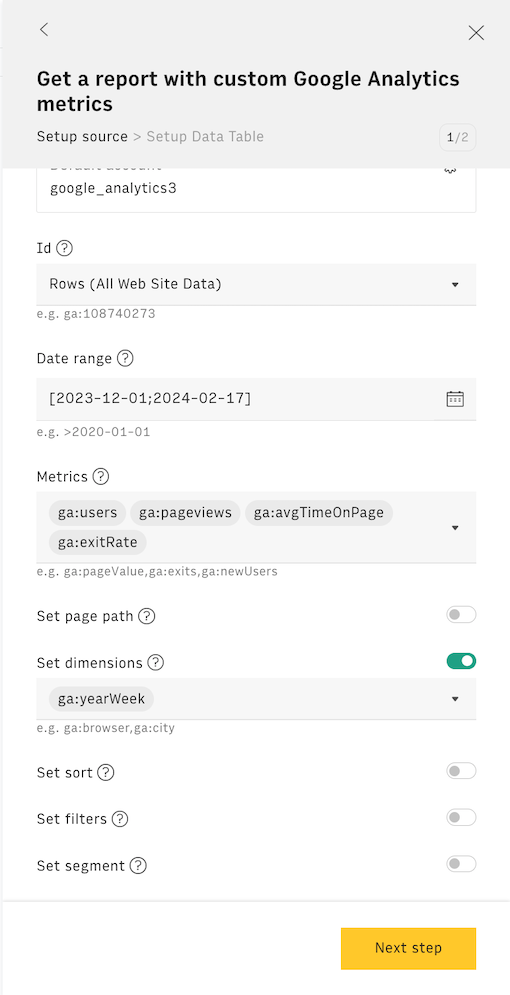
For the purpose of this guide, we choose to retrieve data using Rows' Get a report with custom Google Analytics metrics and build a simple view of the typical traffic metrics, aggregated per week.
On the right-hand side of your display, the function wizard shows up. At the top, you can see the name of the integration you turned on in the first steps of this guide. Let's go through all the fields together:
- Id. Pick here your profile Id from the drop down list
- Date range. Use it to filter your data within the specified timeframe
- Metrics. These are the key metrics you want to display in your report, such as pageViews, session, Average time on page, etc. To know more, please have a look at Google metrics and dimensions explorer
- Set page path. Use it to filter your data for specific page paths, i.e. /pricing
- Set dimensions. Use it to break down your data according to some specific variable, i.e. time, browsers, location. Google supports up to 7 dimensions. To know more, please have a look at Google metrics and dimensions explorer
- Set sort. Use it to sort your data asc or desc
- Set segment. Use it to filter your data for a specific segment of users
Clicking on the button Next step, Rows will guide you through the creation of the output table, to display all data retrieved from the integration.
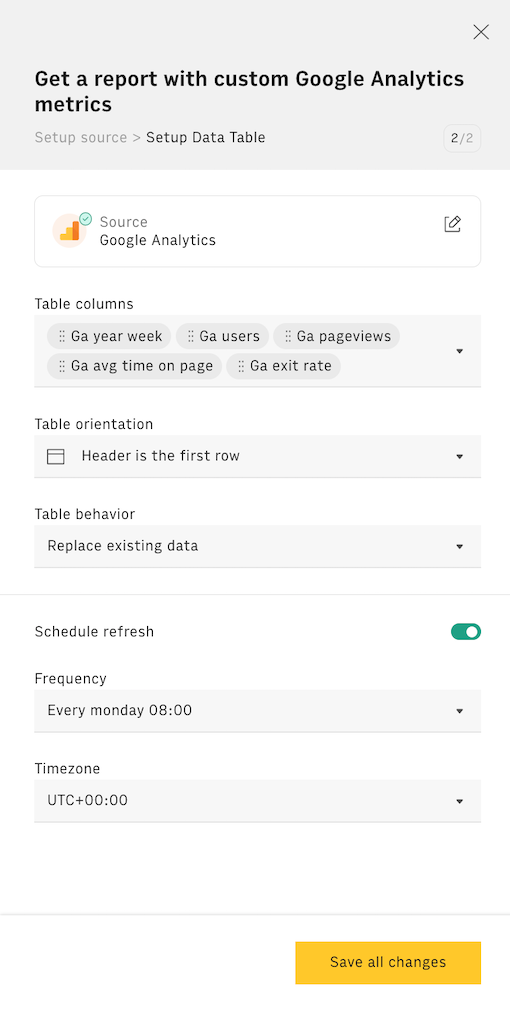
The first drop down will display the table's columns, based on the metrics you picked in the previous step. You can also set a refresh schedule to make your table fetch new data at a given frequency. If you chose YearWeek as dimension in the previous step, pick a weekly schedule ('Every Monday 08:00'). Once done, hit Create Data Table.
You can always rename the table's columns directly in the cells, and reorder them by selecting and dragging.
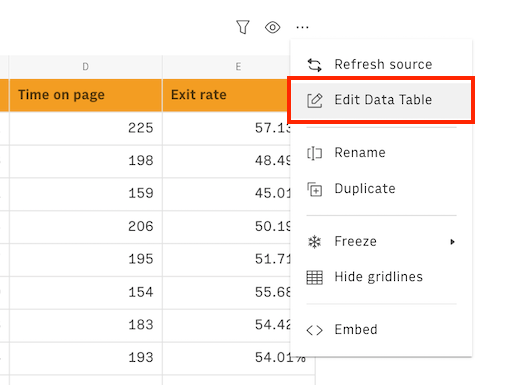
If you followed all the above points, you now have a summary table showing aggregated metrics for each week in the selected time frame. Of course, you can choose to pull data only for specific pages - e.g. your /pricing page - and breaking down per country or device -, the goal being to understand how users from different countries, using mobile vs. desktop devices interact with your pricing page. All you need to do is to go back to your Data Table and click on the "..." icon in its top right corner and then on Edit Data Table
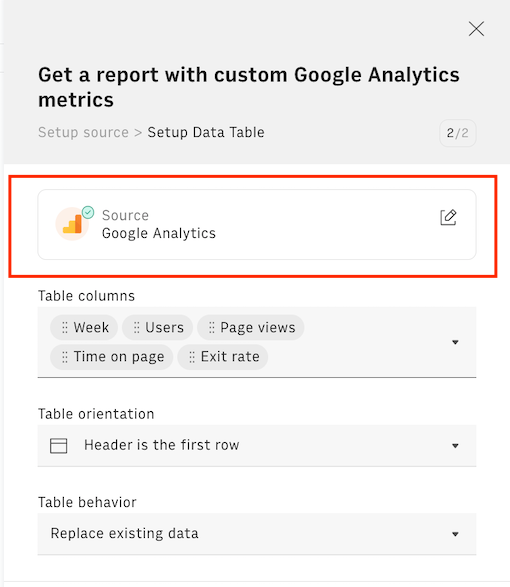
Once the right-end side panel will open, click on the data source Google Analytics to amend your configuration.
Embed into documents
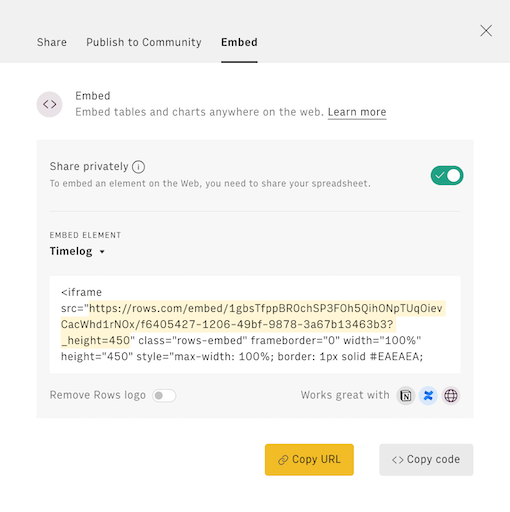
Finally, if you are using Notion or any other internal tools that support iframes to build a report, you can embed any table or chart of this spreadsheet in your document. Just click on the ... icon in the top right corner of any table or chart and pick Embed. A modal will open, as follows:
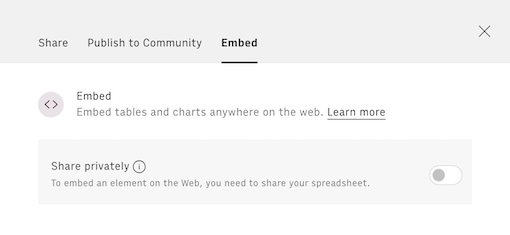
Before embedding, you need to grant access to it. To do so, toggle on the Share privately option and then hit the Copy URL button: your element is now ready to be pasted into your favorite tool.
This is how Rows embed looks on Notion:

You might also like
Check also
Interested in marketing analytics? Discover other guides:
- Monitoring your growth experiments with Google Analytics
- Monitoring your website search performance with Search Console
- Tracking keywords' performance with Search Console
Discover our Marketing playbook.