What is Rows
What is a financial budget
A financial budget is a detailed plan that outlines expected income, expenses, and savings over a specific period, typically a month or year. It helps individuals or organizations manage their finances by allocating resources to various categories, such as essentials, discretionary spending, and savings goals.
When it comes to startup, monitoring budget is the bread and butter of any successful founder. Without it, any company is just like a ship without a sail - adrift and at the mercy of the financial seas.
By keeping a close (and smart) eye on our expenses, a founder can avoid financial pitfalls and make the most of the company's limited resources. Plus, it demonstrates to investors that the company can handle its money, which can be the deciding factor in securing further rounds.
In this short guide, we'll walk you through a simple - yet effective - financial budget model.
Here's a sneak peek of what you'll get:
How to build your startup financial budget
To use our template, follow the link Financial budget, click on Use template and save it in one of your workspace’s folders.
This template offers you an easy UI to build and monitor your company's main budget over time.
Let's reverse-engineer it together.
First, use columns A and B of the Monthly expenses table to input your cost items' description and their annual budget.
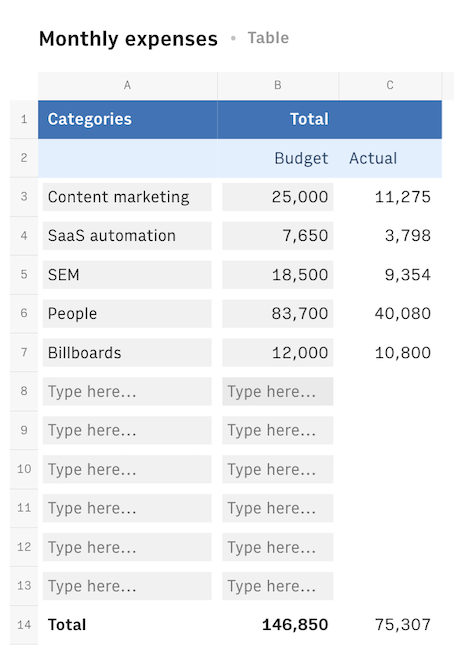
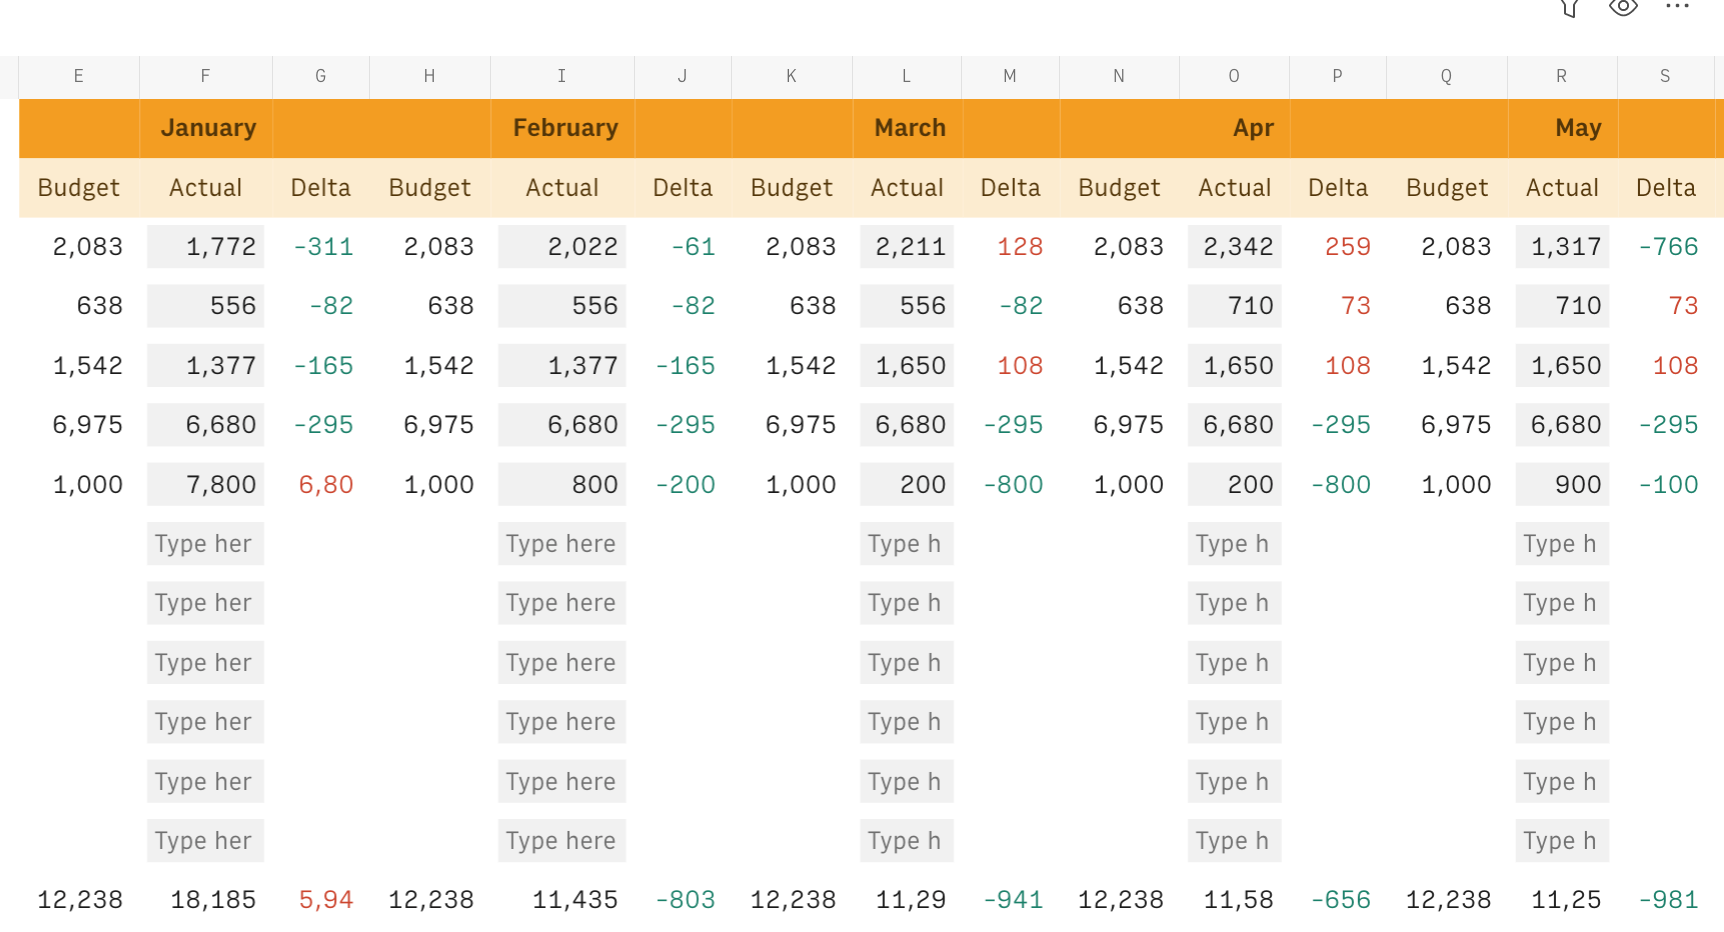
The table will automatically split each cost evenly throughout the year, showing the expected expenses for each month starting from column D.
The third column for each month displays the delta between the actual expense and the expected one, in green if some budget is left and in red if it is over budget:
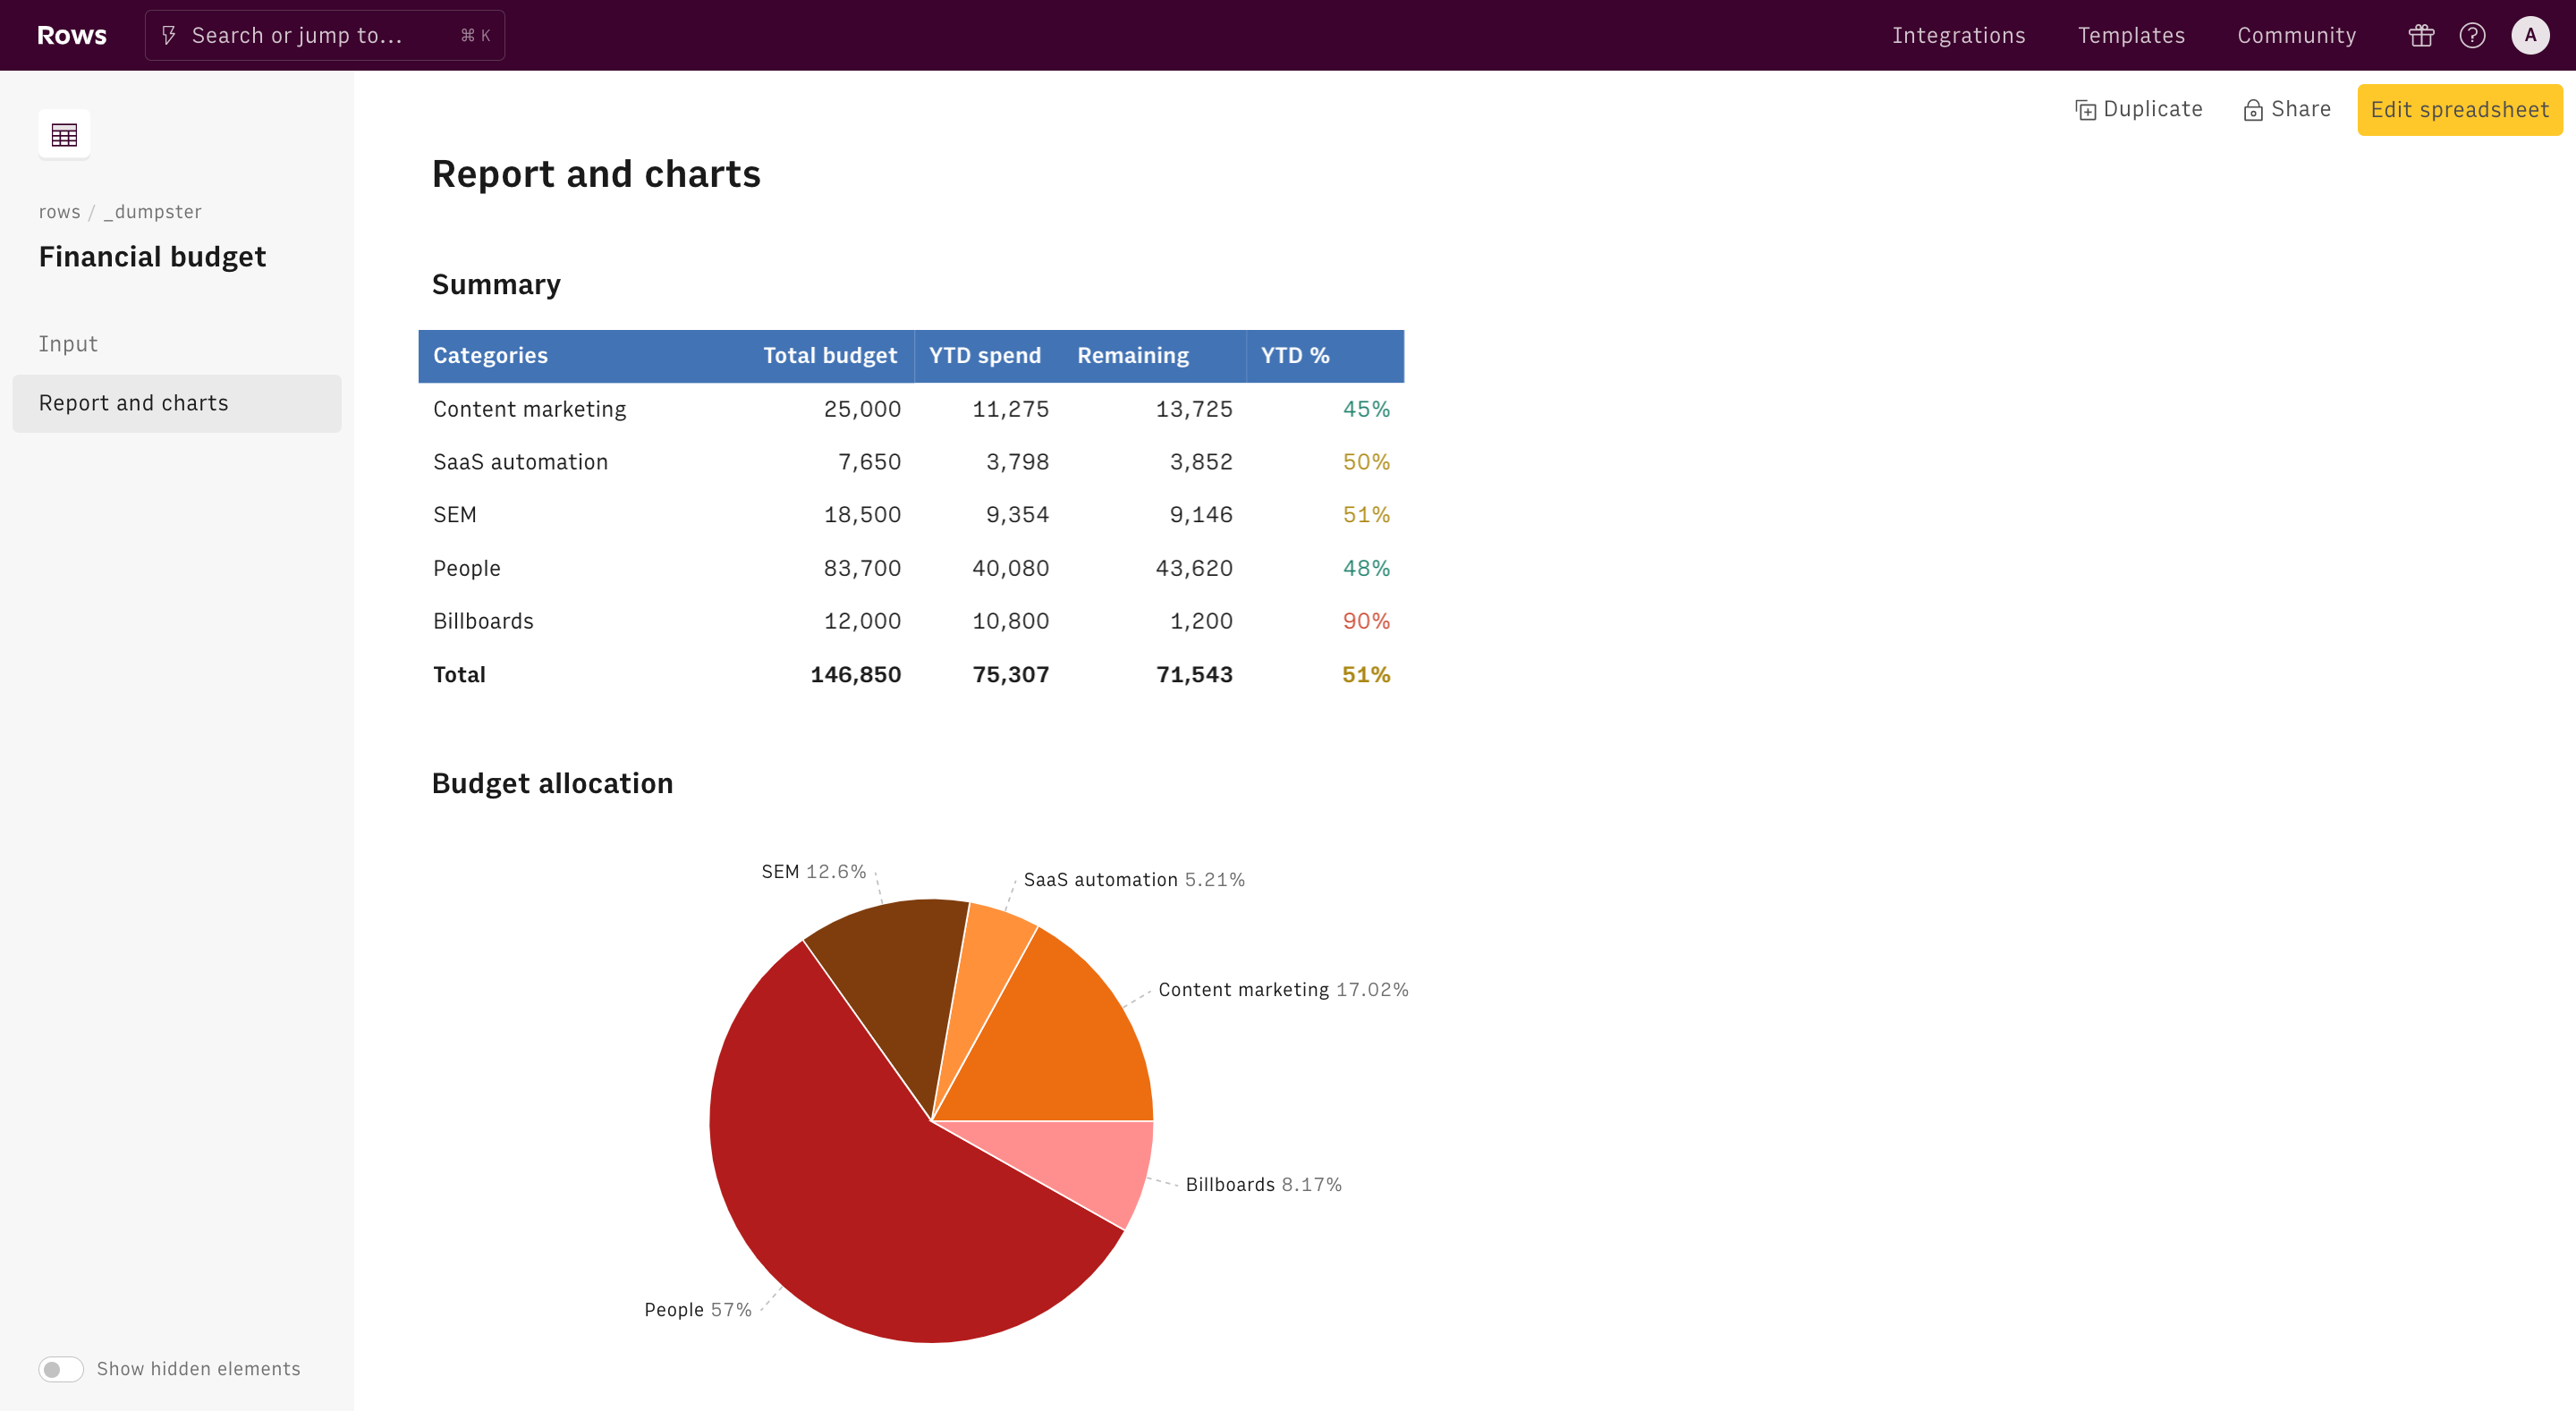
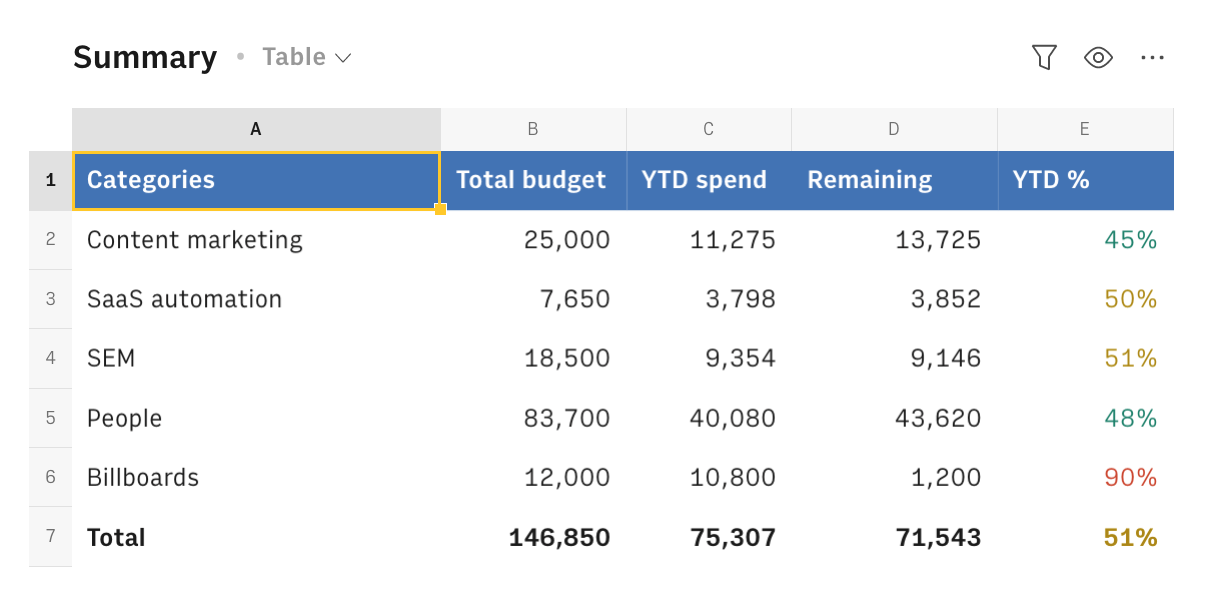
The Report and chart page include some summary stats for each expense category and a chart.
The Summary table shows the total budget, the year-to-date spending, the remaining budget, and the percentage progress for each spending category. The latter is displayed in green if the value is below 50%, yellow if above 50% and red if above 90%:
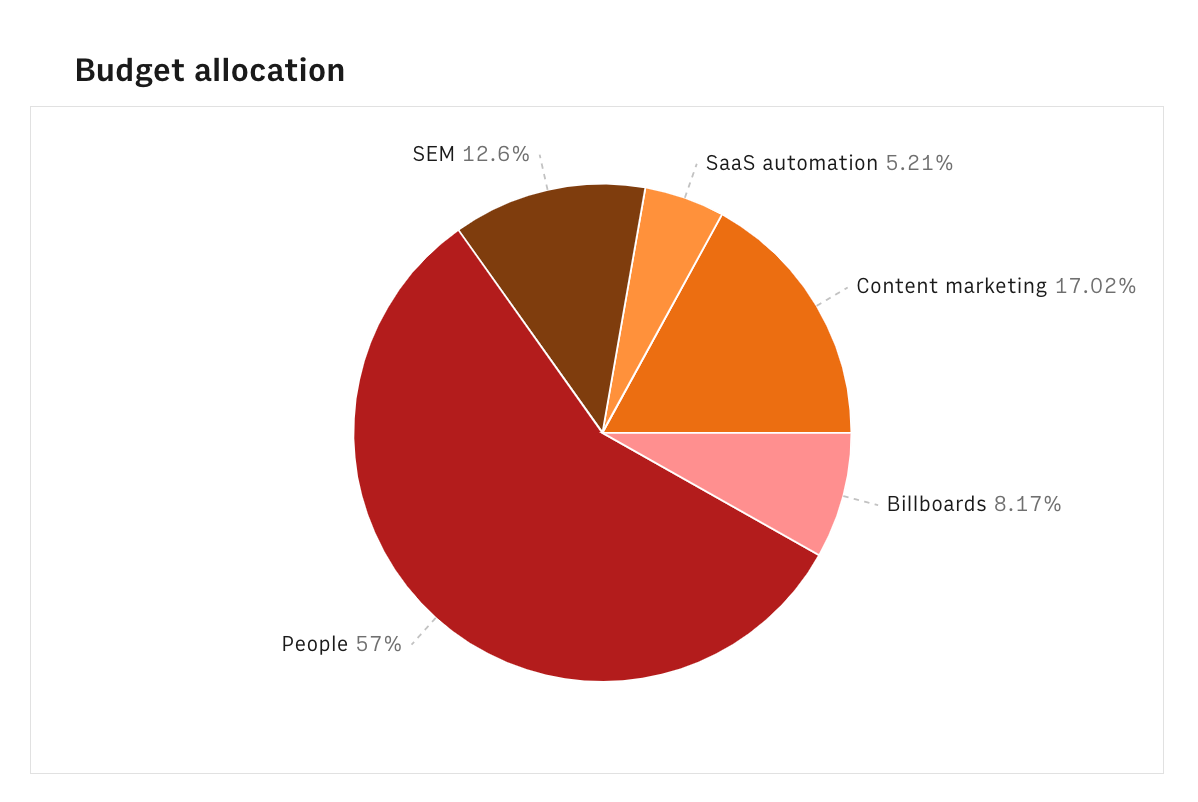
The Allocation pie chart gives you an immediate representation of the weight of each spending category over the total budget:
Embed your budget into documents
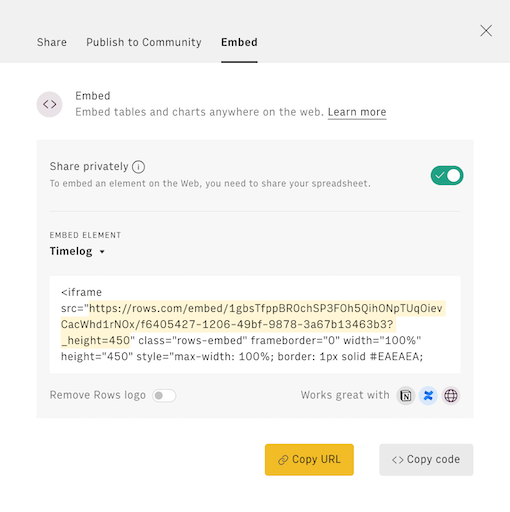
Finally, if you are using Notion or any other internal tools that support iframes to build a report, you can embed any table or chart of this spreadsheet in your document. Just click on the ... icon in the top right corner of any table or chart and pick Embed. A modal will open, as follows:
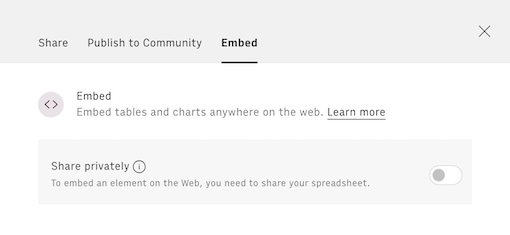
Before embedding, you need to grant access to it. To do so, toggle on the Share privately option and then hit the Copy URL button: your element is now ready to be pasted into your favorite tool.