Intro
In 1998, Google was founded and a revolutionary way to search the web came to life: at the time, conventional search engines used to rank results by counting how many times the search terms appeared on the page. Google theorized about a better system that analyzed the relationships among websites: needless to say, in a booming market, better results to users meant an incredible opportunity to deliver the right message to the right audience.
One year after the foundation, Google launched Adword the first attempt to convert the search revolution into an advertising revolution. Today, Google Ads is the first source of revenue for Alphabet Inc, contributing US$168.6 billion in 2020.
In this short guide, we’ll walk you through everything you need to build a dynamic Google Ads report, that pulls data directly from your Google Ads account into your spreadsheet.
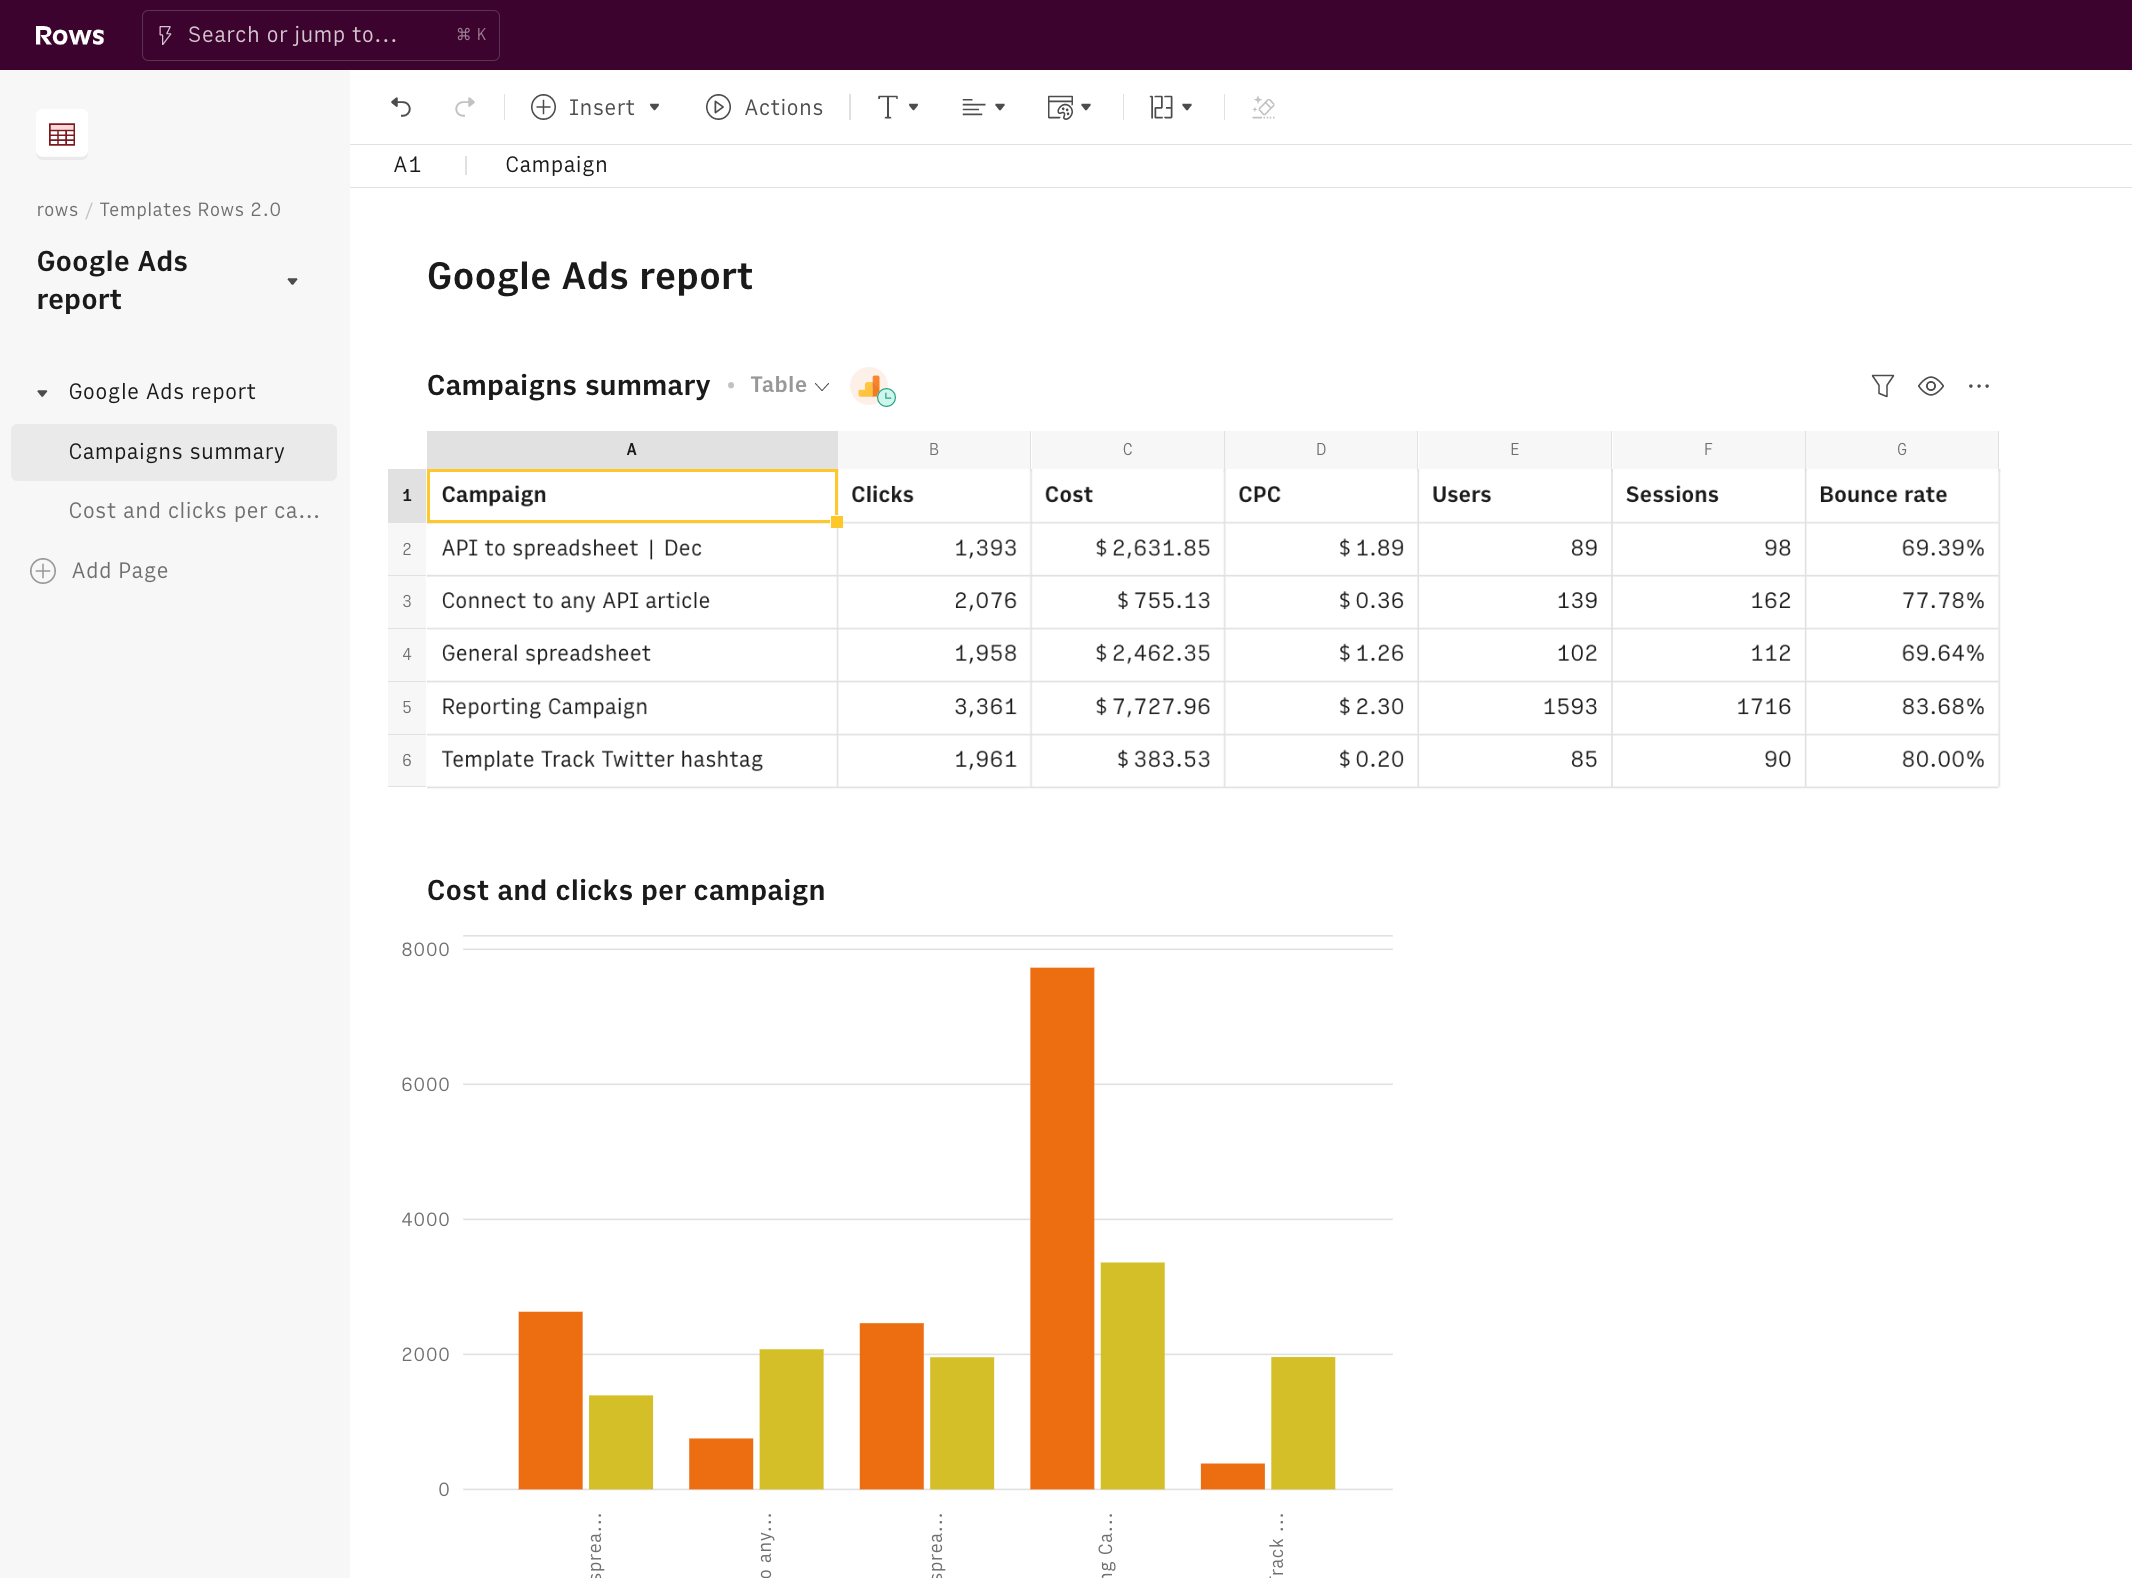
Here’s a sneak peek at what you will get:
What is Google Ads
As the world’s top search engine, it’s no surprise that many marketers promote their businesses with the help of Google Ads.
To help you handle Rows Google Analytics functions, let's go through some key definitions about Google Ads.
There are 3 main layers in every Google Ads structure: the account, campaign, and ad group.
- The account. This is associated with email and password and used to set up billing details
- The campaign. At this level, you set up the budget and determine where your ads appear. Each campaign will contain ad groups, which in turn contain keywords that tie to your text ads and direct to your landing page
- The ad group. It contains a set of similar ads and keywords, words, or phrases describing your product or service that determine when and where your ad can appear.
Creating an ads campaigns report
To understand how we’re going to build it, let’s go step by step.
To start, you need to enable the Google Analytics integration that will allow Rows to pull data from your Google Ads account.
Click on the Connect button and follow the instructions. The Google Auth page will open: enter your Google credentials and authorize Rows to retrieve your data.
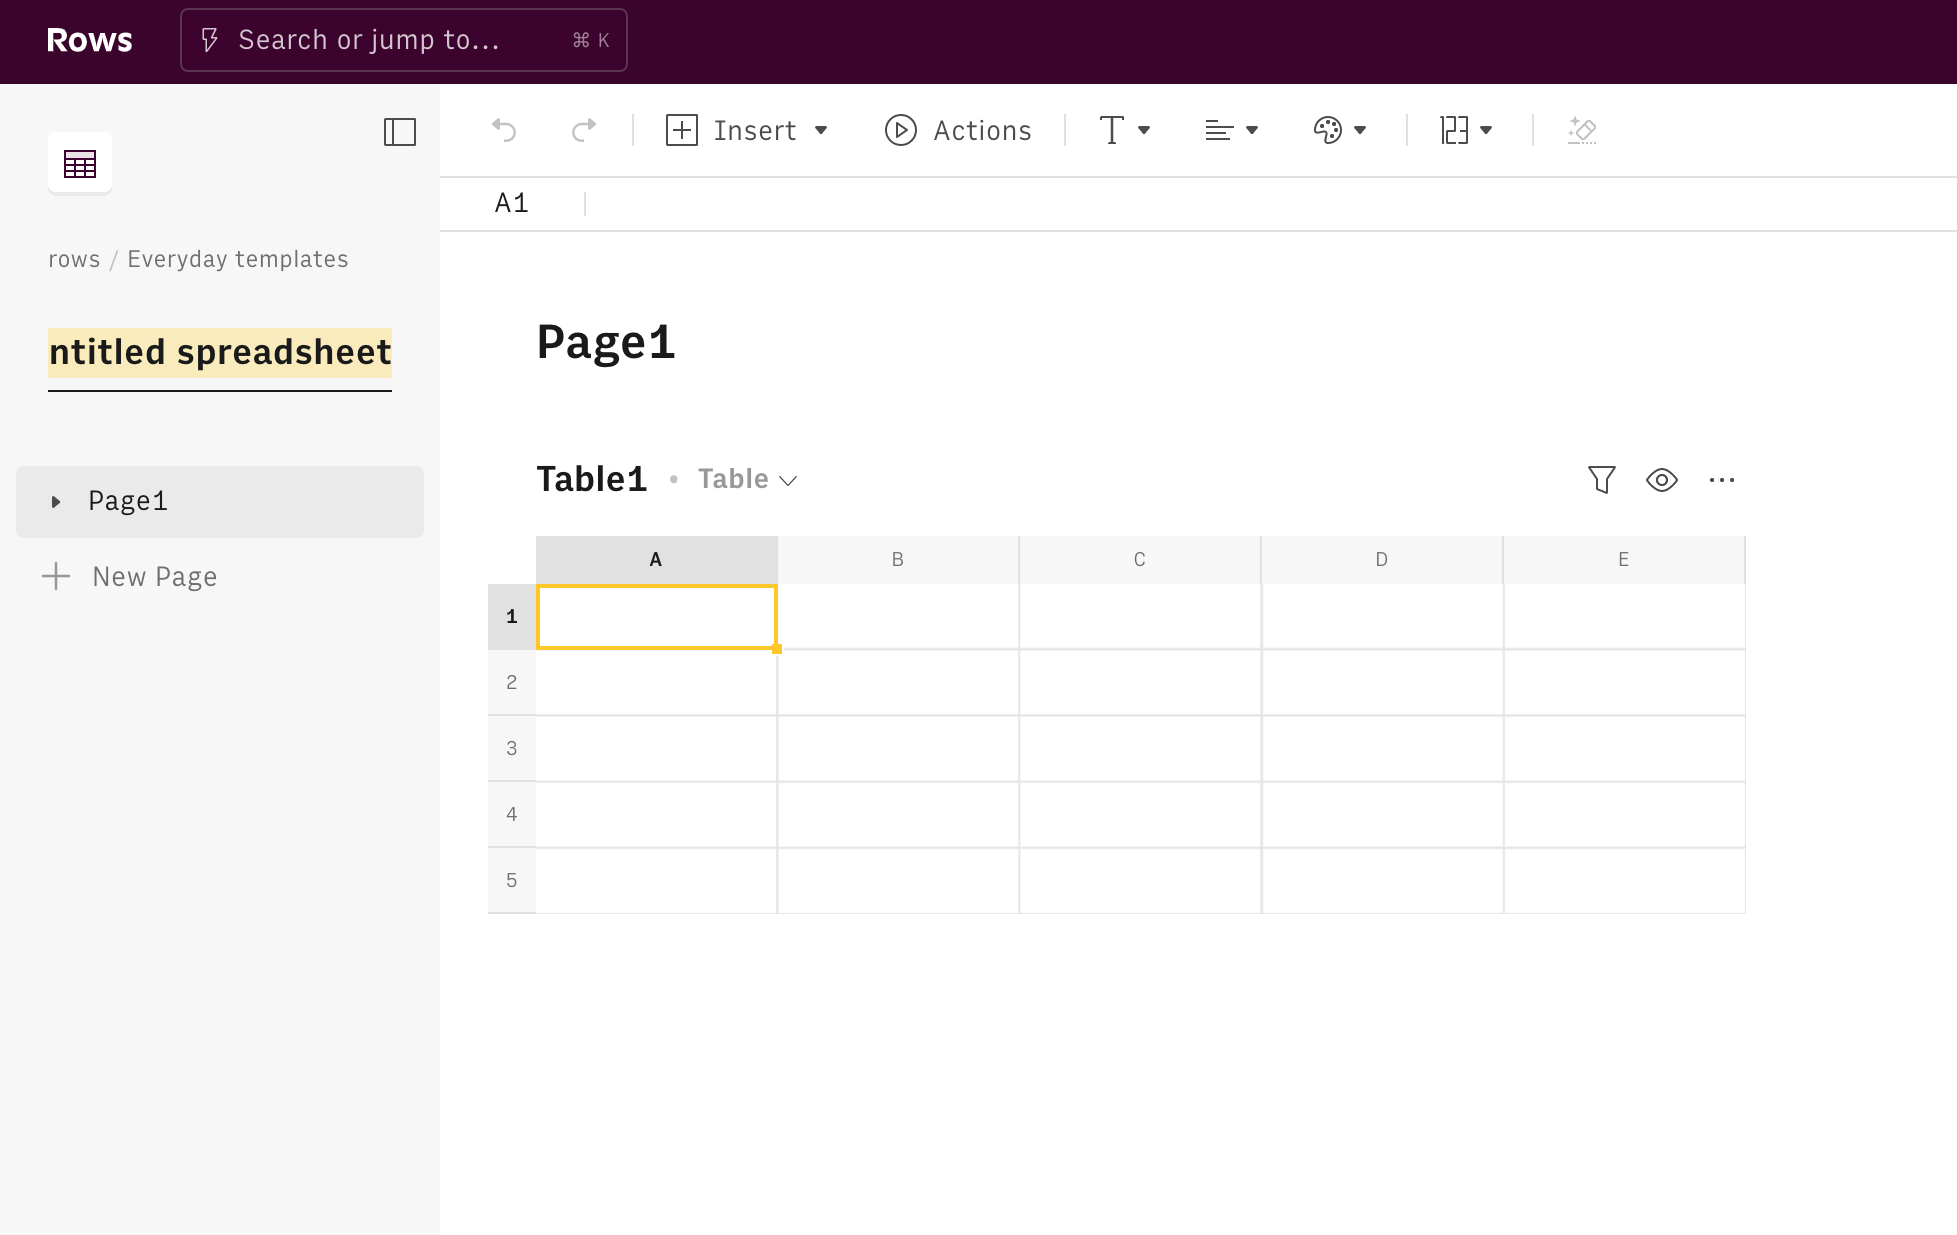
Now you are ready to build your report. Click on the Create spreadsheet button at the top of your dashboard.
Once you land on your spreadsheet, first of all, rename it: click on its title in the top left corner and type the new name. Use it also as a title for the first page, by pasting it on the page title. It'll be easier to find it later on.
Rows allows you to have multiple tables on the same page, giving you a neat view of your data. Select cell A1, and hit Actions in the toolbar. Look for our Google Analytics functions: many are available, depending on your ultimate goal, such as:
Get Ad campaigns data,
Get Ad groups data,
Get keywords data from Ads,
Get search queries data from AdsGet page metrics
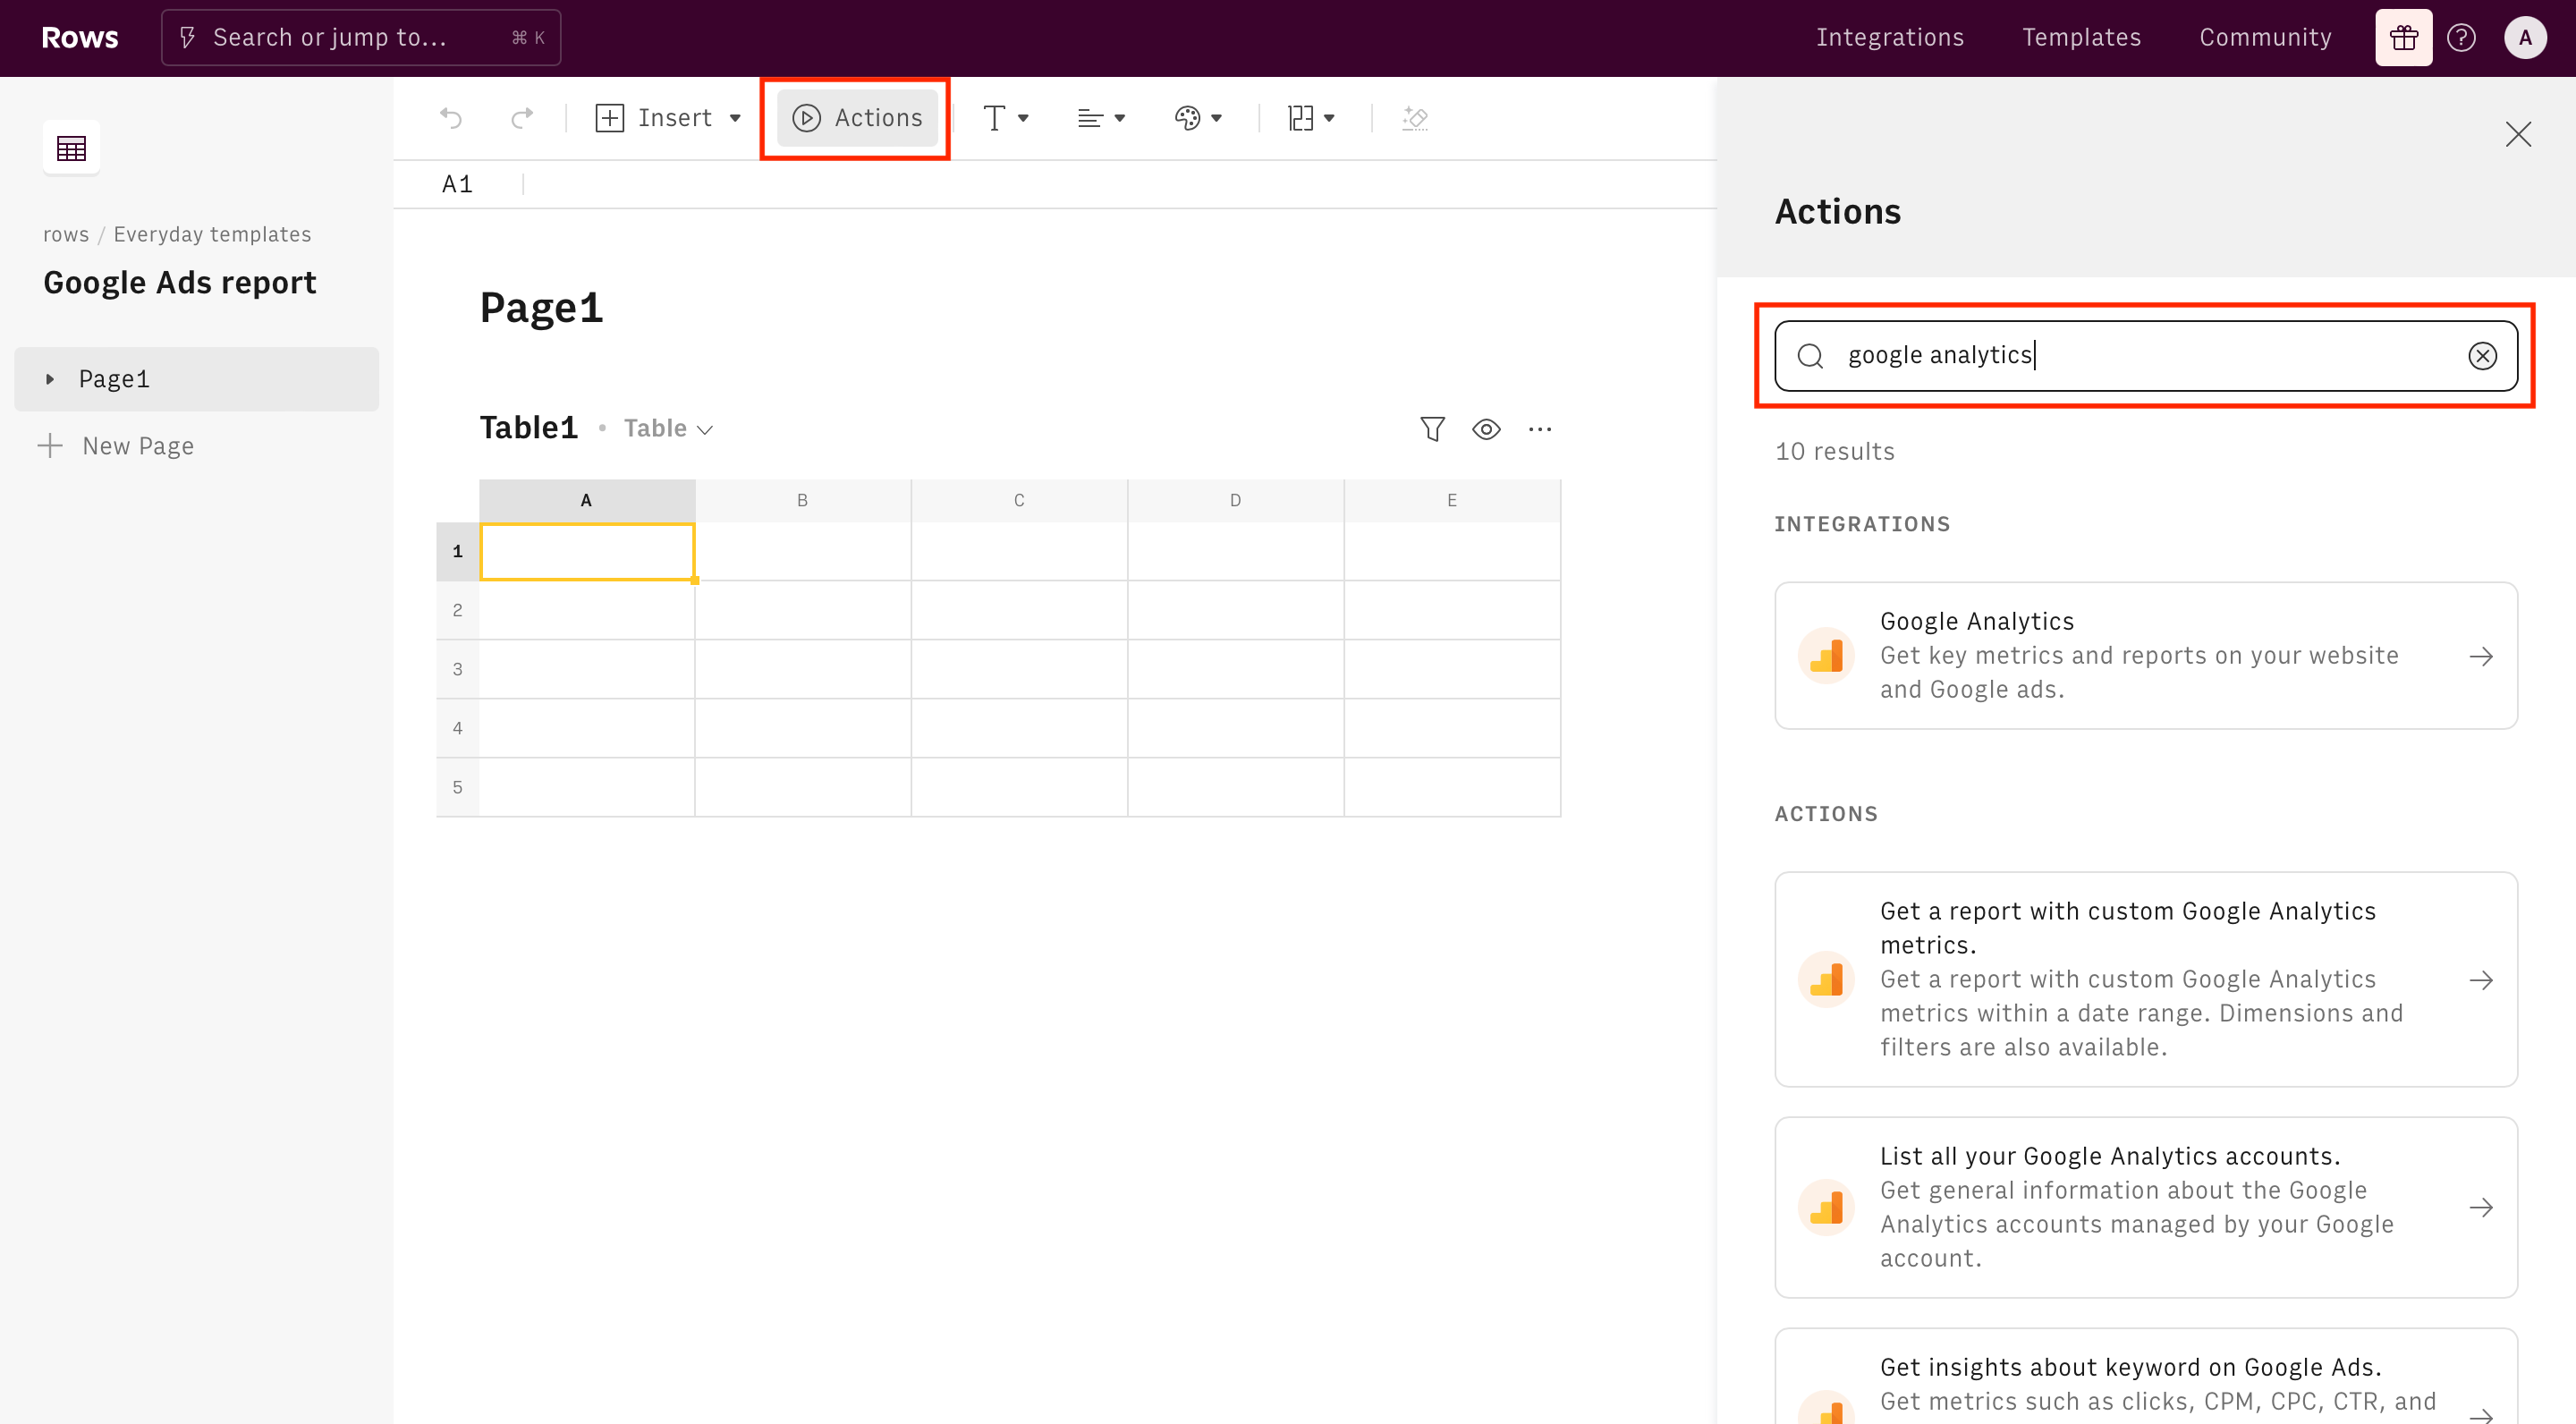
For the purpose of this guide, we will choose to retrieve data from campaigns and use Rows' Get Ad campaigns data function. The function wizard shows up on the right-hand side of your display. At the top, you can see the name of the integration you turned on in the first steps of this guide.
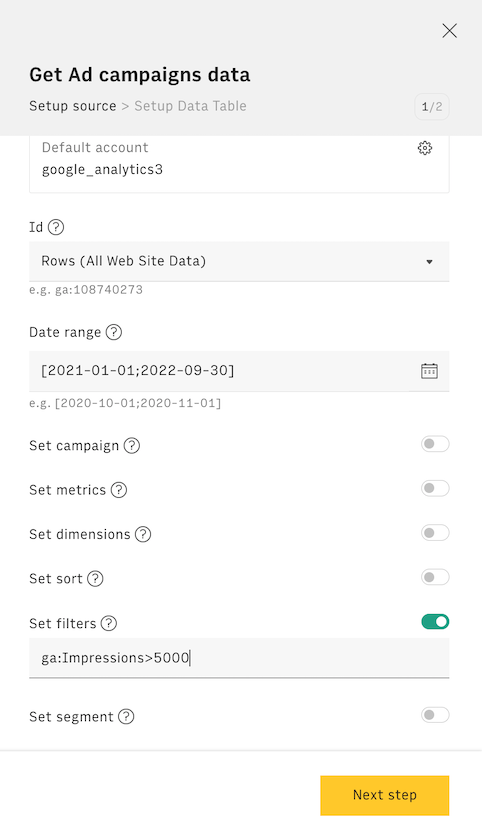
Let's go through the wizard together:
- Id. Pick your profile Id from the drop down list
- Date range. Use it to filter your data within the specified timeframe
- Set campaign. Use it to display campaign-specific data
- Set metrics. These are the key metrics you want to display in your report, such as pageViews, session, Average time on page, etc. If you leave it blank, Rows will pick automatically the most common KPIs. To know more, please have a look at Google metrics and dimensions explorer
- Set sort. Use it to sort entries in ascending or descending order according to a specific metric
- Set filter. Use it to filter only some results, i.e. only campaigns with more than 5,000 impressions
- Set dimensions. Set dimension to break down data, e.g. device, region or date
- Set segment. Filter for specific user segments
Clicking on Next step, Rows will guide you through the creation of the Data Table, that displays all data retrieved from the integration.
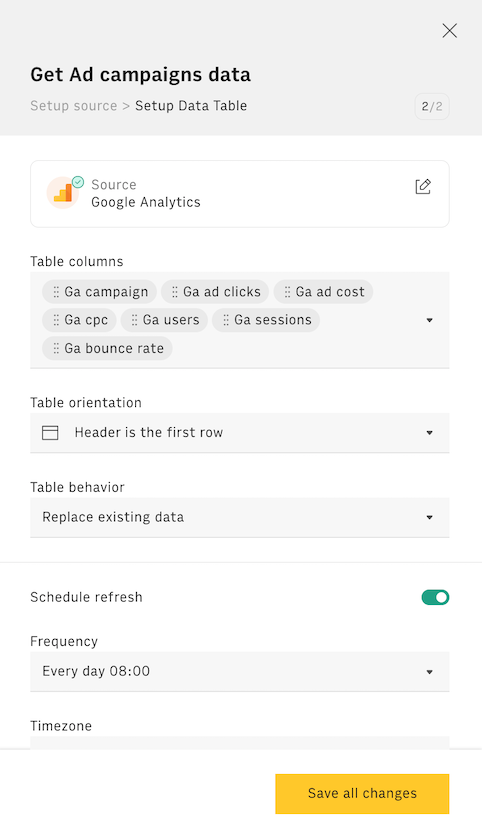
The first drop down includes all the table's columns, based on the metrics you picked in the previous step. You can also set a refresh schedule to make your table fetch new data automatically at a given frequency.
Once done, the table will appear immediately below the first one (that can be deleted for simplicity):
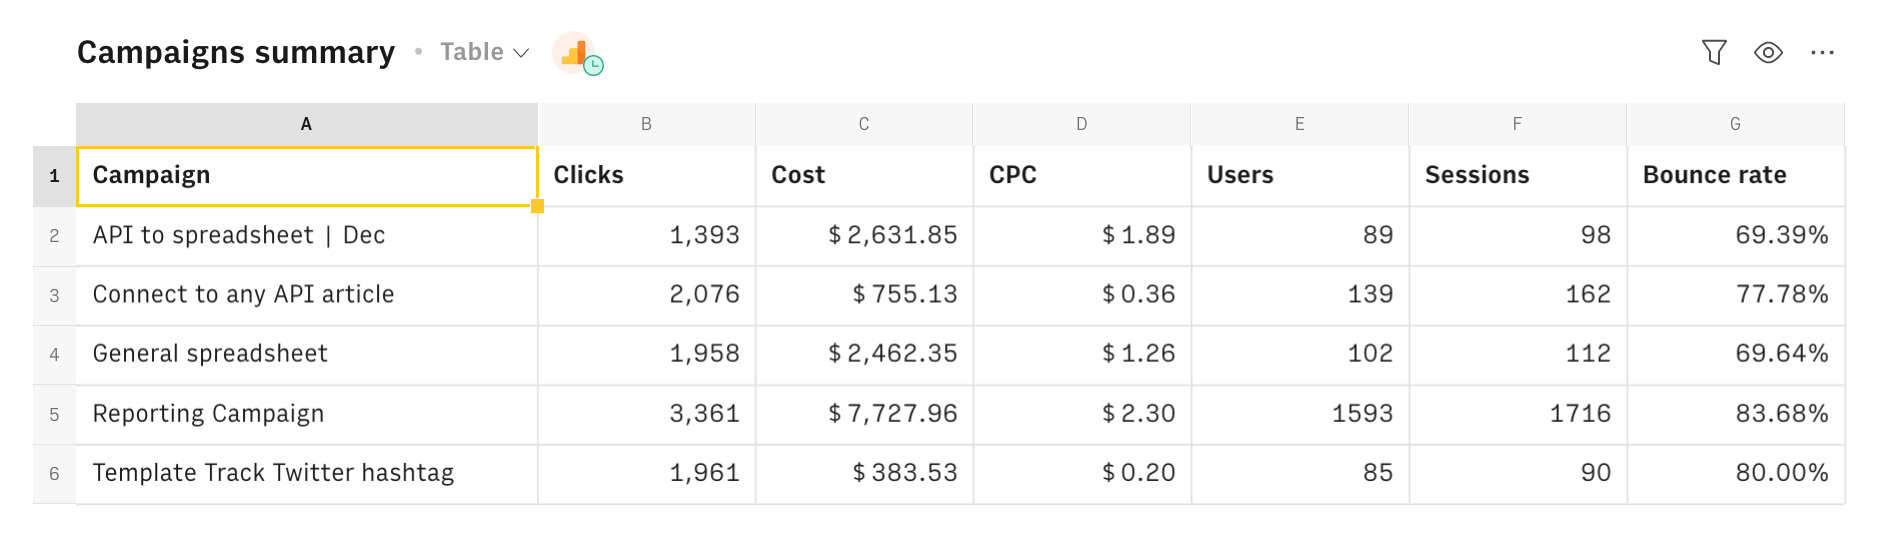
You can always rename the table's columns by simply clicking and editing the columns' headers. In case you need to reorder some of the table's columns, just select and drag them.
Adding a chart
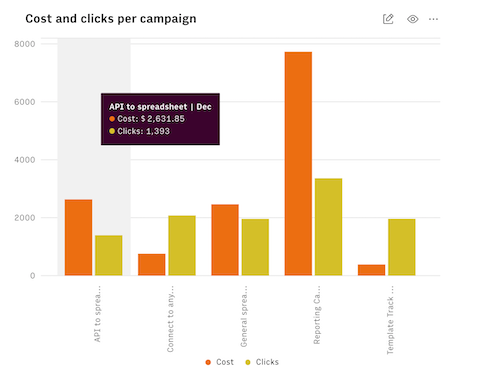
To make your report shine, add a bar chart to compare the main cost metrics across different campaigns, such as CPM and CPC. Select the whole Campaigns data table, then use the Insert menu and hit Chart.
Once done, a chart will be displayed below the last table: using the usual ... icon, you can customize it - adding or removing series, description, footnotes and changing series' colors:
Creating an ads keywords report
If you followed all the above points, you now have a summary table showing aggregated metrics for each campaign run in the selected time frame. You might also be interested in having a focus on how single keywords performed in the same time span. Let's build it together!
Select a cell in the first table, then hit the Actions menu and select our Get keywords data from Ads function. To configure it, as we did before, pick your ID and the time range. As we want to have an aggregate overview of the keyword performance, we should not filter for any specific campaign, ad group, or keyword.
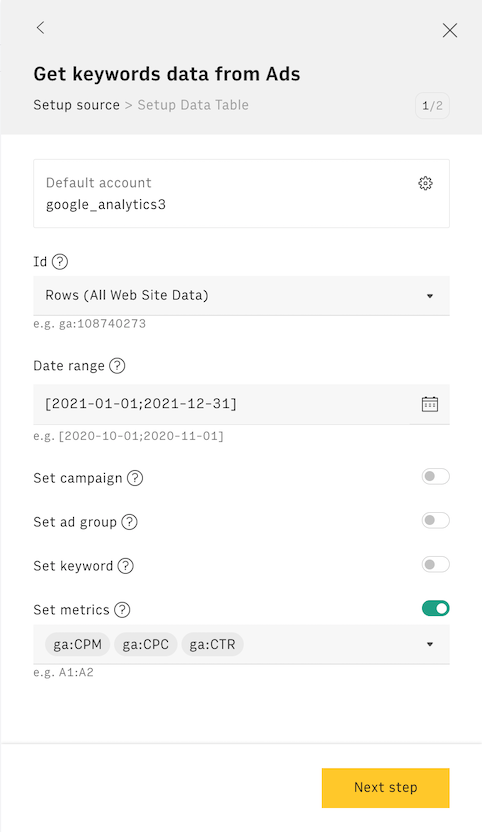
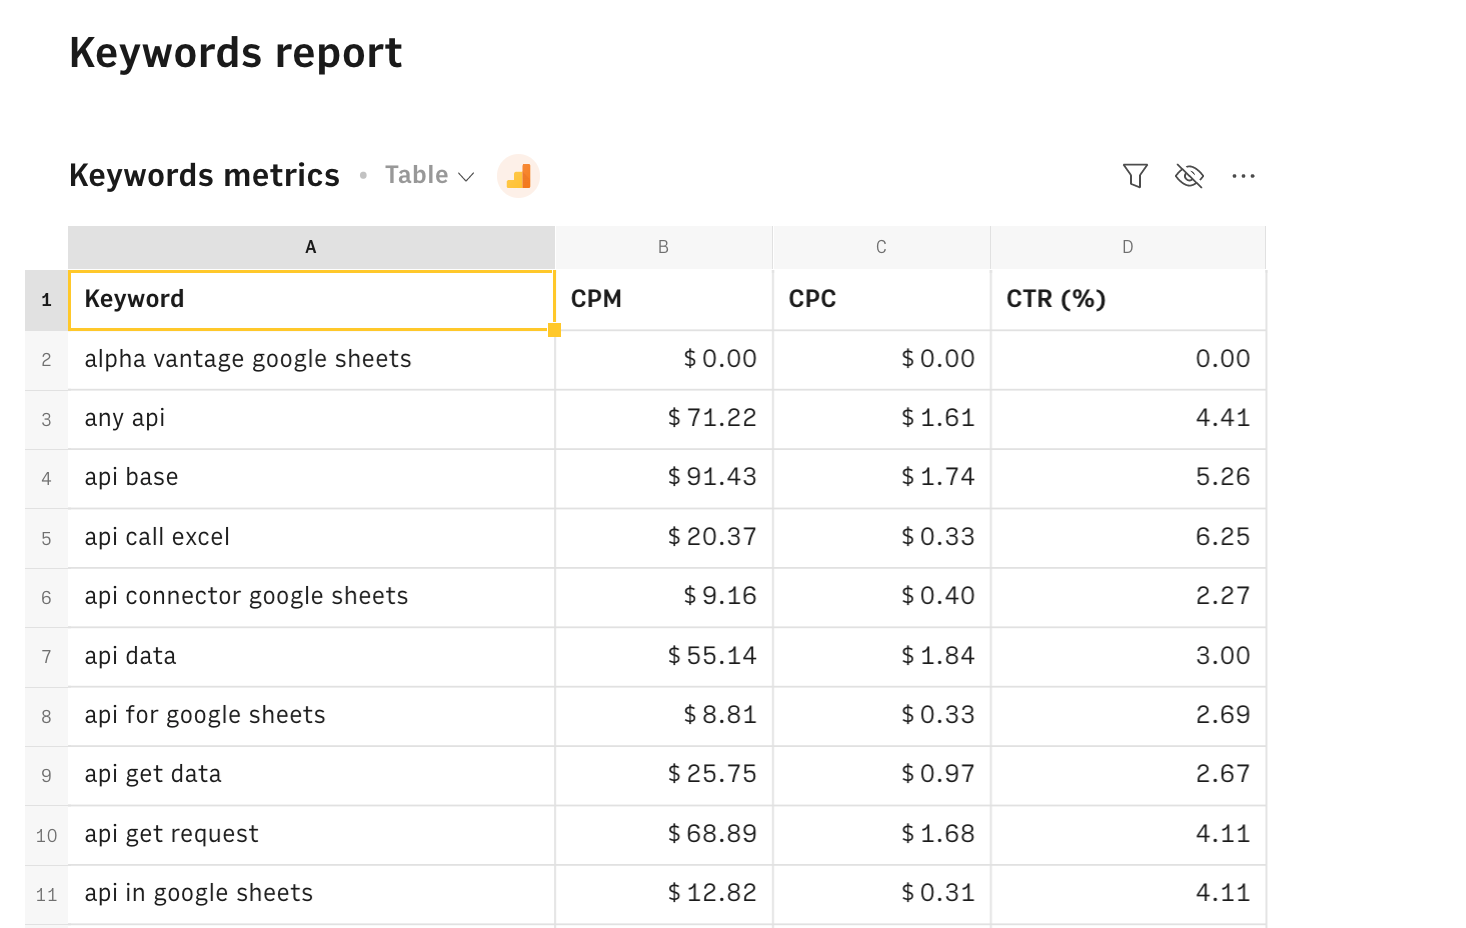
We follow the same procedure described above, and what we obtain is a list of keywords with their respective KPIs: CPM, CPC, and CTR.
Embed into documents
Finally, if you are using Notion or any other internal tools that support iframes to build a report, you can embed any table or chart of this spreadsheet in your document. Just click on the ... icon in the top right corner of any table or chart and pick Embed. A modal will open, as follows:
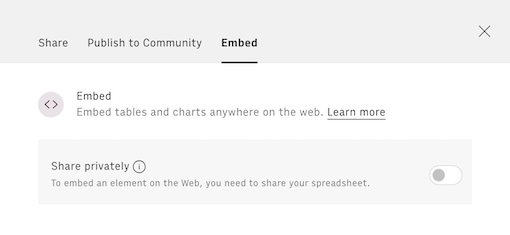
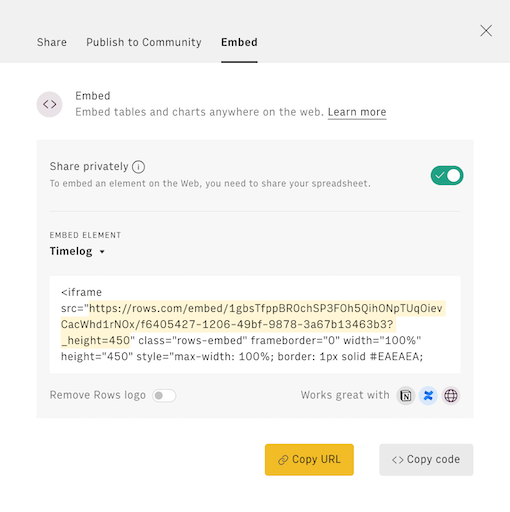
Before embedding, you need to grant access to it. To do so, toggle on the Share privately option and then hit the Copy URL button: your element is now ready to be pasted into your favorite tool.
This is how Rows Embed looks on Notion:
You might also like
Check also
Interested in performance marketing reports? Discover other guides:
- Setting up a Facebook/Instagram Ads report
- Setting up a Linkedin Ads report
- Building campaign tracking URLs
Discover our Marketing playbook.