Intro
Blogs are a major pillar of any content marketing strategy. Picking in-the-news topics and using a catchy tone of voice is key to ensuring readers’ engagement. However, doing it without looking at data is like driving closed eyes. Your blog activity must be paired with the right analytics, that help you understand how your audience is perceiving your content and optimize it consequently.
In this short guide, we’ll walk you through everything you need to create a report that tracks how well your blog generates traffic and potential leads for your product.
With Rows you can track your blog performance along the whole funnel, leveraging two powerful data connections: Google Analytics and Search Console. All in a spreadsheet.
This is a sneak peek of what you will get:

How Google lets you monitor the whole user funnel
Google offers two main tools that help you track the performance of your blog.
Search Console helps you troubleshoot any website’s appearance among search results, and monitor the main search metrics, such as impressions, clicks, and average position in SERP. We may call it "the top of the funnel" (TOFU)
Analytics tracks the behavior of users, once they landed on any website: page views, time spent, conversion rates, and custom goals (e.g. add to cart, purchases, ...). We may call it "the bottom of the funnel" (BOFU)
Analyzing the top of the funnel
Use our template at the following link Blog search performance report and save it in one of your workspace's folders.
This template allows you to monitor the search performance of any page of your website, i.e. how your website behaves in Google's SERP, the Search engine result page, in terms of impressions, clicks, and position.
Let's reverse-engineer it together.
First of all, you need to enable the data connection and connect your Google Search Console account to Rows. Click on the top modal and then follow the instructions. The typical Google Auth page will open: enter your credentials and authorize Rows to retrieve your data. Make sure your website is correctly registered in your Google Search Console.
Now you are back on the spreadsheet, ready to set it up. Enter the domain of the website you want to examine, pick the type of property, Domain or URL, as it has been registered in Search Console, as well as the time frame you want to search in

The "Posts insights" table is designed to show the insight for a single blog post. Column B ecloses our proprietary GET_WEBSITE_PERFORMANCE_SEARCH_CONSOLE() function, which pulls data from Google Search Console in the specified date range, using the blog post URL as dimension.
Let's have a closer look at it together. Click on the ... icon in the cell and choose Edit function. A panel will open on the right end side.
The function's inputs are:
- Domain or URL of the property defined in Google Search Console
- The target type of the property, domain, or URL
- Date range
- Dimensions, to group the performance metrics by, such as "country" or "page" Check the GCS documentation for further info.
- Filter the performance metrics of a specific value of the picked dimension, for example: "country contains USA"
Of the function's arguments, "page" represents the dimension and the filter includes the URLs in column A.
1 =GET_WEBSITE_PERFORMANCE_SEARCH_CONSOLE('Setup'!$B$1,'Setup'!$B$2,'Setup'!$B$3,"page","page","equals",A2)Paste your blog URLs in column A: impressions, clicks, CTR, and an average position will be filled in the respective columns.

Analyzing the bottom of the funnel
Now that we monitor the top of the funnel, we are ready to track how people behave once they landed on your blog.
Use our template at the following link Blog analytics report and save it in one of your workspace's folders.
To enable the data connection, you need to connect your Google Analytics account to Rows. As we did with the previous template, click on the top modal and then follow the instructions. A Google Auth page will open, enter your credentials and authorize Rows to retrieve your data.
Start by entering the Analytics ID of your website, and the time frame you want to examine.
To get it, use our LIST_ACCOUNTS_ANALYTICS_GOOGLE() function: open the Actions menu and input the name in the search bar. Once found under the Actions section, click on it and follow the instructions: since the function does not require any argument, you can move on by simply clicking on the button "Next step". A prompt will show the data loading process and Rows will start creating a table below the first one, named "Google Analytics", to enclose the function output.
On the right-hand side, a wizard will walk you through the table creation. As a table header, pick profiles.id under the WebProperties submenu. The table destination field is automatically filled with the first cell of the new table, 'Google Analytics'!A1. Click on the button 'Create a table' and all names associated with your Google Analytics accounts will show up in

Similarly to the previous template, the "Analytics insights" table is designed to show the insights for any blog posts. Column B ecloses our proprietary PAGE_ANALYTICS_GOOGLE() function, which pulls data from Google Analytics in the chosen date range, using the RELATIVE_URL() of the blog post as dimension, as follows:
1 =PAGE_ANALYTICS_GOOGLE('Setup'!$B$1,'Setup'!$B$2,RELATIVE_URL(A2))Type your blog URLs in column A: page views, pages per session, average time on page, and Exit rate will be fetched automatically through our AUTOFILL() functions in the table header. AUTOFILL() should always be put in the header, i.e. the first row of any table and works through the following arguments: the first one is the column title, the second one is the function you want the column to be filled with. In this case, the PARSE() function that allows you to read and extract data from the PAGE_ANALYTICS_GOOGLE() cells.

Finally, a chart will help you visualize the most relevant metrics per post. To create it, select the entire Analytics insight table, and click on Insert - Chart in the toolbar. To customize it, click on the "..." icon in the top right corner and choose "Edit chart". A panel will open from the right-hand side, where you are able to customize series, axis titles, and colors.

Embed into documents
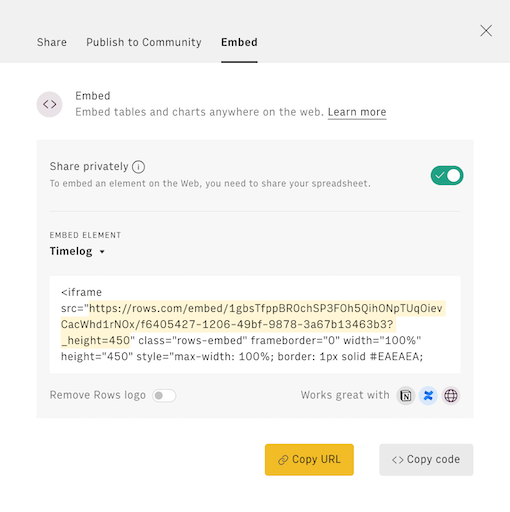
Finally, if you are using Notion or any other internal tools that support iframes to build a report, you can embed any table or chart of this spreadsheet in your document. Just click on the ... icon in the top right corner of any table or chart and pick Embed. A modal will open, as follows:
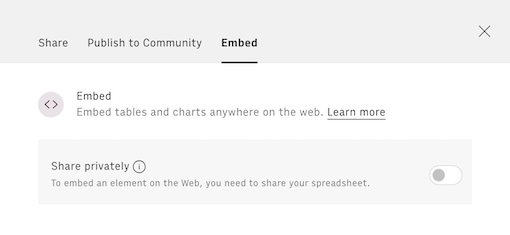
Before embedding, you need to grant access to it. To do so, toggle on the Share privately option and then hit the Copy URL button: your element is now ready to be pasted into your favorite tool.
This is how Rows embed looks on Notion:

You may also like
Check also
Interested in content marketing and SEO? Check out our guides:
- Track keyword performance with Search Console
- Track your on-page SEO content elements
- Monitor your website search performance with Search Console
Discover our Marketing playbook.