2023 W28 - The Excel Antidote


Every week I post about one thing that happened at Rows. We're building in public!
--
One question that we get from investors and other founders is: What about Microsoft Excel?
That question includes a few sub-questions:
Can't they also ship what you are shipping?
How will you differentiate from them?
Aren't you afraid of them?
The answer is in a small thing we shipped last week: Descriptions and Footnotes.
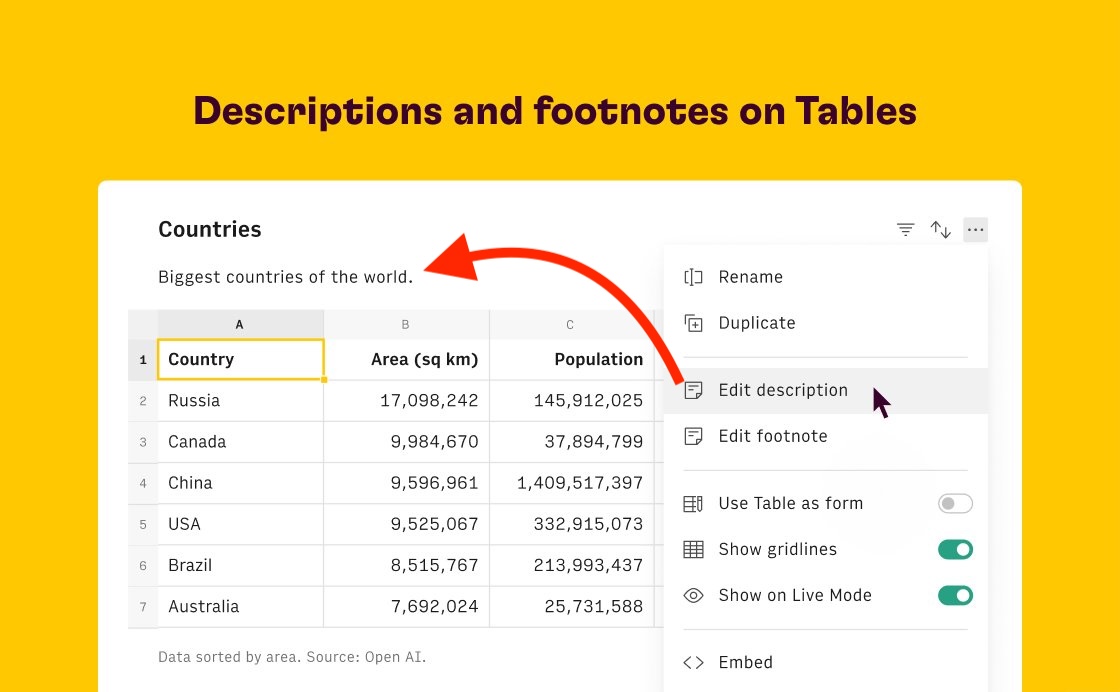 Here's how you add Descriptions or Footnotes to a Table.
Descriptions and Footnotes are small elements that help you describe Charts and Tables.
Descriptions sit on top of a Table or Chart, and Footnotes, well, on the bottom. They are super useful to add conclusions, call outs, or clarifications on data.
AFAIK, we're the first full spreadsheet to support them throughout the interface.
We took the decision to support them way back when we decided that spreadsheets needed a more flexible layout to organize information. If you want just 1 gigantic Table per page, you can have it. More often than not though, you will want to juxtapose Tables and Charts to tell a story. This philosophy scales to other future elements we may want to add, too!
This gives us 3 advantages:
It's not easily copyable. Excel and Sheets don't have the concept of layered Tables, and so where will you write a footer or a description? on another cell, which may be accidentally written over? To do that, they'd have to change the UI overnight for hundreds of millions of users who signed up for another experience.
It's easy to integrate in other feature flows. When users get insights from our AI Analyst✨, now they have a place to add them: in the Descriptions and Footers of Tables and Charts! We think the alternatives are worse, as your AI results should not be stuck inside a side panel! We will be exploring this a lot more in the near future!
It makes docs more pleasant. Our children always look beautiful to us, but in this case (cof) I think we aren't exaggerating when we say our spreadsheet is already slicker than others. With these small elements, we will keep distinguishing ourselves in the looks department.
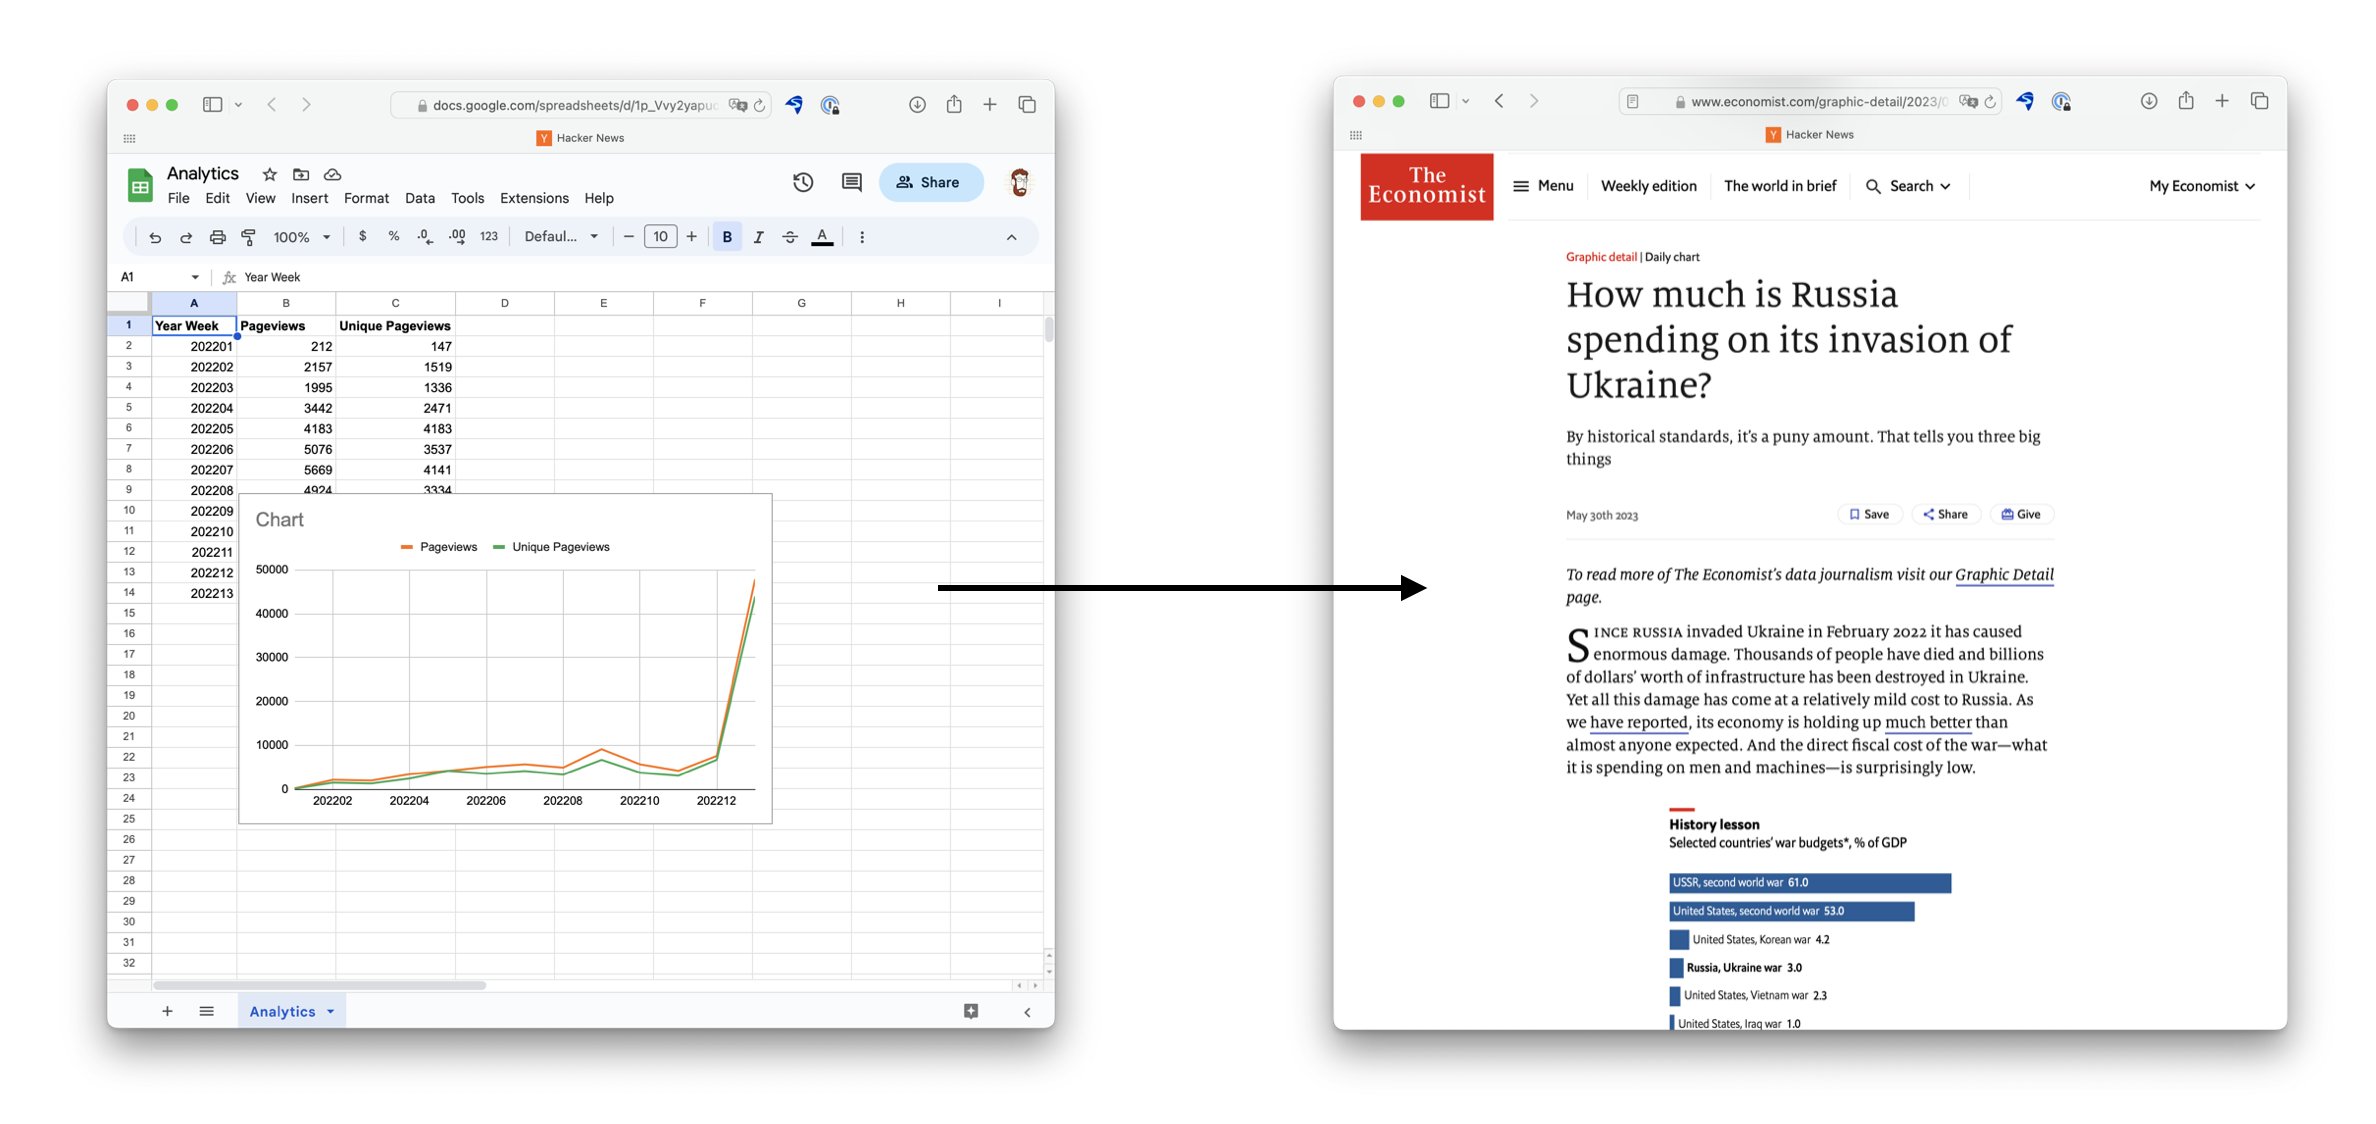 From rags to riches. We will stop only when we take your spreadsheets from an old assortment of cells to an article worthy of The Economist.
-
This small feature is not the only Excel (and Sheets) antidote. There are plenty of unique elements to each product, and a few of them are hard to replace! A few examples:
Our live mode, where spreadsheets are easy to read and there's no accidental inputs.
Our data agnostic sources, which out of the box feature Google (Analytics, BigQuery), Amazon (Redshift), independent giants (Snowflake), custom solutions (API, Postgres, MySQL) and more.. including connectors for Looker, PowerBI (soon), Make, Zapier etc.
Embeds anywhere: Our embeds are interactive, and easy to generate - also bc of the table and Charts layout.
All in all, last week was a good one. We made ourselves 1% more differentiated, and that makes VERY unique. See you next week
- H PS: to that 3rd question in the beginning. No, we're never afraid!