How to Create and use Pivot Tables in Google Sheets [2025]

How do you turn a busy spreadsheet into a bit-sized table summary that is easy to understand and use?
The answer is simple: Create a pivot table in Google Sheets.
By doing this, you can quickly draw conclusions from a massive amount of data, automatically execute complex calculations, and easily rearrange data views to explore different perspectives.
In this guide, we'll explain everything you need to know about creating and using a pivot table in Google Sheets.
What is a Pivot Table in Google Sheets?
A pivot table in Google Sheets is a pivot table in Google is a dynamic data analysis tool that transforms raw data into meaningful summaries.
Imagine having a spreadsheet with thousands of sales records. A pivot table can instantly show you total sales by product, region, or date range, allowing you to gain insights that would be time-consuming to extract manually.
Definition of Pivot Table
A pivot table is a data summarization tool used in data processing and statistical analysis. It's an important feature in spreadsheet applications and business intelligence software like Microsoft Excel, Rows.com, and Google Sheets.
When compared to other tools, the pivot table poses many unique features. For example:
Unlike standard tables, pivot tables can dynamically adjust as the data changes.
Unlike filters, which only hide/show existing data without automatic summarization, pivot tables summarise while filtering and aggregating data.
Unlike VLOOKUP/HLOOKUP, which is limited to two-dimensional lookups and more complex formulas, pivot tables offer a multidimensional analysis that is easier to use.

Automate data pivoting with AI
Use AI to automate your data analysis. Ask any question about your dataset, extract key insights, create pivot tables in one click.
Try Rows for FreeImportance of Pivot Tables
Depending on your project types, pivot tables can help you get additional insights from your company's data.
Below are three vital benefits of pivot tables:
Data analysis: Extracting vital insights from a data pool can become overwhelming, but a pivot table quickly summarizes large amounts of data without complex formulas.
Efficiency: Pivot tables automatically aggregate data, eliminating the need for manual calculations or the creation of multiple individual reports. This is particularly useful for businesses that need to generate recurring reports. Pivot tables drive better-informed marketing decisions.
Versatility: Whether dealing with numerical data, text, or dates, pivot tables can be customized to fit various needs. For example, it can represent hierarchical structures, allowing for drill-down and roll-up analysis.
Why Use Pivot Tables in Google Sheets? Benefits of Using Pivot Tables
Data summarization: Pivot tables can instantly summarize thousands or even millions of rows of data into a concise, meaningful format. This is especially useful for users who need to condense thousands of rows of data into a more manageable format.
Dynamic updates: There's always new data, so as the original dataset changes, pivot tables can be updated with a single click, ensuring the summary always reflects the most current information. This ensures that the summarized data is always current and has accurate insights.
Customization: You can easily drag and drop fields to change the table structure, experimenting with different data views. For example, you can change the layout, apply filters, and use different summary functions to tailor the pivot table to their requirements.
Real-World Applications
There are numerous applications of pivot tables, from business, healthcare, academic research to personal use cases. Let's take a look:
Business analytics: For instance, a sales manager might use a pivot table to see which products are performing best in different regions quickly. A marketing manager can create a pivot table to compare content performance across social media channels.
Academic research: Students and researchers can quickly summarize responses from a survey and identify patterns in large datasets.
Personal use: Individuals can categorize and analyze their spending habits. For example, a person might use a pivot table to track their monthly expenses and identify areas where they can save money.
How to Create a Pivot Table in Google Sheets (Step-by-Step Guide)
Step 1: Preparing Your Data
Preparing your data correctly is the first step in creating a pivot table in Google Sheets. Below are a few steps to follow:
Data organization: Firstly, arrange your data in a structured table format with clear rows and columns. Something like this:
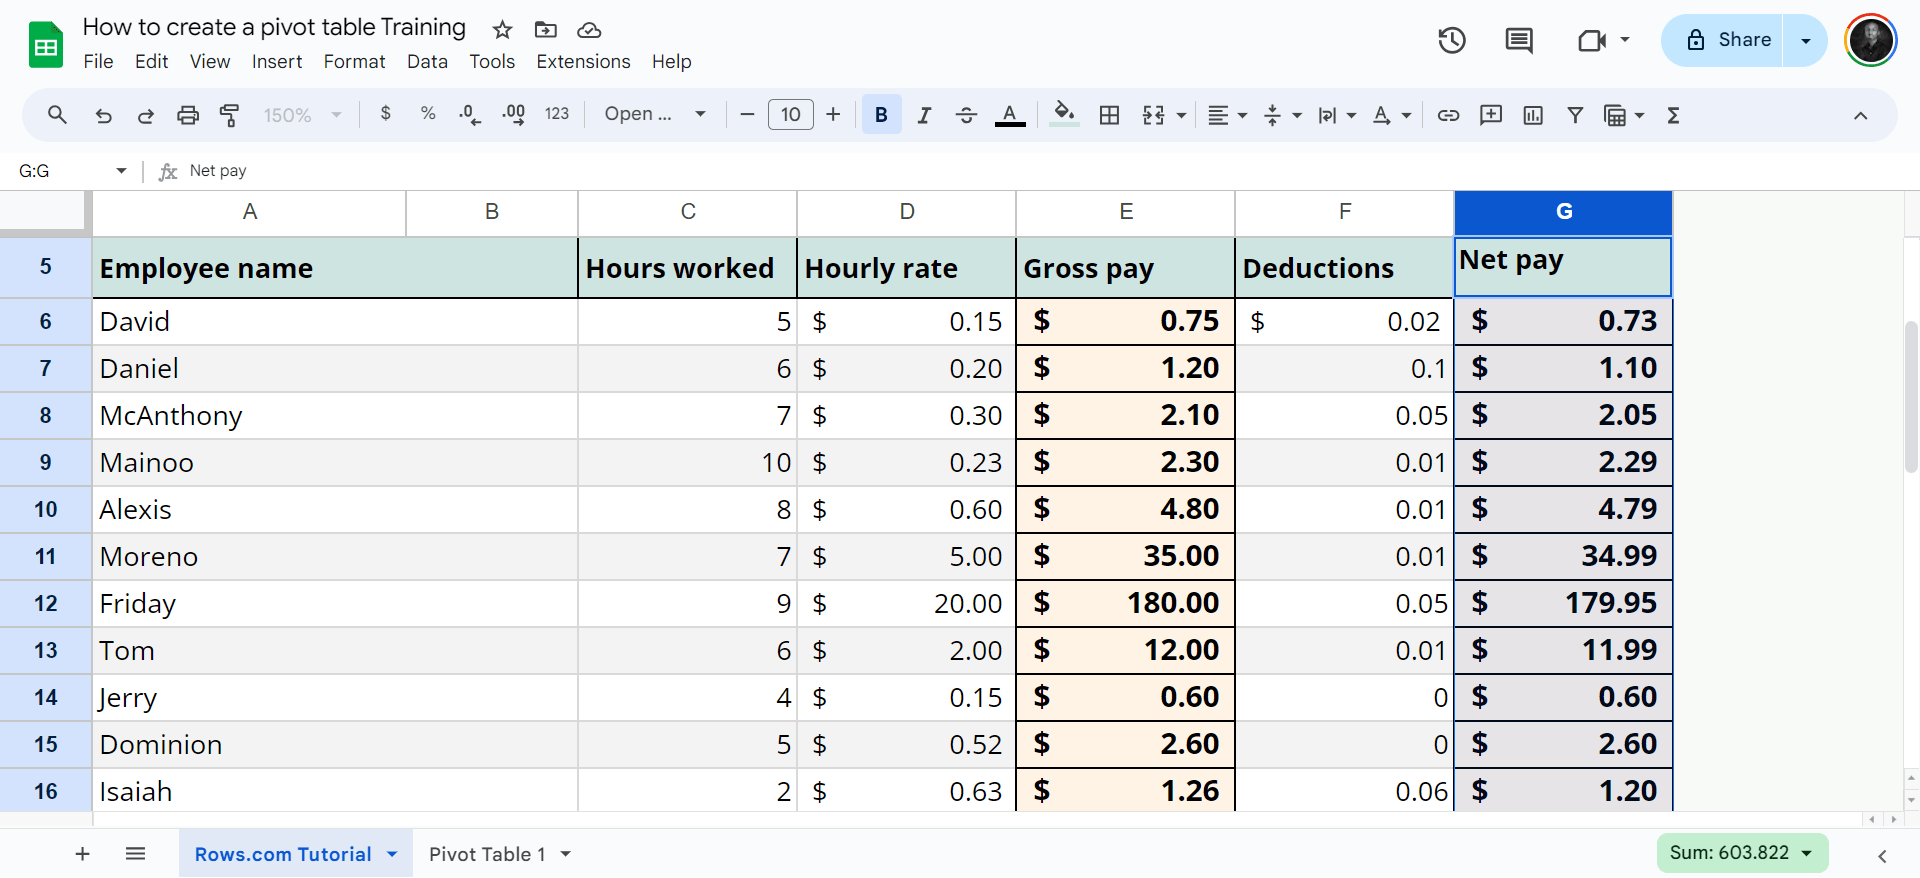
Pro tip💡: Ensure each column has a header and the data is consistently formatted to fit the pivot table layout.
Removing blanks: Blank cells can cause errors or incomplete summaries in the pivot table. It can also distort the cell limit. So, remove any completely blank rows within your dataset.
Ensuring consistency: You'd have incorrect summaries and analyses without a consistent arrangement.
Step 2: Creating the Pivot Table
Accessing the pivot table feature is easy; follow the steps below:
Open a Google spreadsheet in your Google Sheets
Click “Ctrl-A" on your Mac or Windows to select all the cells with data you want to use in your pivot table.
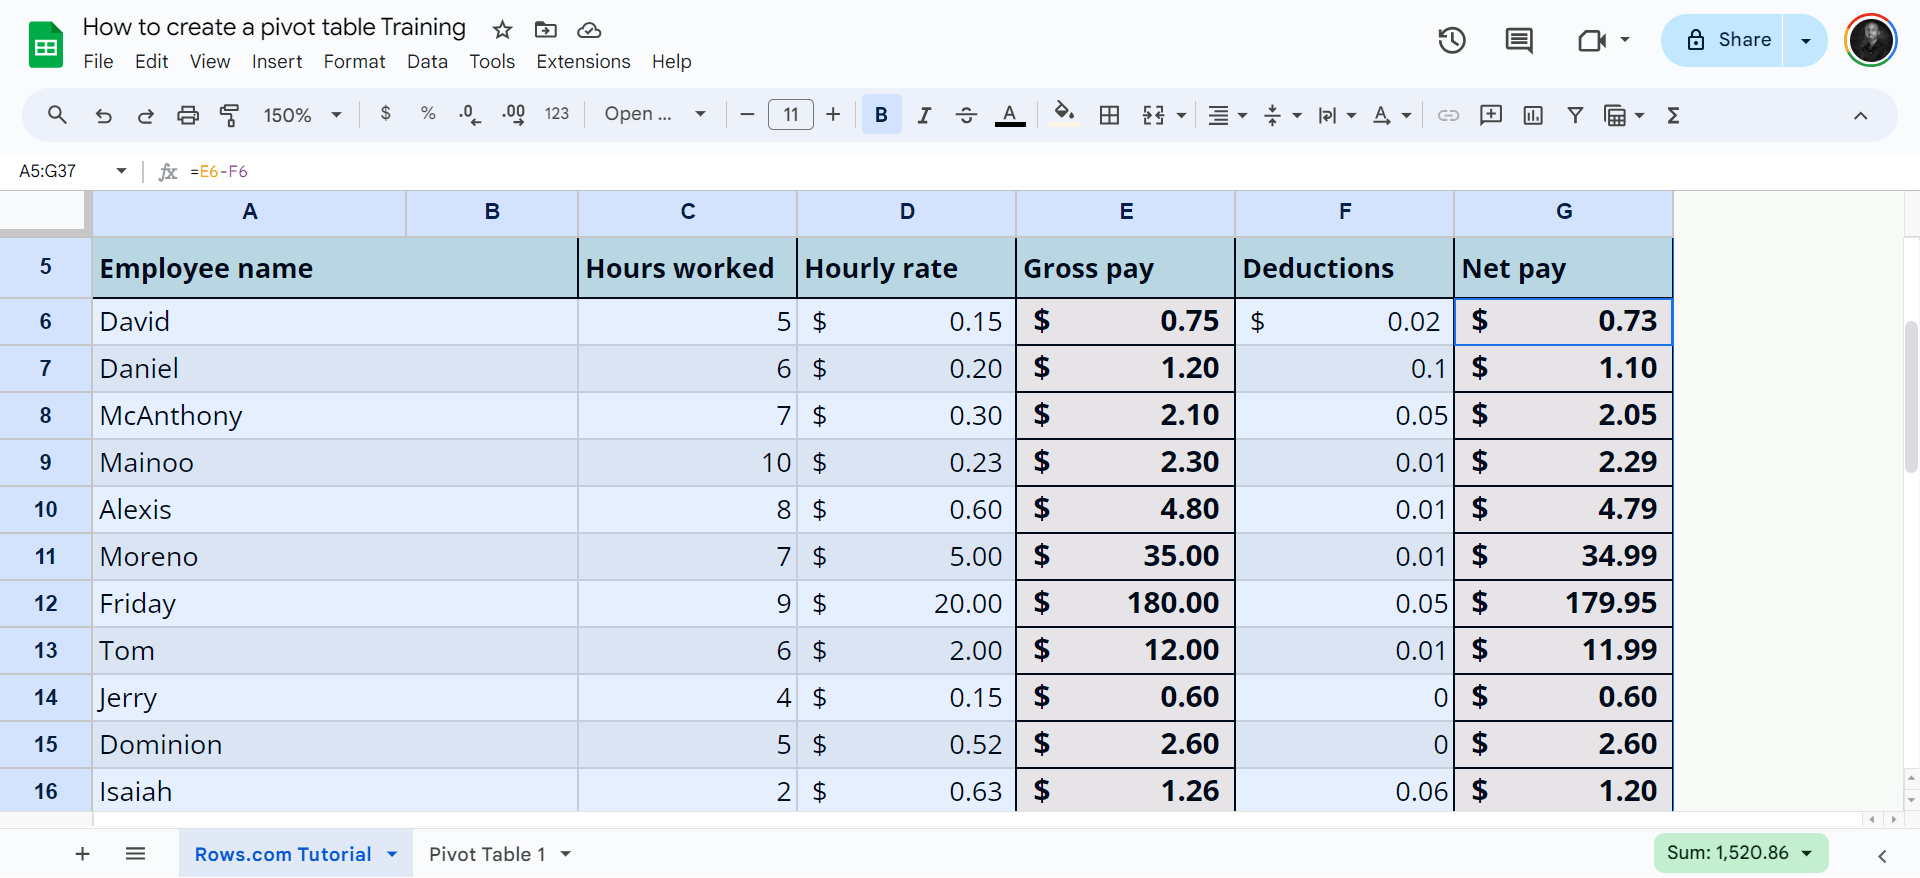
Pro tip💡: Before you click insert, highlight all relevant data you want to be included in the pivot table to avoid extraneous information and errors.
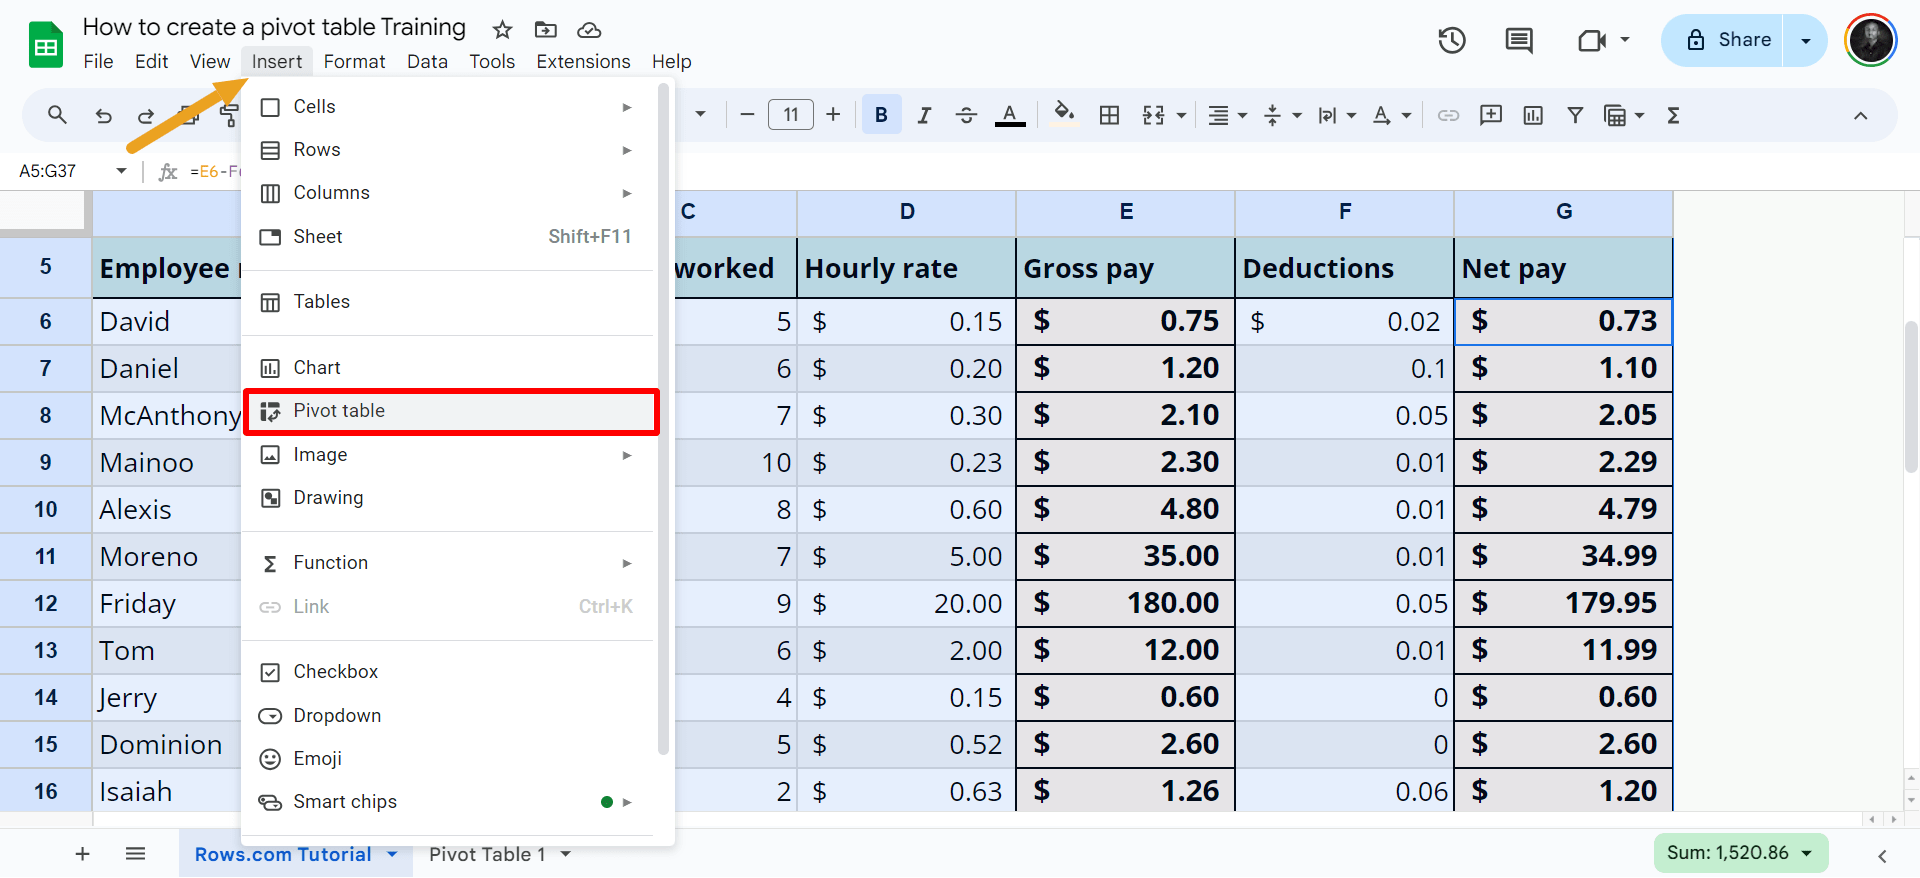
Then click Insert and select Pivot Table.
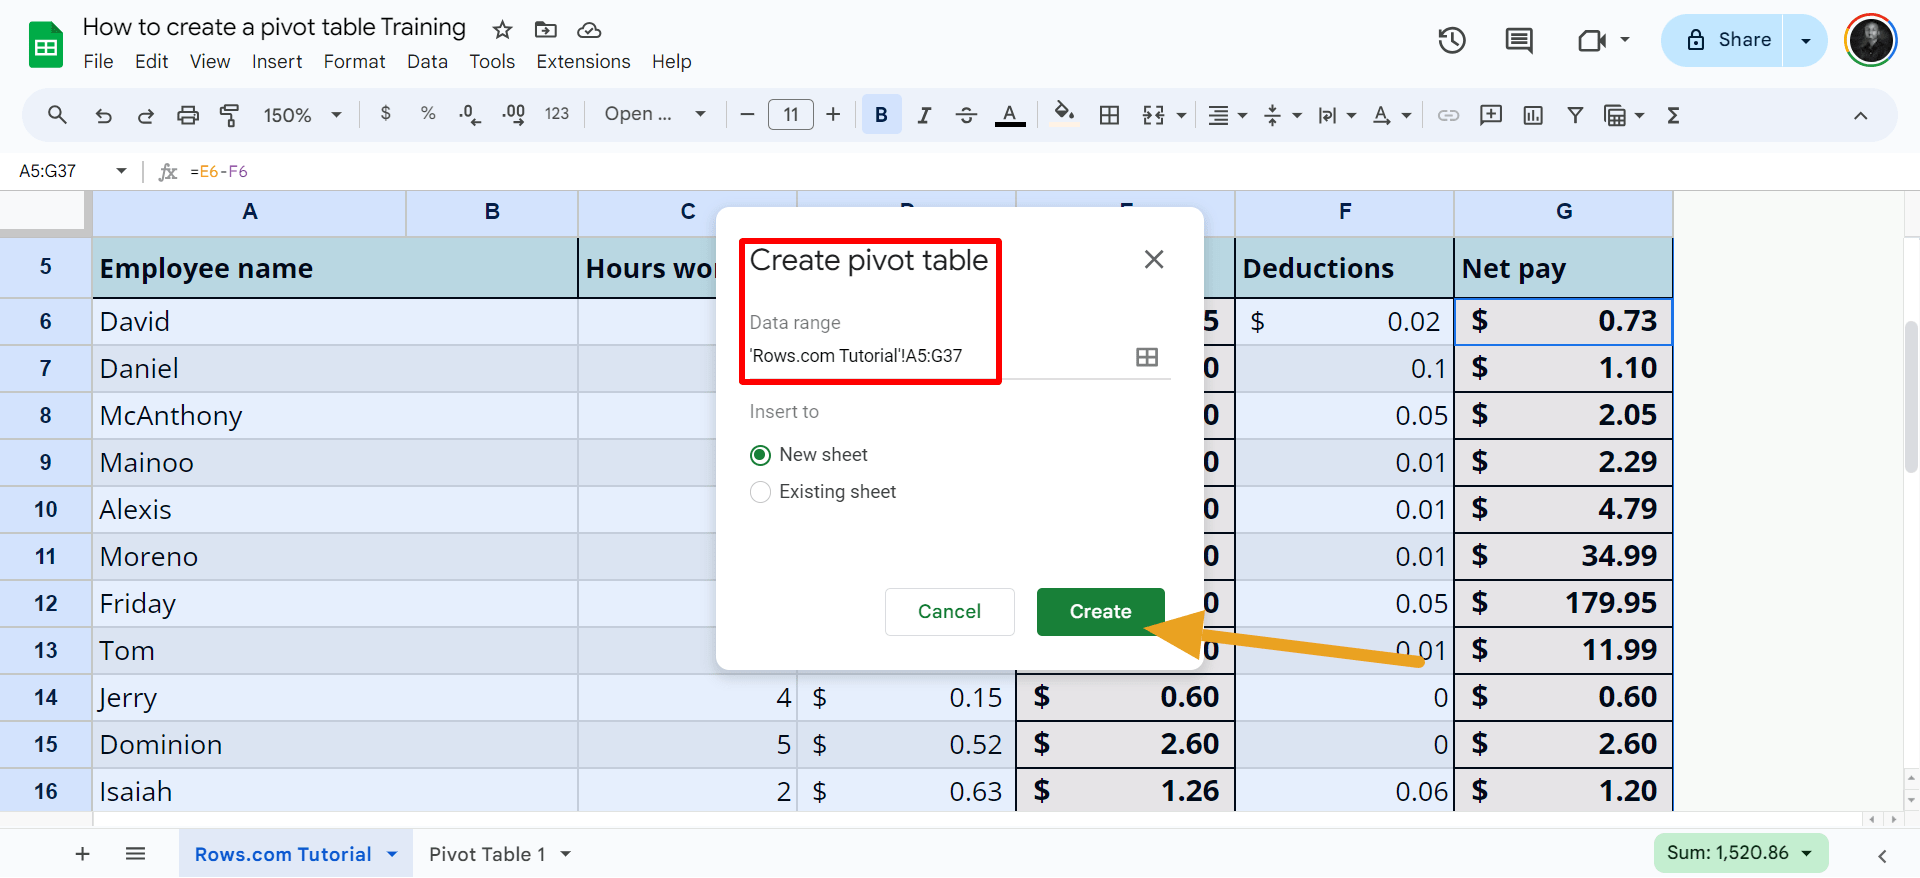
You'll see a "create pivot table" pop-up. It's automatically set to "new sheet," so you don't have to worry unless you want the pivot table on an existing spreadsheet. Afterwards, click Create.
You'll see the pivot table editor panel. And below is a screenshot of how your pivot table will look at first.
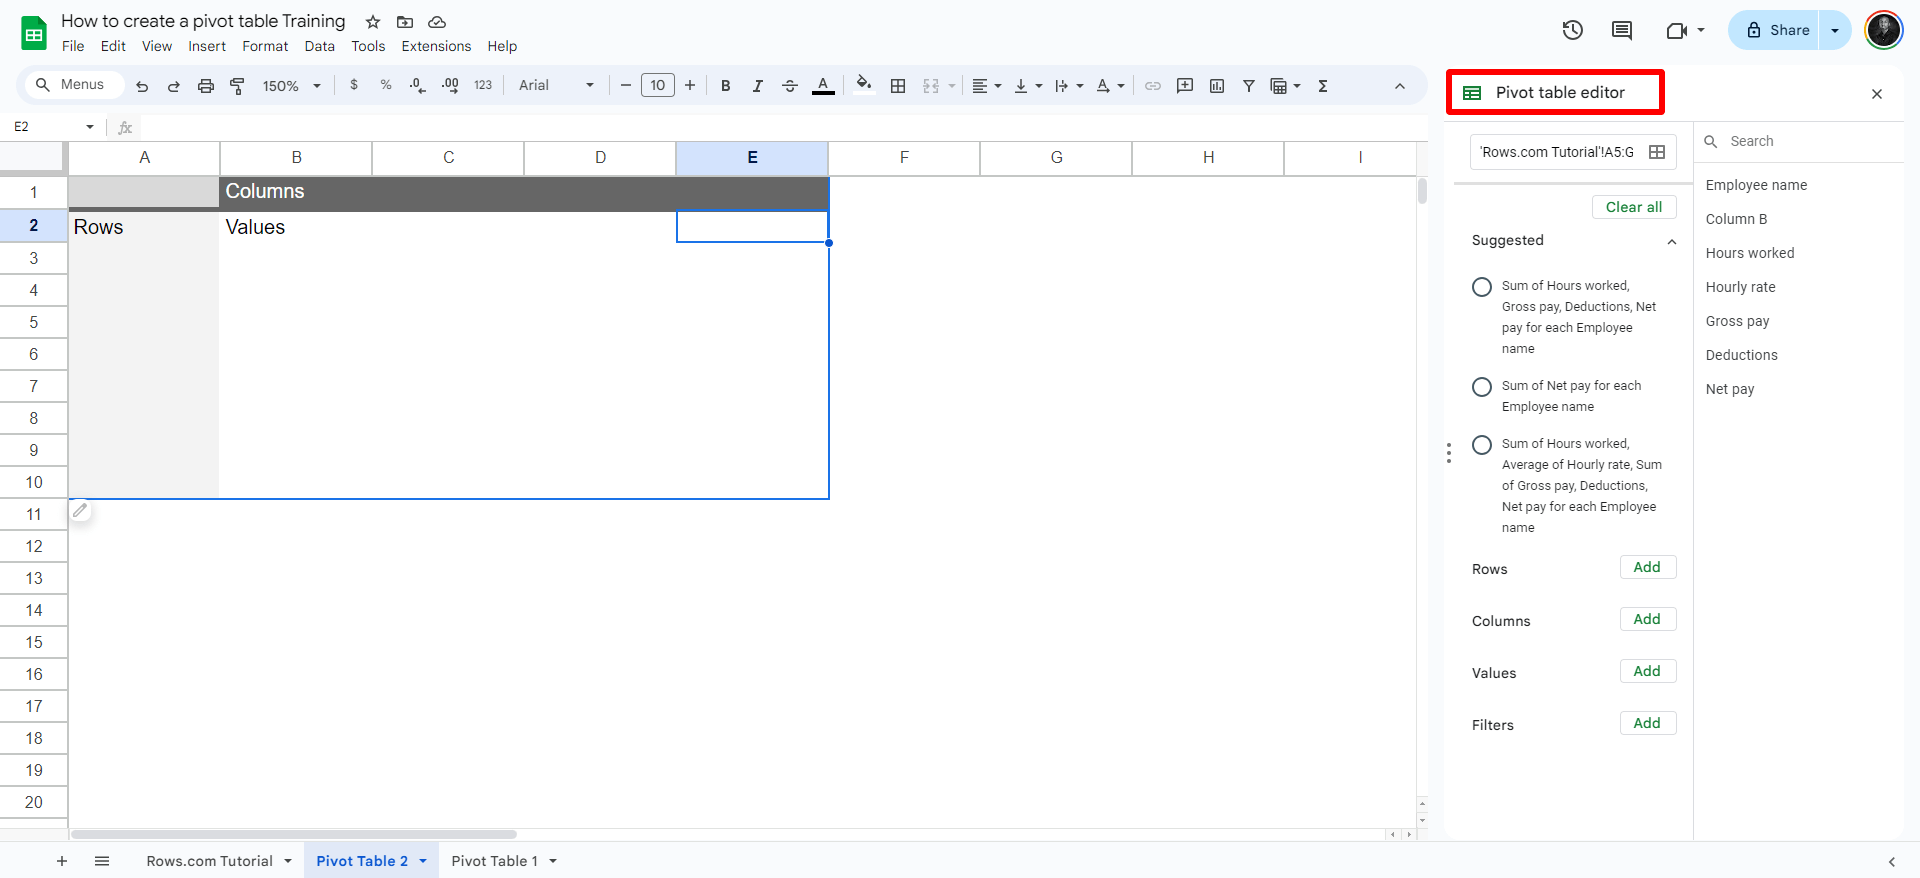
The next step is to learn how to customize your pivot table to your taste because you won't leave it this blank.
Step 3: Configuring the Pivot Table
There are two simple steps when it comes to formattimg your pivot table using the pivot table editor in Google Sheets:
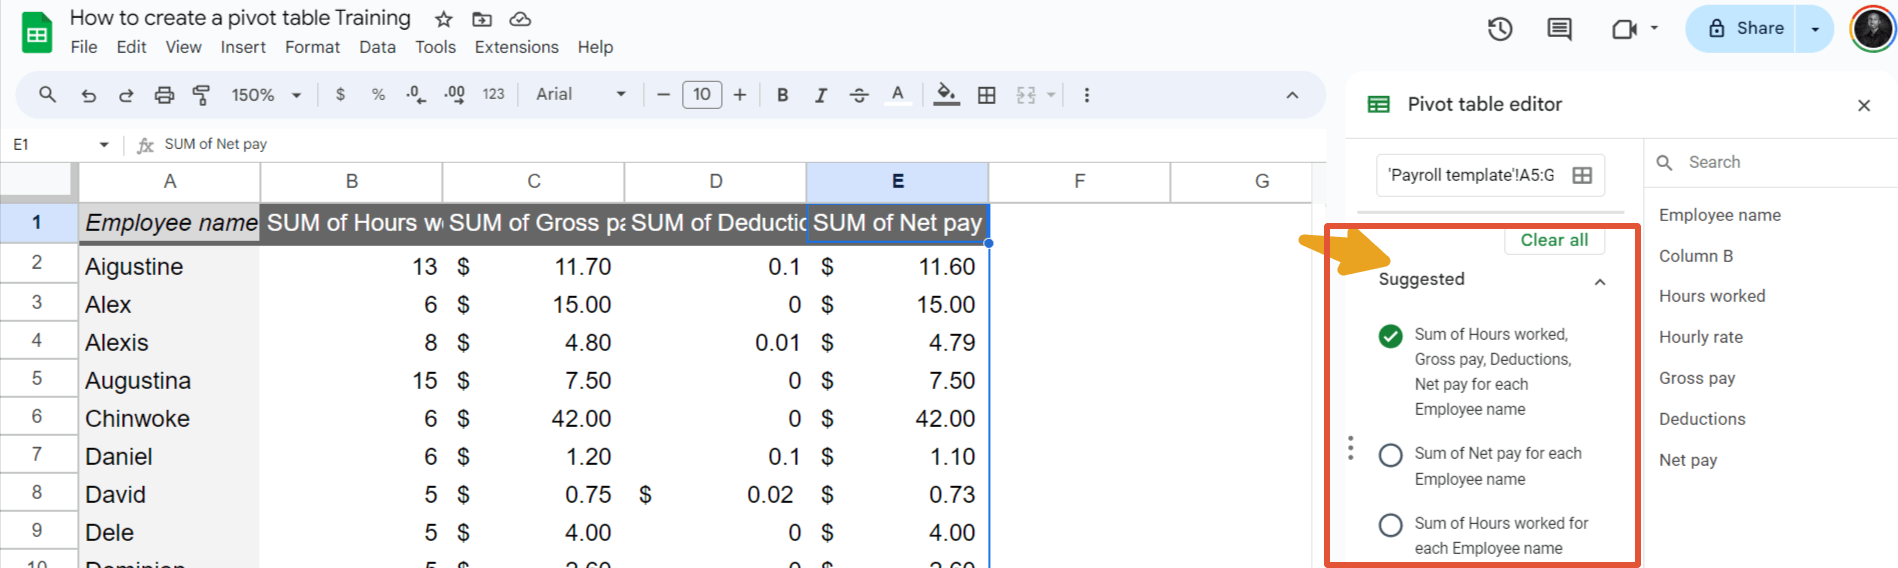
Method 1: Use the suggested pivot table filters in Google Sheets. This feature uses machine learning algorithms to analyze your original source data sheet and suggest relevant filters based on the content you highlighted.
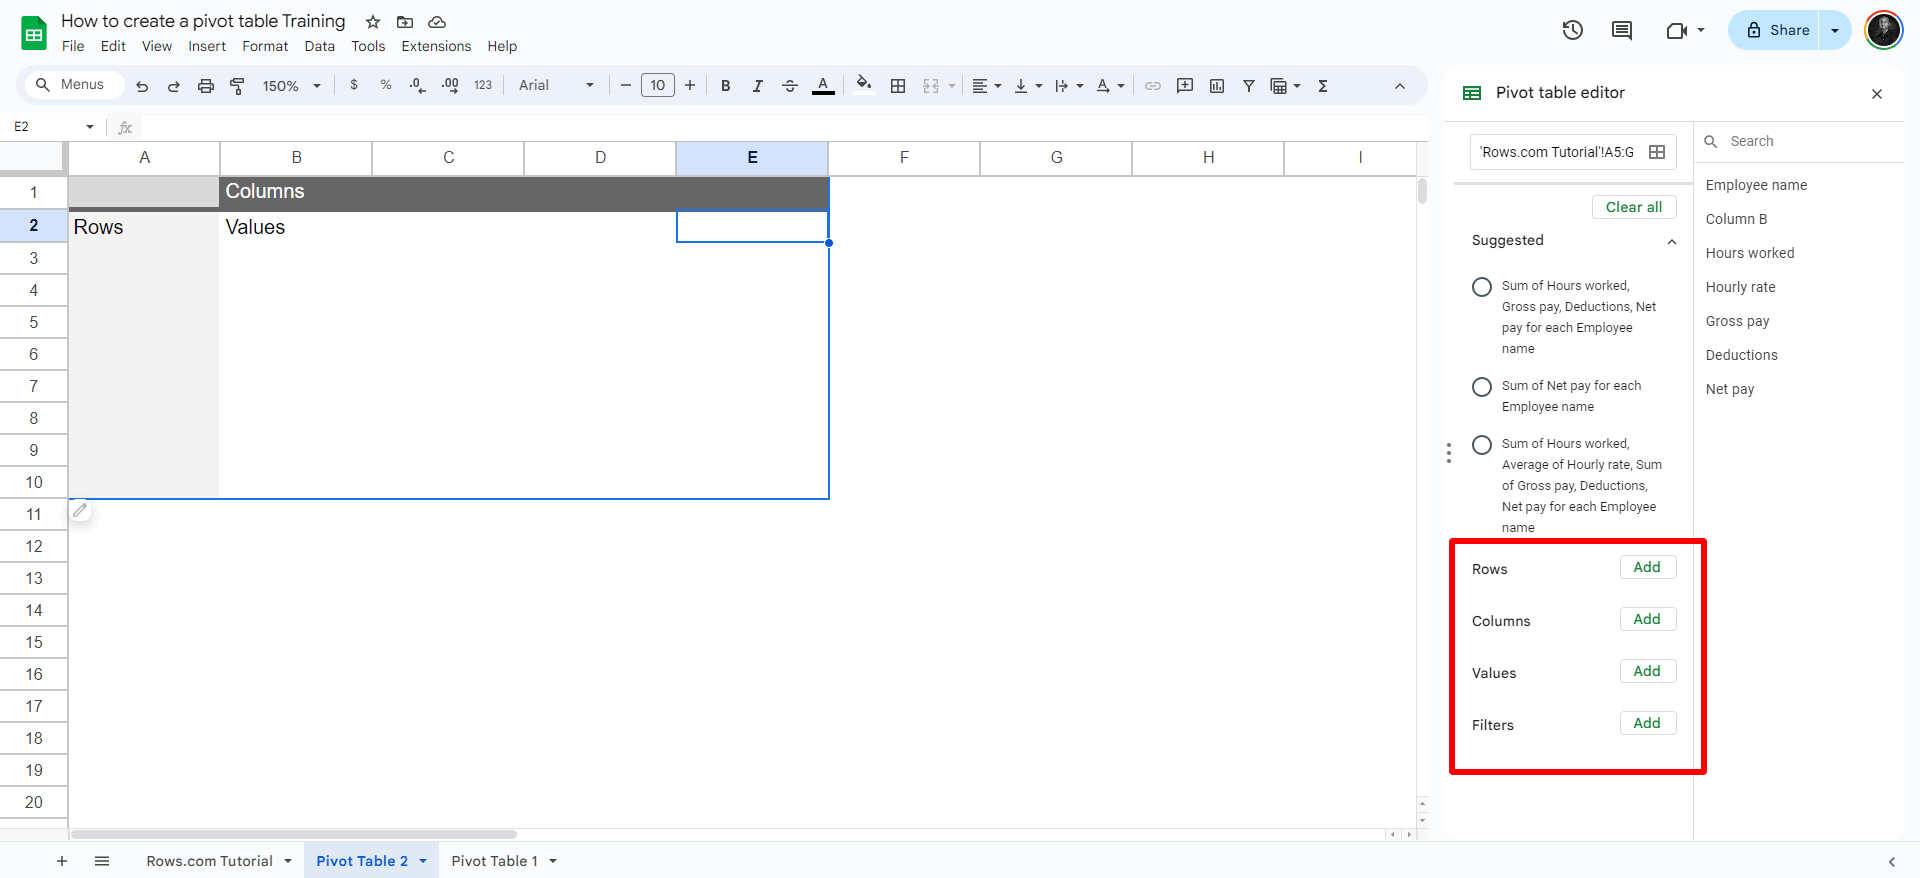
Method 2: Adding your choice of data for rows and columns. For example, drag and drop fields to your table or add filters.
Adding rows and columns:
You choose what you want on each row and column. All you have to do is click" Add," and you'll see all the column headers highlighted.
Summarizing data: There are many functions that summarize data such as SUM, COUNT, AVG e.t.c These summary functions help in deriving meaningful insights from the data. With pivot tables, you get summarized data. However, it's best to set your summary functions before creating a pivot table.
CTA: Curious about what tools companies are using to summarize and aggregate data? Check this article.
What are the drawbacks of using Google Sheets to create Pivot Tables?
While Google Sheets is useful for creating pivot tables, it still has some drawbacks. Let's take a look at the downsides:
Drawback 1: Poor UI
Google Sheets creates pivot tables in a new tab for you, disrupting your workflow and making it stressful to view the source data alongside the pivot table. This leads to extra time spent switching between tabs and complicates making quick adjustments based on the original data. GS also offers the chance of adding a pivot table on the same page, but looks awful and crammed.
Drawback 2: Lack of data source integrations and advanced options
It has limited capabilities to connect directly to external databases or APIs for live data feeds, restricting its use for real-time business intelligence. It also lacks advanced formatting techniques. For advanced options, unlike some dedicated business intelligence tools, Google Sheets doesn't offer built-in options to schedule automatic pivot table updates at specific intervals or times. You must manually update your pivot table's data range to capture these new values, and this takes a chunk of time.
Drawback 3: Missing Automation
In the AI era, Google Sheets misses a way to automate an otherwise manual job. It lacks AI-powered features that help you extract insights from your data.
Automate data pivoting with AI
Use AI to automate your data analysis. Ask any question about your dataset, extract key insights, create pivot tables in one click.
Try Rows for FreeHow to create pivot tables in Rows?
Rows is a comprehensive spreadsheet for modern teams that offers better UX for data ingestion and has native AI capabilities (AI analyst, AI-generated subtitles, native AI functions) that make reporting easier and faster.
And Rows is a powerful tool for creating pivot tables.
So, how do you create pivot tables on Rows?
It's a straightforward process.
But, first things first, a sneaky peek into the amazing features it has:
Pivot tables in Rows are 100% fully working with the same features as in Google Sheets, like:
- Multi-value, multi rows, multi-columns
- Sort by
- Hide/show totals
- Aggregation formulas on values (SUM, COUNTA, AVG …)
- Drag and drop elements between dimensions
But there are even better features.
Rows has two key advantages in creating pivot tables
Better UI
Automation thanks to the AI Analyst
Modern UI
The stacked table layout on Rows helps you have a tidy and organized space (and does not force you to open the pivot table in another tab as in G Sheets)
This is particularly valuable when it comes to data visualization and dashboard making. Example
The table's UI is better because it makes it easy to understand the variables on the two dimensions, too.
Automation features
With the AI Analyst - Rows offers the chance of:
automating slices, pivots and other dataset summaries: just describe what you want using natural language, and the Analyst will output it.
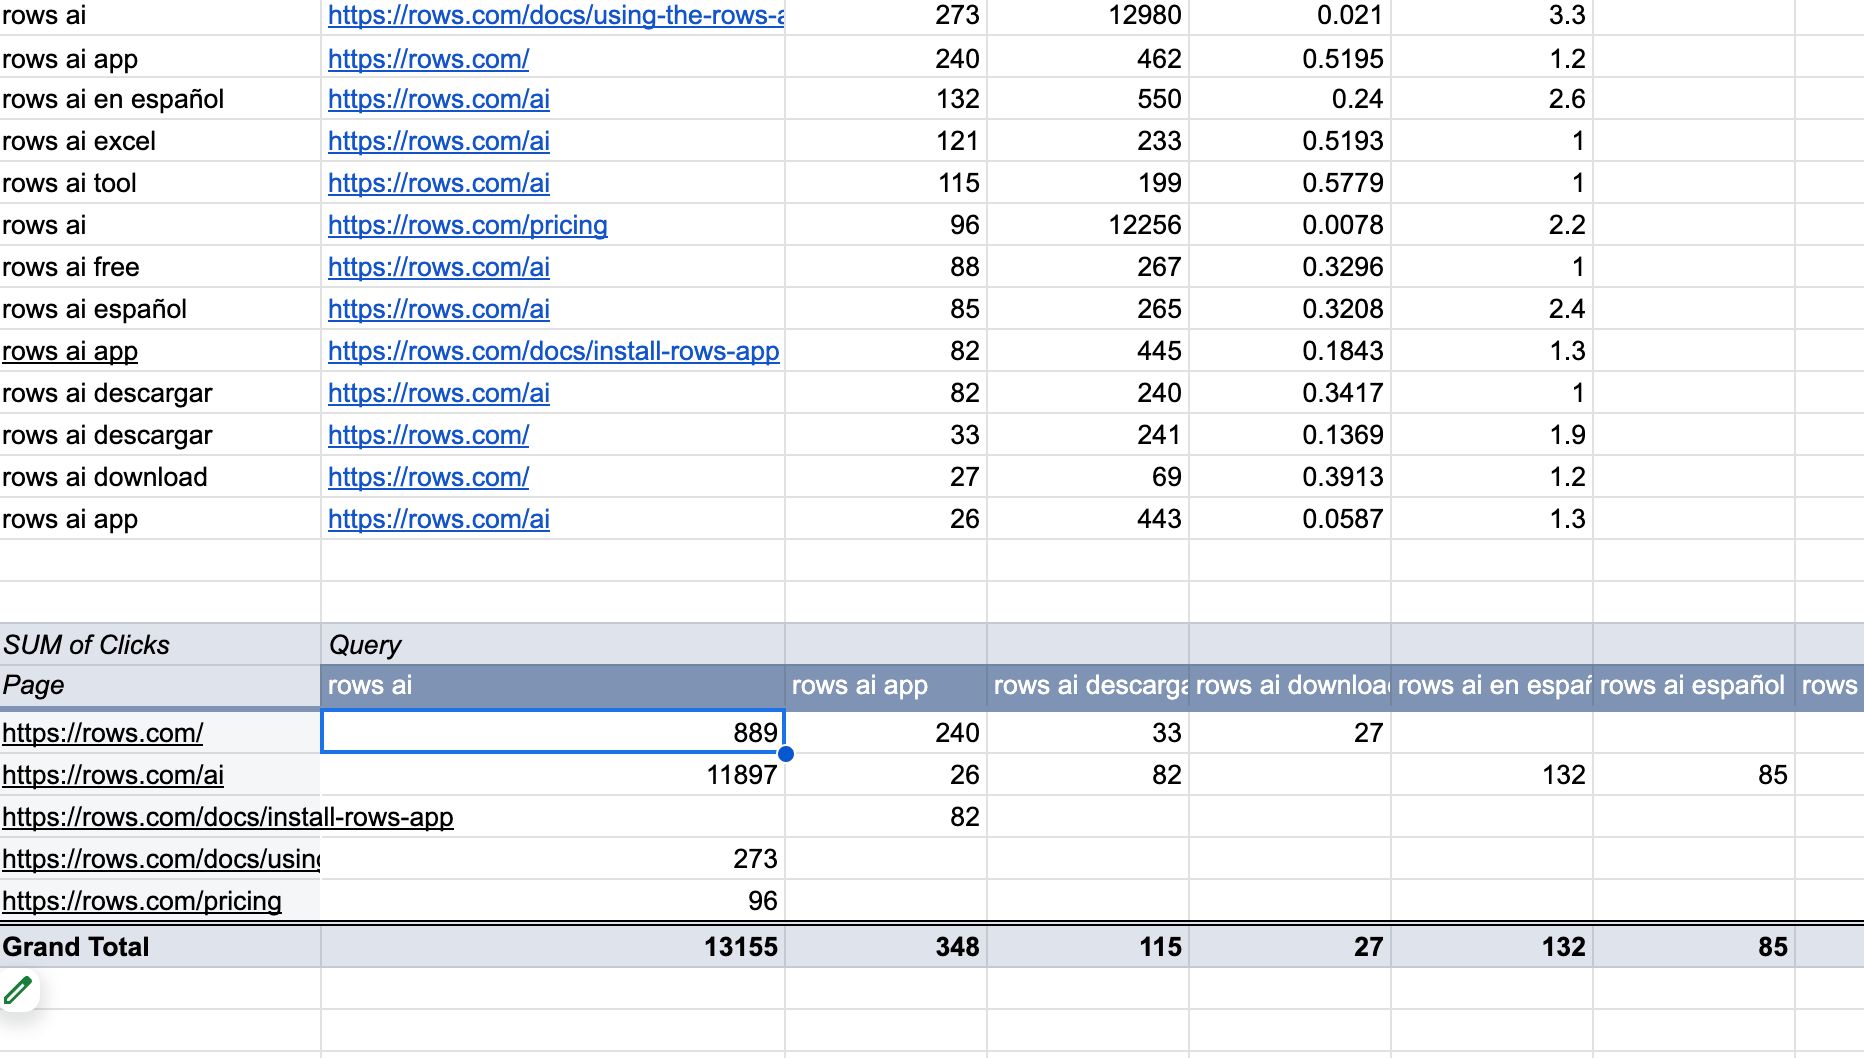
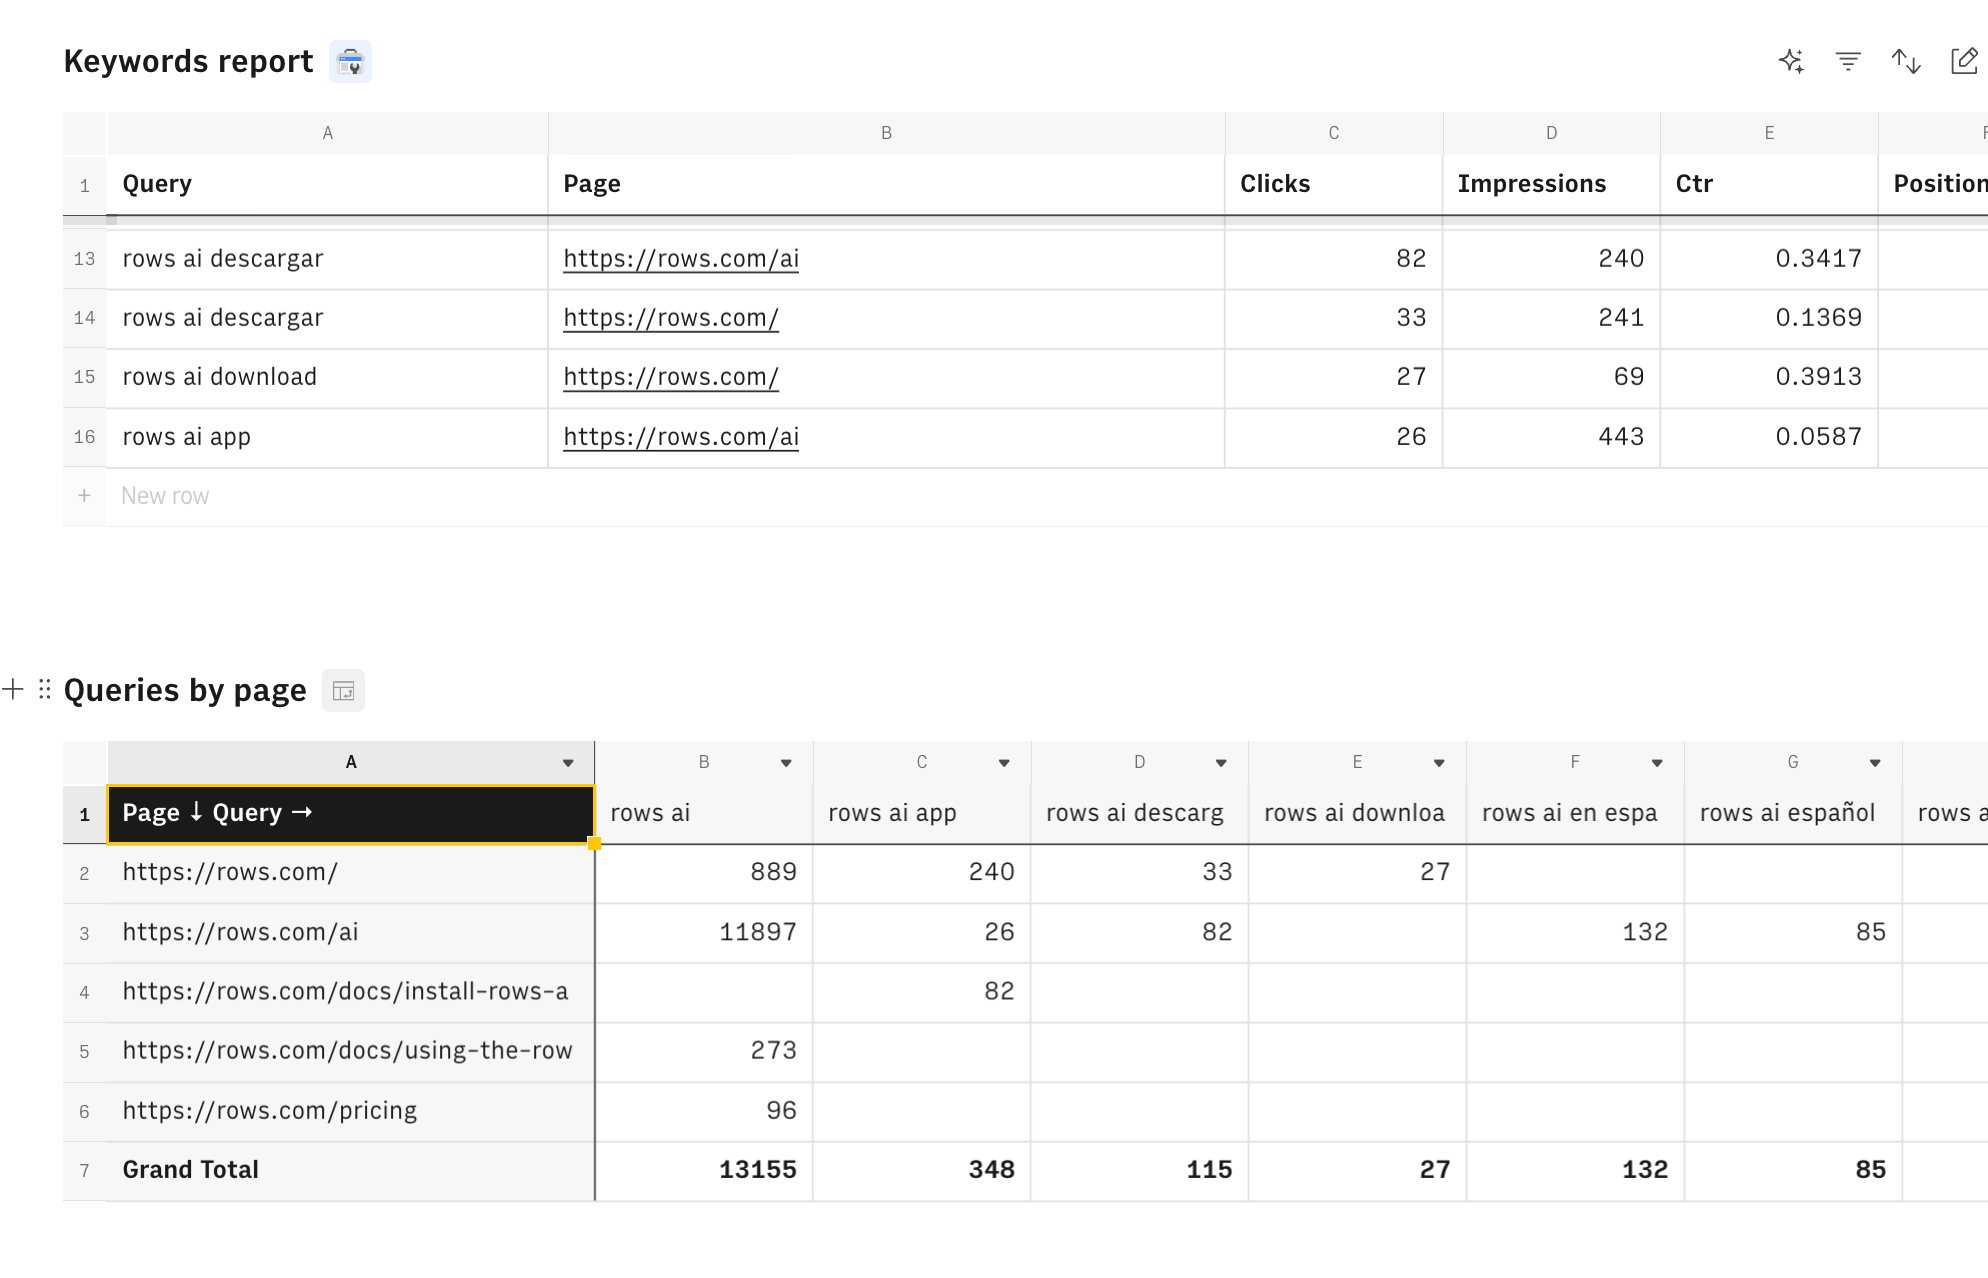
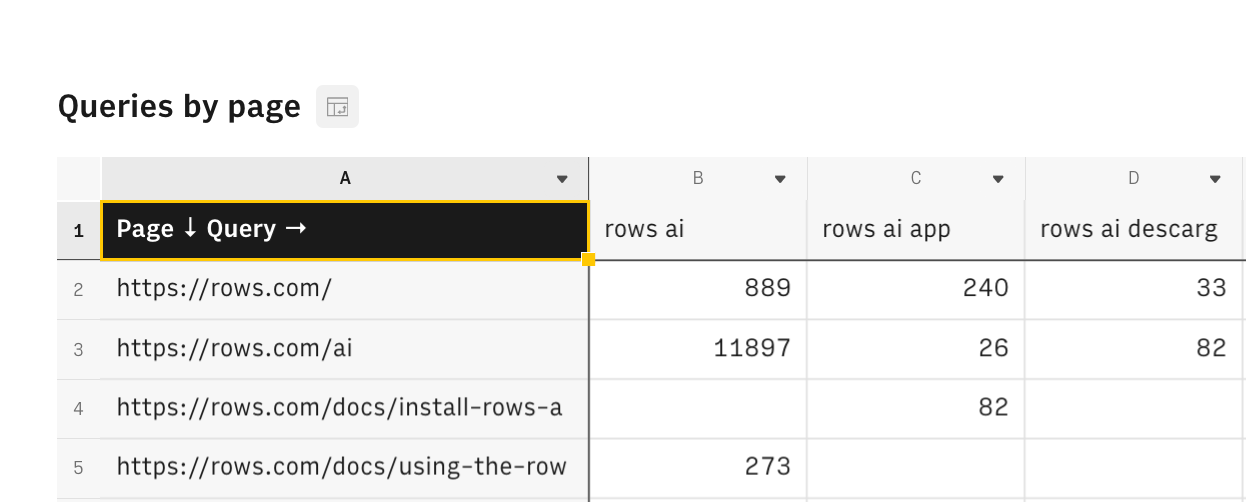
In the following example, the Analyst slices the main table by highlighting the top keywords by clicks.
In the example below, the Analyst analyzes data coming from GA4, groups the events by page and pivots by event name
Let's now take a look at how to create a Pivot Table with the help of AI as you want on our spreadsheet tool with just a few clicks:
Step 1: Visit Rows.com. You can start using the product for free right away without signing up. You get access to unlimited sheets, an AI analyst, and other features.
Back to the step. After opening your spreadsheet, look up to the top left corner; you'll see an AI icon on the lateral side of the corner. Click it. That's the AI analyst.
Step 2: The AI analyst pops up with a chat interface
Step 3: Describe what you need in plain language, for example: "return a table with sum of clicks by week, pivoted by campaign name". Check out our Analyst guide to learn how to make the most of it.
After doing this, your pivot table will be ready. The sweetest part is that you don't need to worry about switching tabs to check it, just like in Google Sheets. With Rows.com, you get your pivot table on the same page as your original spreadsheet. It gets even better—you can create multiple pivot tables.
What's more? Rows also lets you directly import live data from 50+ sources on the spreadsheet, eliminating the back and forth with files. The catalog includes:
Marketing: Google Analytics, GSC, Facebook, Instagram, TikTok
Productivity software: OpenAI, Notion, Slack, Email, Translate
Data warehouse: MySQL, BigQuery, PostgreSQL, Snowflake, Amazon Redshift
And many more.

Automate data pivoting with AI
Use AI to automate your data analysis. Ask any question about your dataset, extract key insights, create pivot tables in one click.
Try Rows for FreeFAQs about creating Pivot Tables
How does a pivot table differ from a regular spreadsheet table?
Many characteristics distinguish pivot tables from normal spreadsheets. They summarize and aggregate data, are interactive and dynamic, are powerful for filtering subsets of a dataset, and help execute comprehensive analyses.
What types of data are best suited for pivot tables?
Pivot tables work best with tabular data that has the following characteristics:
Consistent column headers: Each column should have a clear, unique header.
No blank rows or columns within the dataset.
Data is organized in a flat table format, not in a report layout.
Quantitative data: At least one column should contain numerical values that can be summarized.
Categorical data: Columns with text data that can be grouped and filtered.
What are examples of data for pivot table creation?
Sales data like sales by product category, unit price, business unit and revenue by product.
Customer profile: client demands, client names and client orders.client revenue by month.
And so on. Including marketing data, financial data e.t.c
Can I create a pivot table from multiple dataset sources?
Yes, you can create a pivot table from multiple data sources. For example, on Rows, you can:
Analyze data from GA4. And fetch data on your website landing page performance
You can also import data from Google Sheets
And many other data sources
The spreadsheet where data comes to life
Aggregate business data from 50+ sources, including web analytics, ads platform and databases.
Try Rows for FreeHow can I use pivot tables for data analysis and decision-making?
You can use a pivot table to compare performance across different business categories or in a specific department, such as; social media engagement metrics, campaign metrics, and campaign performance. You can also use it for segmentation purposes. For example, your sales reps can use it to segment new customers from existing customers. There are so many use cases
Meet Rows.com — The best way to create pivot tables
Pivot tables make getting valuable insights from a large data set easy. You don't need formulas or complex manual steps to do this.
Now, we've looked at how to create a pivot table on Google Sheets and its drawbacks. So, what's the best option for you? Rows.com. With Rows, you never have to worry about:
Switching tabs to check your pivot table
Or manually add filters to your pivot table.
Instead, you get an AI analyst that automatically creates as many pivot tables as you want. The Analyst slices the main table by highlighting the top keywords by clicks. You also get your pivot table on the same page as your spreadsheet.