How to Hide Columns in Google Sheets [2025]

In this guide, you will learn how to hide columns in Google Sheets to optimize your workflow. Whether you're managing complex financial reports or organizing marketing reports, learning this technique can significantly enhance your spreadsheet management skills.
We'll break down each method step-by-step, from using the right-click menu to hiding multiple columns, ensuring you become proficient in column manipulation.
How to Hide Columns in Google Sheets Manually?
Step 1: Open your Google Sheets document
Step 2: Select the column(s) you want to hide — To do this, you have to click on the column letter at the top of the sheet to select an entire column
Afterward, right-click the selected column(s) to open a context menu.
For this example, I selected column A and right-clicked on it.
In the context menu, locate and click on "Hide column(s)"

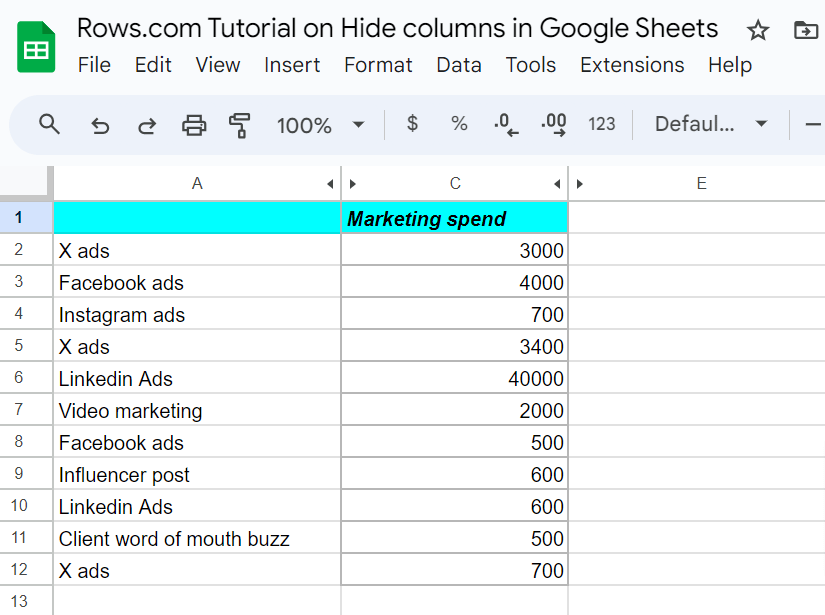
The selected column(s) will disappear from view
- You'll see a double line indicating hidden columns


Your new AI Data Analyst
Extract from PDFs, import your business data, and analyze it using plain language.
Try Rows (no signup)How do you hide multiple adjacent columns in Google Sheets?
Step 1. Click and hold on the letter at the top of the first column you want to hide.
Step 2: While holding the mouse button down, drag to the right until you've selected all the adjacent columns you want to hide. Release the mouse button.

After selecting the adjacent columns, right-click on any of the columns and choose “Hide columns.”

How to hide multiple non-adjacent columns in Google Sheets
Sometimes, you may want to tailor the focus of your data to certain columns in a spreadsheet and highlight non-adjacent columns.
Here are the steps to take:
Step 1: Click on the letter at the top of the first column you want to hide to select the entire column.
Hold down the Ctrl key on your keyboard on Windows or Cmd key on Mac.
While holding the Ctrl/Cmd key, click on the letters of other columns you want to hide. This allows you to select multiple non-adjacent columns.
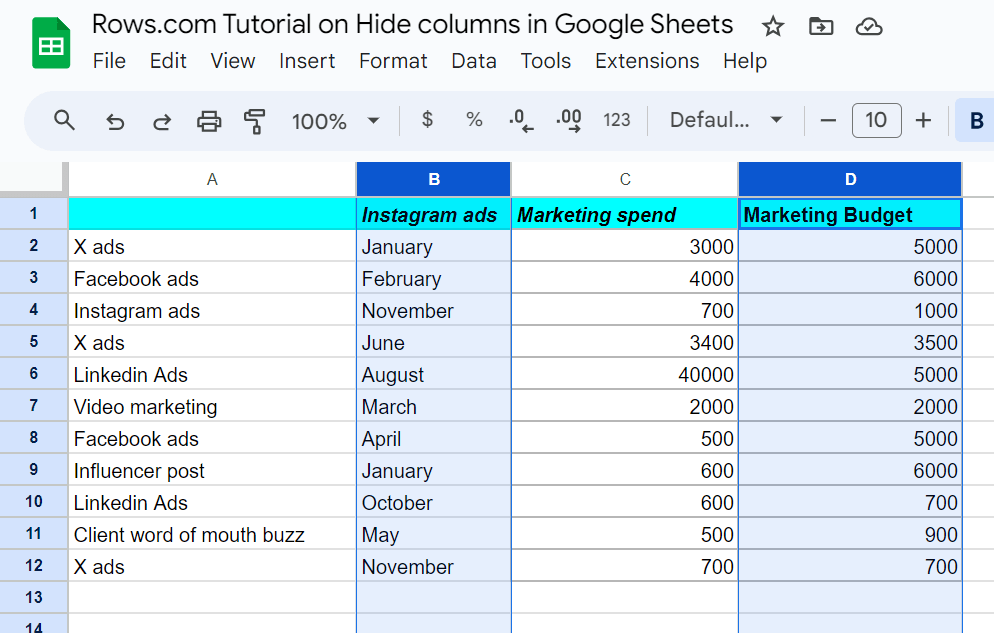
With the columns selected, you have two options to hide them:
Option A: Using the right-click menu
Right-click on the last selected column headers.
From the context menu that appears, choose "Hide columns.
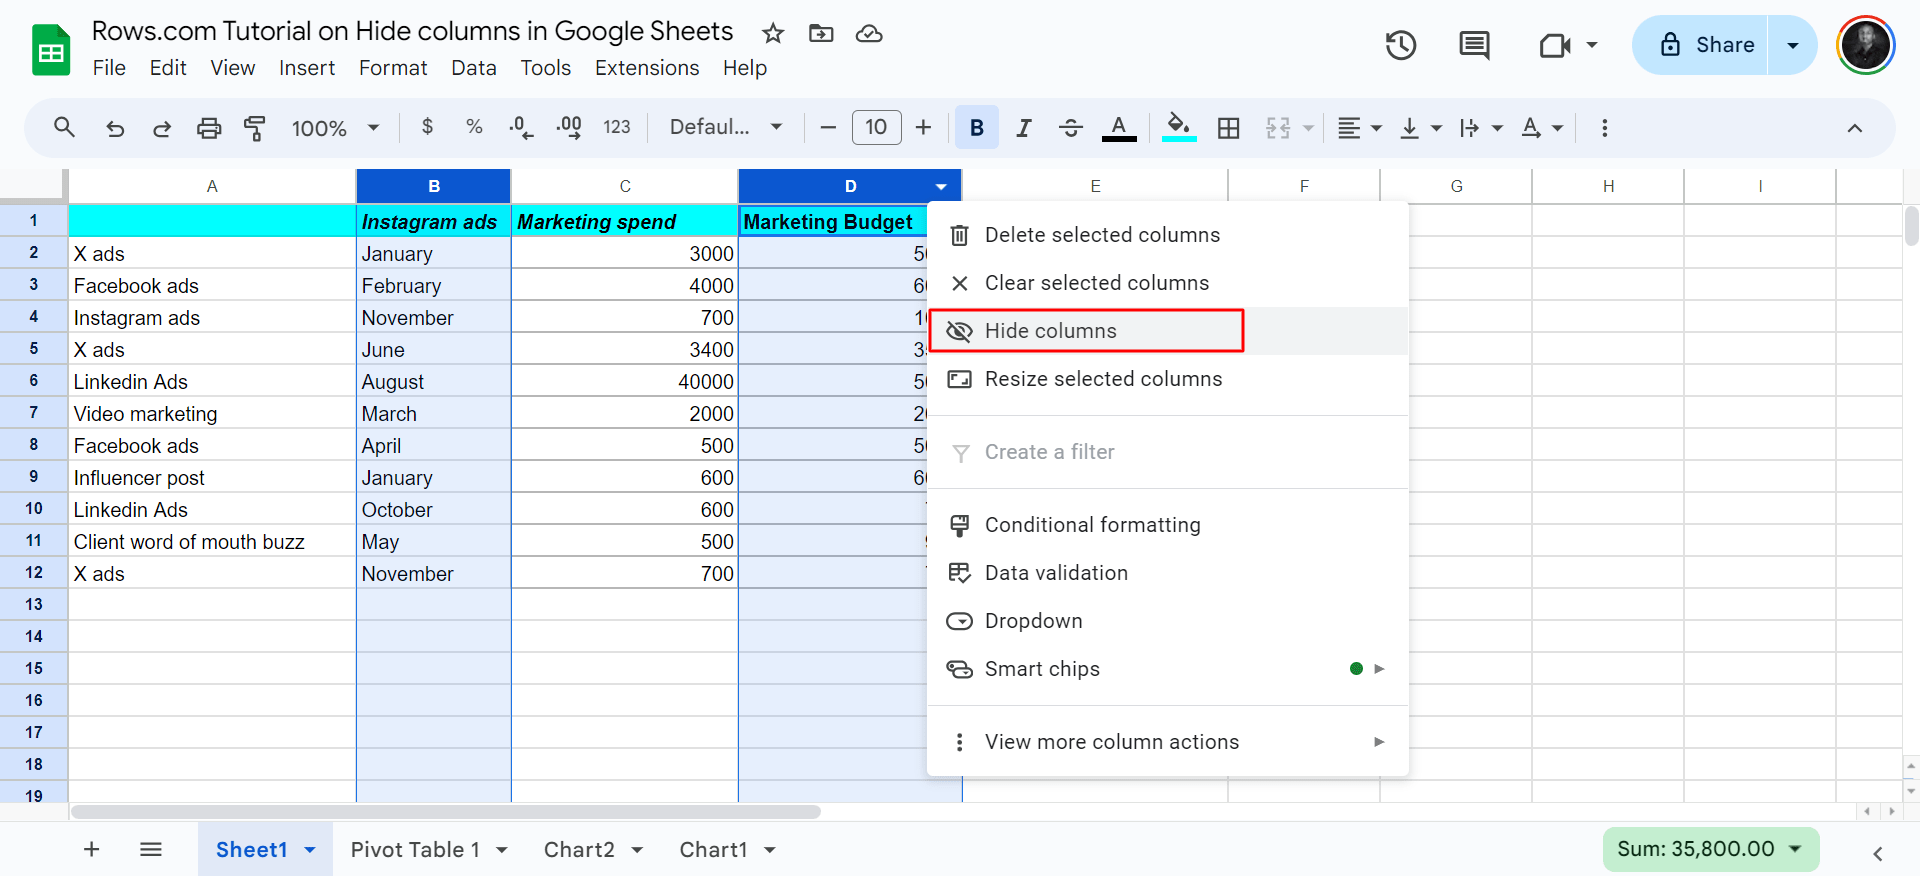
The selected columns will now be hidden. You'll see a double line indicating where hidden columns are located.
How to Unhide Columns in Google Sheets?
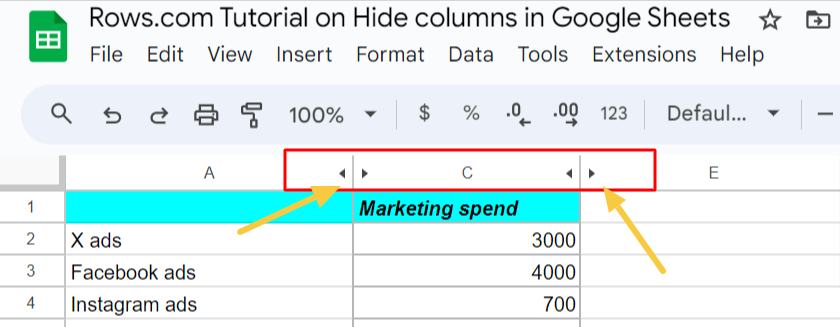
All hidden columns can be unhidden. A small arrow indicator appears near the visible columns when columns are hidden in Google Sheets. This arrow provides a quick way to unhide the hidden columns.
To unhide any column you've hidden, follow the steps below:
Locate the hidden column indicator: Look for a small arrow icon between the column headers. It will appear where there are hidden columns.
Move your cursor over the arrow. It should change to a hand icon, indicating it's clickable.

Your new AI Data Analyst
Extract from PDFs, import your business data, and analyze it using plain language.
Try Rows (no signup)Google Sheets’ alternative — How to hide columns in Rows

Rows is a comprehensive spreadsheet for modern teams that offers a modern UI, built-in integrations for live data ingestion, and native AI capabilities (AI analyst, AI-generated subtitles, native AI functions.
Below, you'll learn how to hide columns in Rows with easy steps:
Step 1: On the spreadsheet. Select the column you want to hide and click on the drop-down arrow on the column. Ice done, you'll see a set of menu functions — click “Hide column.”

Once done, the column will disappear automatically.

How to hide adjacent columns in Rows
Step 1. Click and hold on the letter at the top of the first column you want to hide.
Step 2: While holding the mouse button down, drag to the right until you've selected all the adjacent columns you want to hide. Release the mouse button.
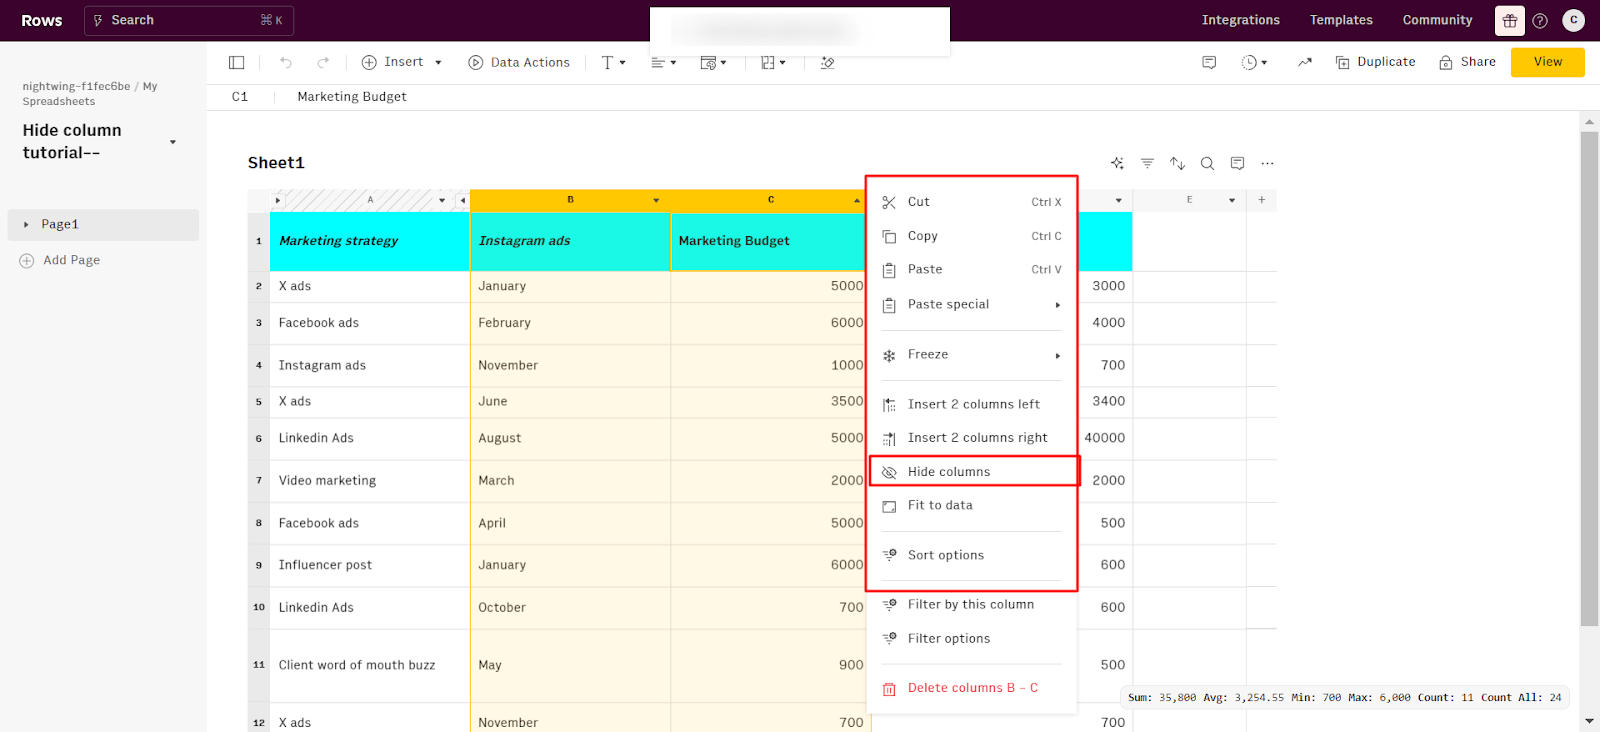
Once done, you will notice that both columns have disappeared.
How to unhide columns in Rows
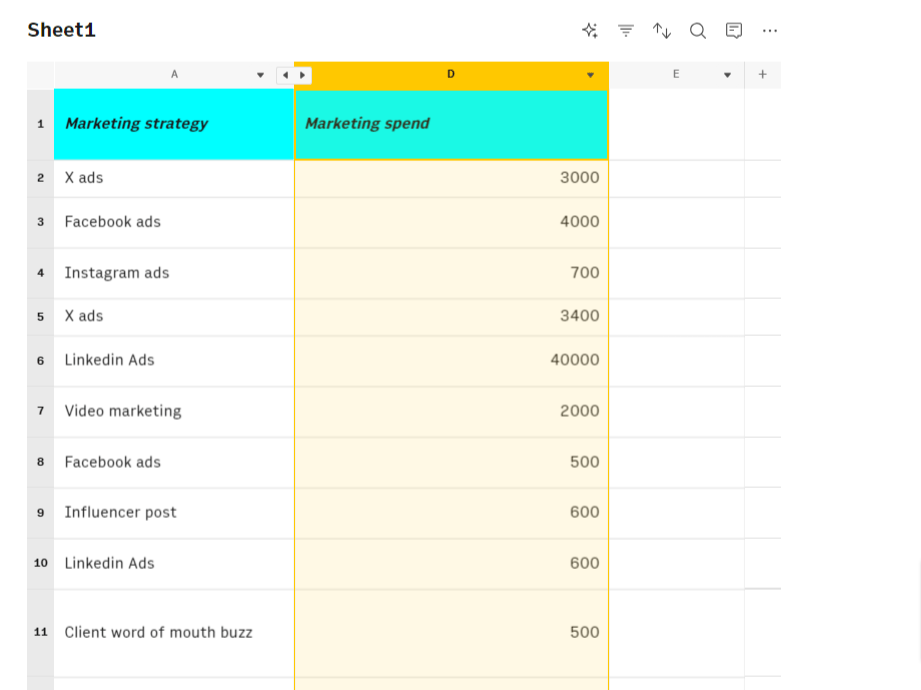
Unhiding columns in rows is easy. All you need to do is click on a sideway arrow.
Look for a small arrow icon between the column headers. It will appear where there are hidden columns.
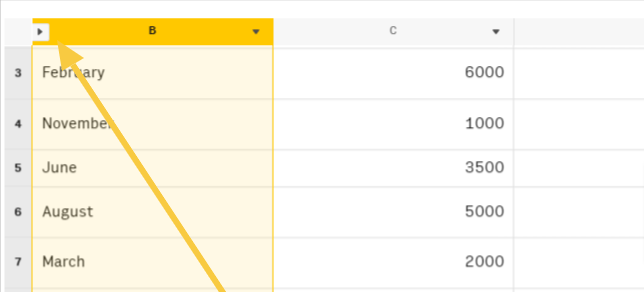
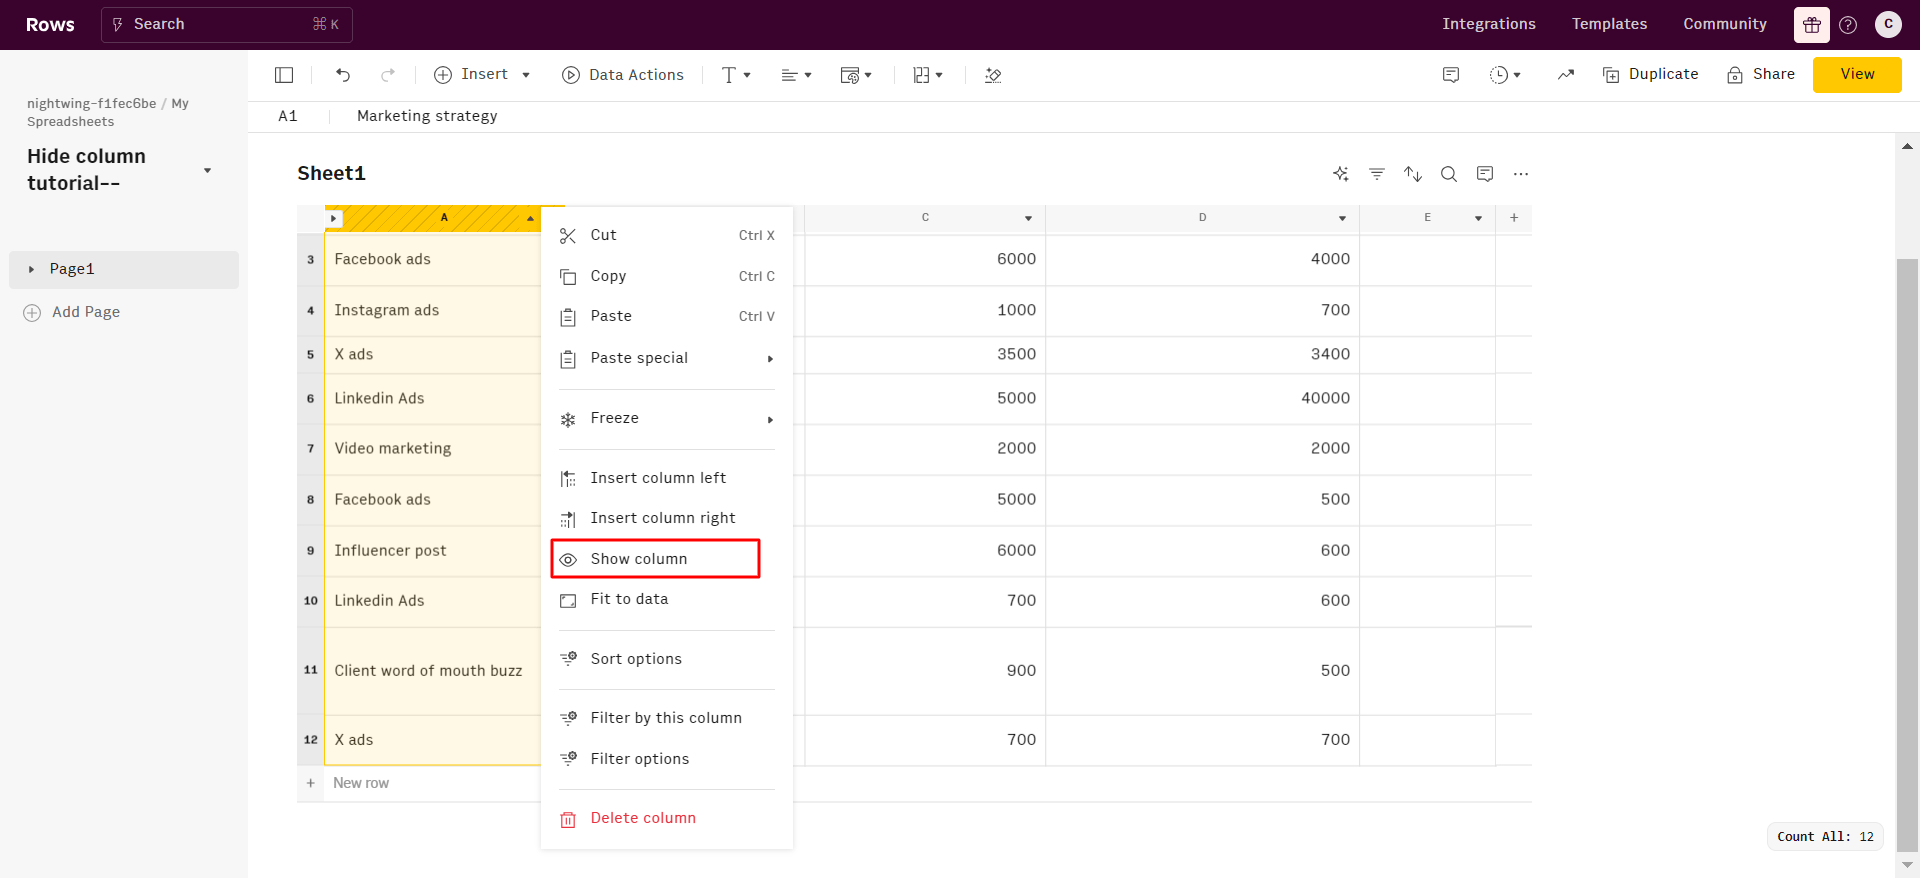
Once done, you'll see a pop-up of several functions — click on “Show column.” This opens the hidden column.
How does Rows compare with Google Sheets?
Data aggregation
You can aggregate live data from 50+ sources in a very simple manner, thanks to built-in data integrations in various domains:
Marketing: GA4, GSC, Facebook, Instagram, TikTok, etc
Productivity software: OpenAI, Notion, Slack, Email, Translate
Data Warehouse: MySQL, BigQuery, PostgreSQL, Snowflake, Amazon Redshift
And many more.
See the example below, on how to import data from Google Search Console:
AI-powered automation
With the AI Analyst, you can ask AI to analyze, summarize, transform, and enrich your analysis. Click on the "AI Analyst“ ✨ icon, at the top right corner of any table.
A chat interface will open on the right: you can ask a broad range of questions, from basic spreadsheet commands - plotting a chart or adding or formatting columns - to more complex tasks, such as slicing, pivoting, or computing metrics about your data.
For example, given a dataset with daily revenue and costs of various marketing campaigns, you can ask the Analyst to add a column with the profit margin. Watch the video below:
In addition, our AI Analyst is instructed to use our native OpenAI functions to perform data enrichment or extraction tasks.
For example, you can ask the AI analyst to run a sentiment analysis on a column with product reviews, or add a column that categorizes addresses into regions, see below:
Want to know more about how our Analyst works? Check out our guide or watch our demo.
Modern UI
Spreadsheets in Rows present a document-like layout with standalone tables and charts stacked vertically and horizontally.
WYSIWYG: the spreadsheet IS the dashboard. All data is rendered as regular spreadsheet tables. You can move elements vertically and horizontally with drag and drop. And if something breaks, you can intervene on that table or chart flexibly, without the need to dive into complex workflows.
View Mode: View mode makes your spreadsheets work like web applications. With input fields, you can help anyone understand how to use your spreadsheet by highlighting the cells that need input by the user.

Your new AI Data Analyst
Extract from PDFs, import your business data, and analyze it using plain language.
Try Rows (no signup)Supercharge your sheets with Rows
With Rows, you can access 50+ built-in data source integrations in various domains.
This makes it easy to ingest data into your table quickly and reduces your team's stress.
With Rows, you can gather data from various sources in your system. This allows for more detailed analyses and helps your team uncover insights they might miss.
Ready to get started with Rows.com? Start using the product right away for free.

