How To Set Up Conversion Tracking For LinkedIn Ads To Accurately Track Leads


You can't measure the conversions you don't track.
It's one thing to run LinkedIn Ads; it's entirely different when it comes to conversion tracking. You can envision the level of ROI all you like, but it's impossible to assume results.
So, say you’ve built your ideal sales funnel page on your website, and you've run a LinkedIn Ad campaign. As soon as your ad is out there on the feeds of your ideal customers, you naturally want to make sure people interact with them by taking action—the most common one being people clicking (or tapping) on something. In the business world, these people are called leads. So, how do you track the interactions of these leads?
That's where conversion tracking for LinkedIn ads comes in. In this article, you'll explore the steps to set up conversion tracking for LinkedIn Ads. In addition to that, you'll learn how to use a free tool to create LinkedIn ad discrepancy reports.

Your next LinkedIn Ads report
Synced with your LinkedIn Ads campaign data, easy to navigate as a spreadsheet, sharable as a dashboard.
Try it now (it's free)Setting Up Conversion Tracking For LinkedIn Ads: Step-By-Step
How can you make improvements if you don’t know what’s working in your campaign and what’s not?
Conversion tracking allows you to see which ads are driving the most conversions. With this information, you can adjust your ad spending, keyword strategy, and sales funnel. This helps you optimize those campaigns further and apply the strategies of your more successful campaigns to those that need improvement.
You will learn how to set up conversion tracking for LinkedIn ads in a few more lines. These steps include:
Step 1: Install the LinkedIn Insight Tag
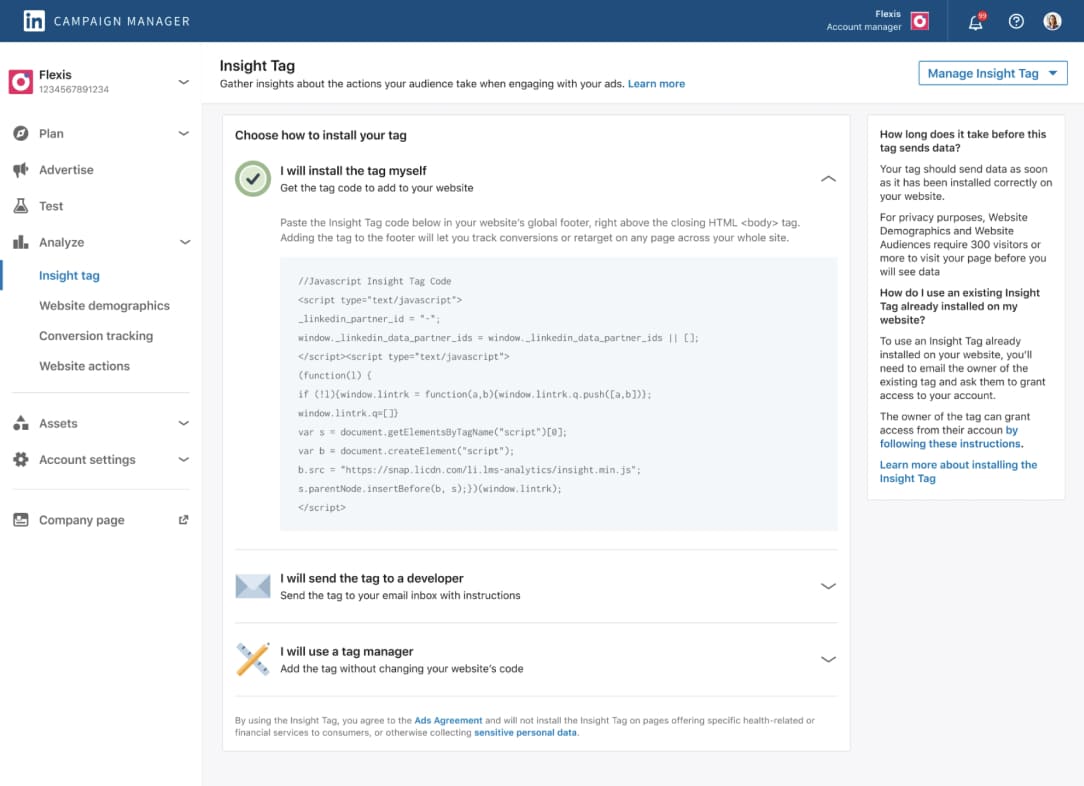
The first step is to install the LinkedIn Insight Tag on your website. This tag lets you track conversions and other valuable data from your LinkedIn Ads.
In Campaign Manager, navigate to “Analyze” and click “Insight Tag”.
You can install it in one of two ways:
Manual method — by yourself through a JavaScript code
Engineering method — through your engineers
Tip💡 Make sure to install the LinkedIn Insight Tag on all the pages where you want to track conversions.
Step 2: Access LinkedIn Campaign Manager
Log into your LinkedIn Campaign Manager account and navigate to the "Conversion Tracking" section.
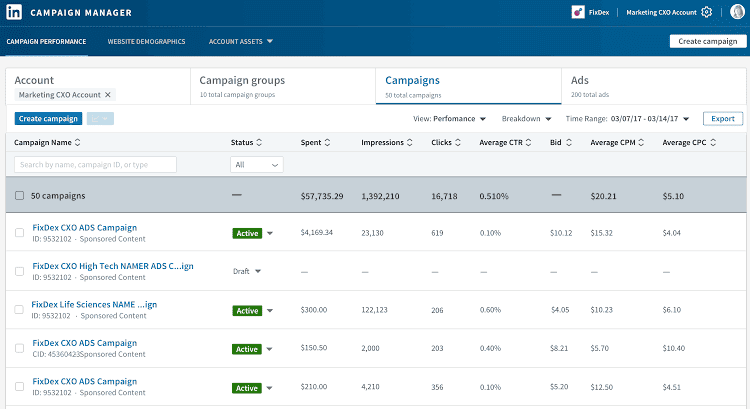
Step 3: Create a New Conversion Action
Click on the "Create Conversion" button to set up a new conversion action.
Step 4: Define Your Conversion Criteria
After creating the conversion action, you must define the specific criteria to trigger the conversion event.
In the Conversion Actions section, click on the conversion action you just created.
Depending on the conversion type, you'll need to provide additional details, such as the URL, form field, or other criteria that should be used to track the conversion.
Test your conversion tracking setup to ensure it's working as expected.
Tip💡: Create a unique, trackable URL for each conversion action. This is especially useful for custom thank-you pages.
Step 5: Link Conversions to Your Campaigns
The final step is to link your newly created conversion actions to your LinkedIn ad campaigns.
Navigate to the "Campaigns" section of the LinkedIn Campaign Manager. Select the campaign for which you want to track conversions, then click the "Edit" button. Click the "Add Conversion Action" button and select the conversion action(s) you want to track for this campaign.
Once you are done, add the button and save your campaign settings to apply the conversion tracking.
Next Steps: Set Up Rows’ LinkedIn Ads Dashboard (It’s Free)
The next step is to set up our Rows LinkedIn Ads dashboard — it is free to use and contains key metrics to help you measure the results of your LinkedIn ads.
Step 6: How to measure your LinkedIn conversions with Rows LinkedIn Ads Dashboard
In addition to monitoring your LinkedIn Ads conversions on your LinkedIn campaign manager, you can also monitor it on Rows.
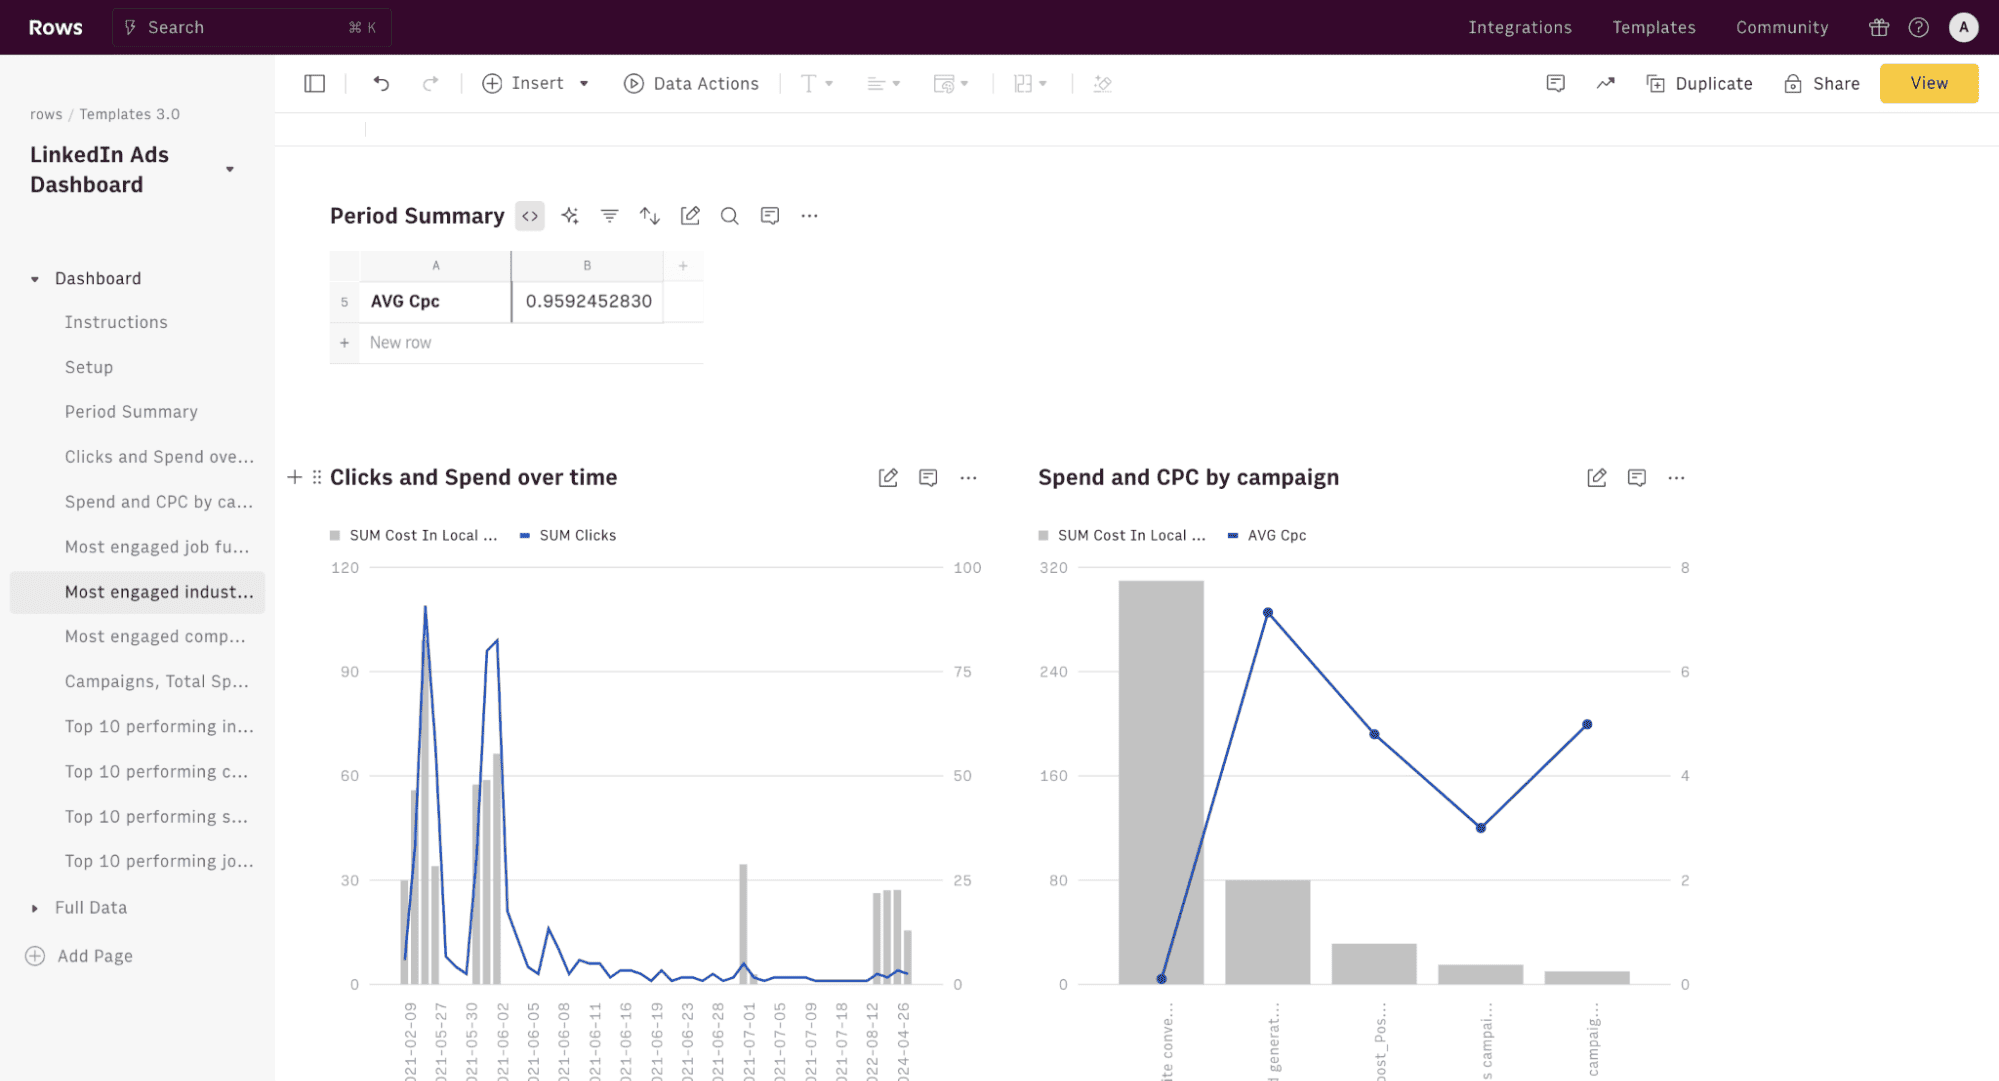
Our LinkedIn Ads Dashboard template is designed to provide you with a comprehensive overview of your LinkedIn advertising efforts. This tool simplifies your LinkedIn reporting by offering high-level period summaries, including the number of campaigns, total spend, clicks, and cost-per-click (CPC)
Additionally, with our template, you'll access campaign-specific summaries, spending and CPC trends over time, and audience breakdowns — by job function, country, industry, and company size.
So, how does it work? Below are a few steps on how to use our LinkedIn ads dashboard;
Step 1: Visit Rows.com and sign up for a new account if you haven't. Then, go to the LinkedIn ads dashboard page
Go through the page and read a few more points about the dashboard.
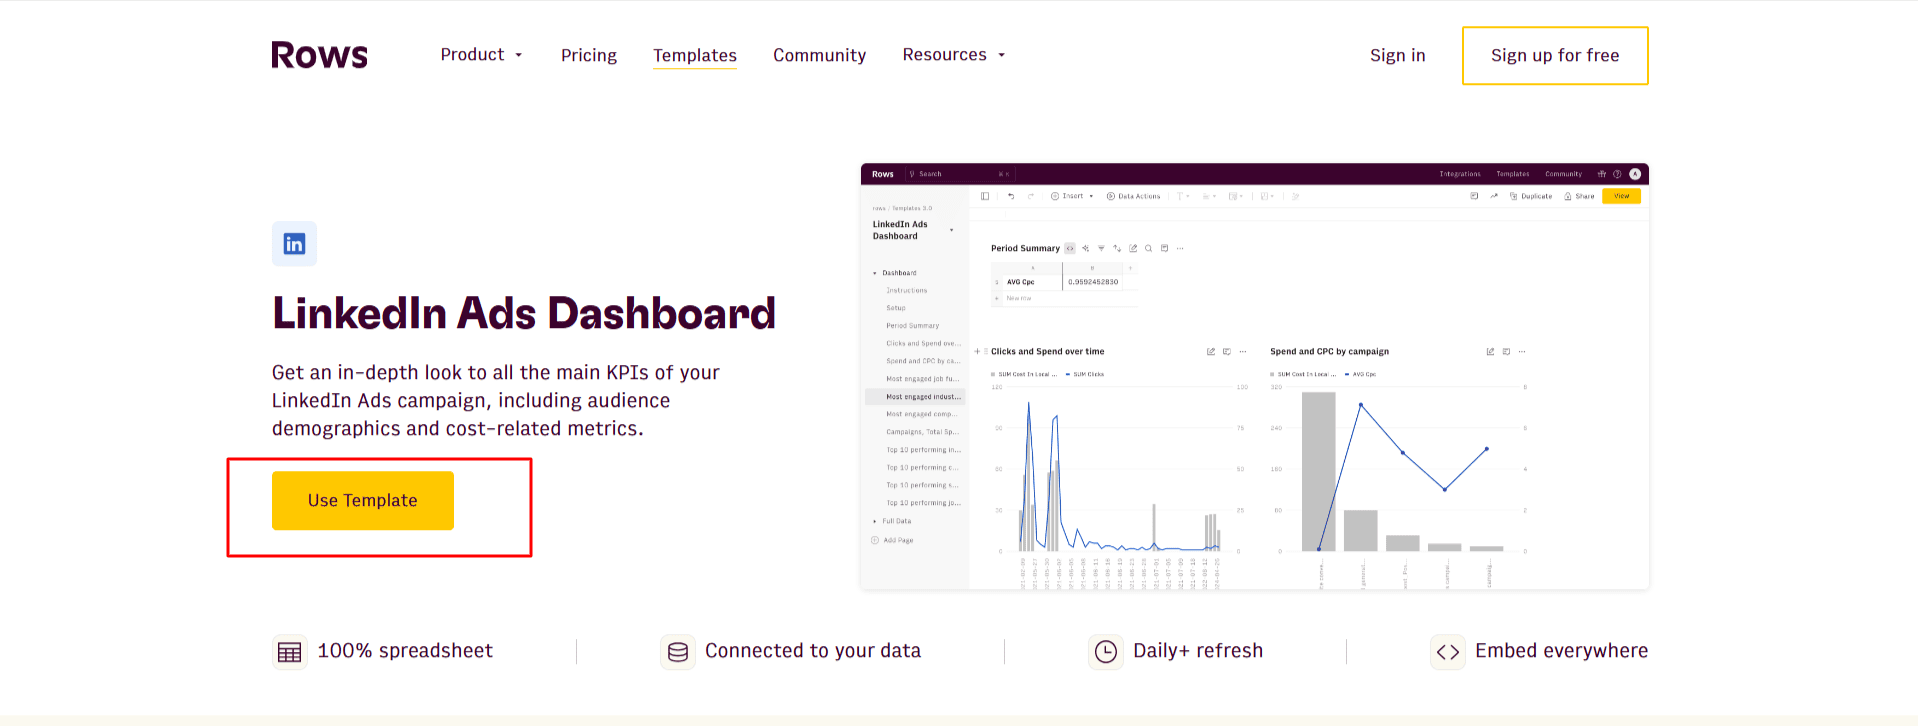
Step 2: On the page, click ‘’use template’’
Once done, you'll see a pop up — click “use spreadsheet”.
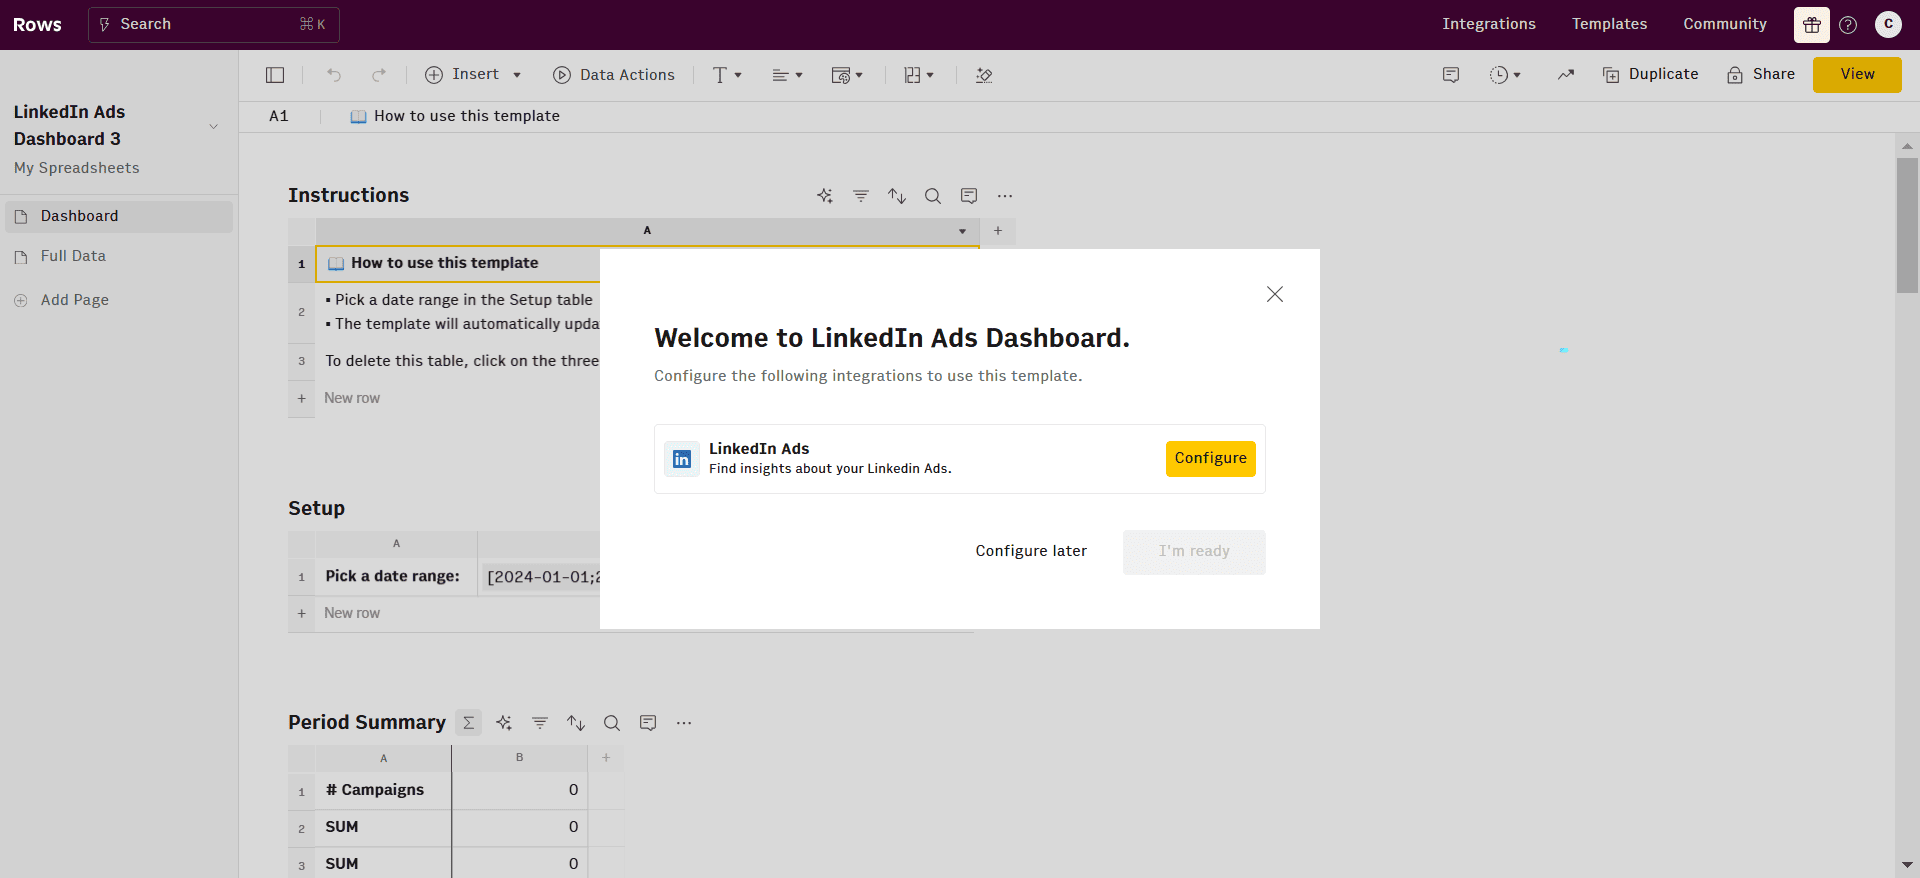
Step 3: Configure your LinkedIn Ads integration to Rows.
Clock configure and connect your LinkedIn Ads software account to Rows. This helps you integrate data from your campaign manager to your Rows spreadsheet
Step 4: Pick a data range
If you have executed multiple LinkedIn campaigns in that past year, you can select a specific time period you want to measure. Once chosen, the template will automatically update data from your LinkedIn campaigns
The Rows LinkedIn Ads dashboard template has 5 charts and 5 spreadsheet tables. Let's take a look at what each table and chart entails —
Period summary — This is the overall summary of your campaigns within a specific period.
Clicks and spending over time — This chart summarizes the ad clicks and the amount spent over a particular period.
Spend and CPC by campaign—This chart shows the relationship and comparison between ad spend and cost per click per campaign.
Most engaged job functions—This chart gives you a bird' s-eye view of the audience type interacting with your campaigns based on job roles or functions.
Most engaged industries — This shows you the industries within the reach of your ad campaign
Most engaged company sizes—This chart helps you understand where the most engaged people are and the sizes of the companies in relation to “most engaged by job functions.”
Campaigns, Total Spend, and CPC: This table summarizes the total spend and average cost-per-click for each campaign, allowing the user to assess the performance and efficiency of individual campaigns.
Top 10 Performing Industries, Company Sizes, Seniority, and Job Functions: These charts and tables showcase the top-performing segments across various dimensions, empowering the user to focus on the campaign's most successful aspects and replicate their strategies.
Step 7: Set Up Rows LinkedIn Ads Conversion Discrepancies Report
To monitor the performance of your conversion tracking, you should set up the LinkedIn Ads Conversion Discrepancies report.
A LinkedIn Ads conversion discrepancy report is an analytical presentation of the measurement of the difference in impressions or other metrics reported by LinkedIn. It can help identify potential issues with ad delivery or tracking.
As a performance marketer, you know the drill. You pull up your latest campaign reports, and there it is again - a glaring discrepancy between the conversion numbers in LinkedIn Ads and Google Analytics.
It's frustrating, but it's also a common issue that can significantly impact your decision-making and campaign optimization.
Let's explore a quick solution to this problem, which will help you ensure that your marketing efforts are based on accurate, reliable data.
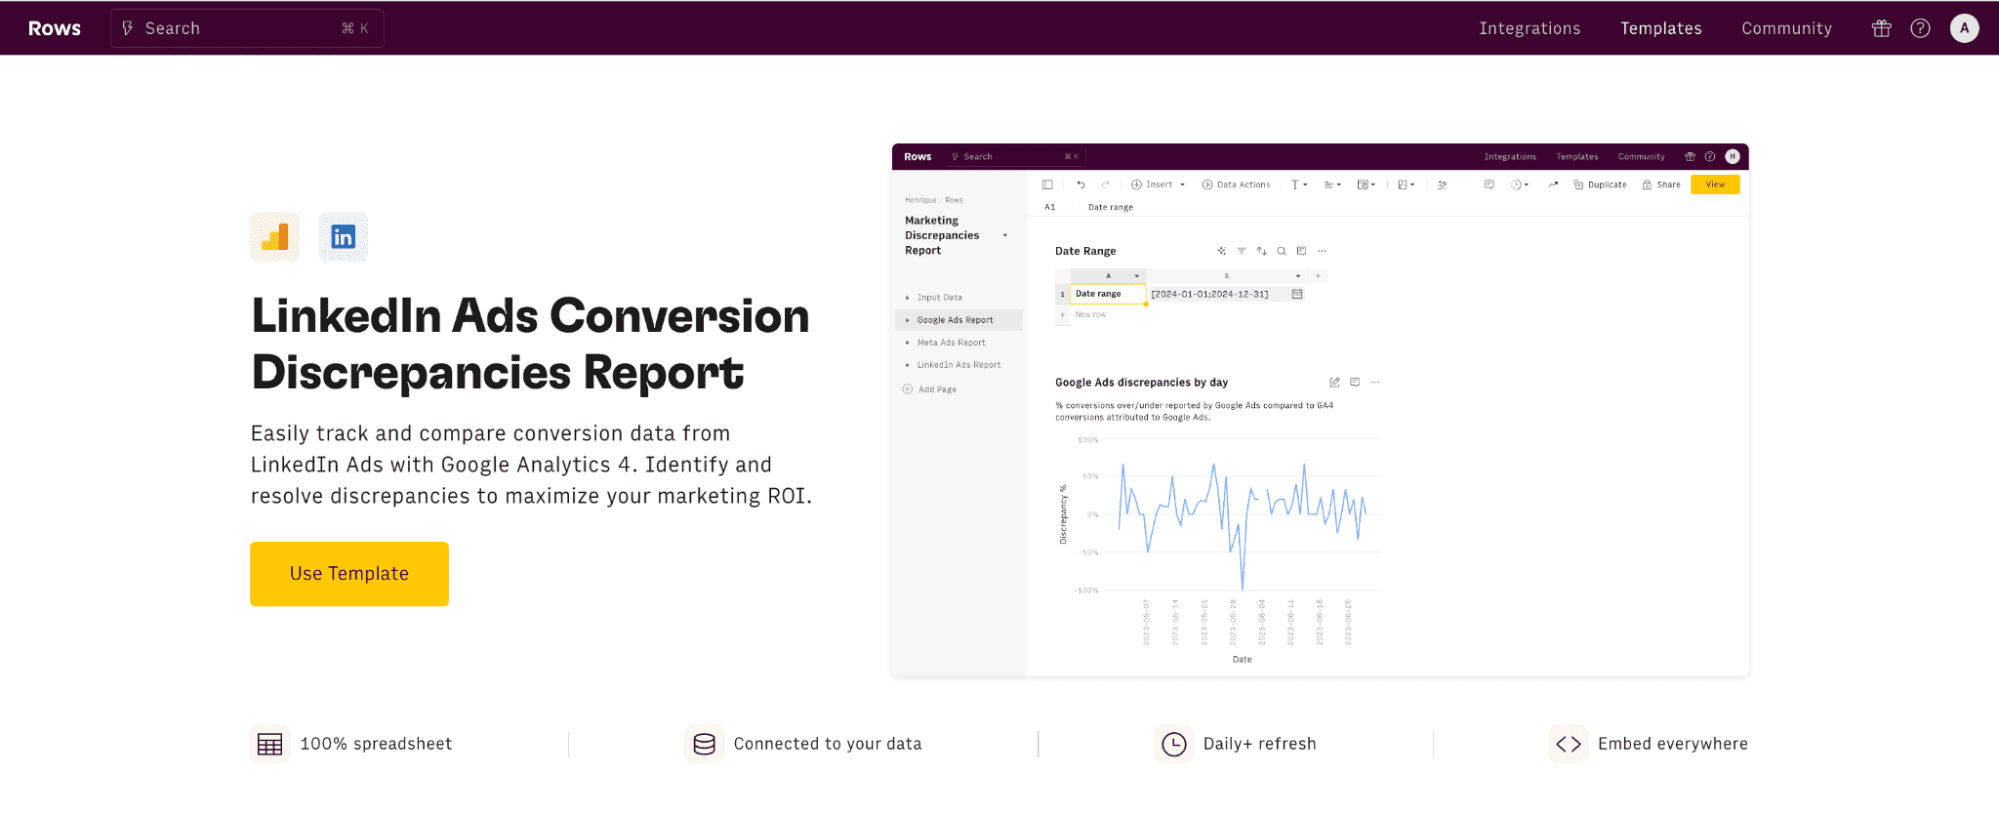
To address the challenge of mismatched conversion data, we've developed the LinkedIn Ads Conversion Discrepancies Report template using Rows.
This powerful spreadsheet automates the process of comparing conversion metrics between LinkedIn Ads and Google Analytics, saving you hours of manual work and reducing the risk of human error.
Step 1: Setup and Configuration
Access the template: Navigate to the Rows template page and click on "Use Template." Then, pick a folder and save it to your workspace.
Connect your accounts: Link your Google Analytics and LinkedIn Ads accounts following the provided instructions.
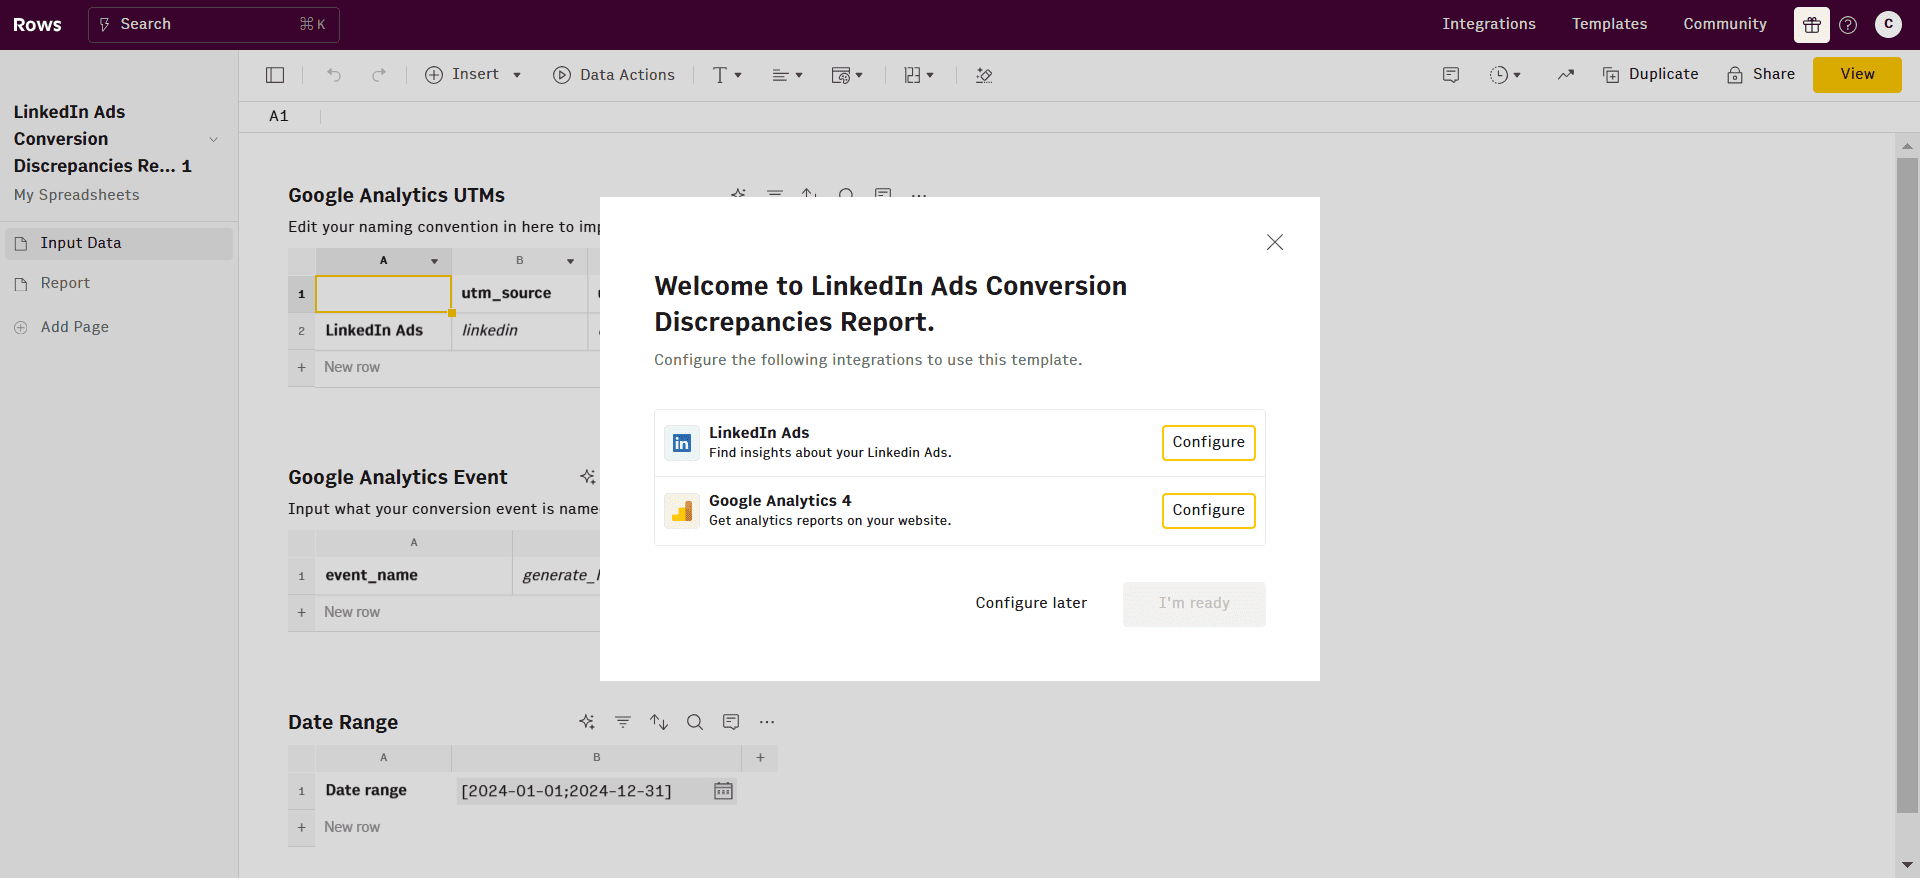
In the Setup page, configure the parameters:
Define your date range for analysis
Input your specific UTM parameters for utm_source and utm_medium
Specify the conversion event you want to track (e.g., "form_submission")
Step 2: Data Analysis
Once configured, the template populates automatically with data from both platforms. The Report page consists of four key components:
Google Analytics Data Table: Daily conversion data from Google Analytics
LinkedIn Ads Data Table: Daily conversion data from LinkedIn Ads
Consolidated Data Table: Side-by-side comparison highlighting disparities
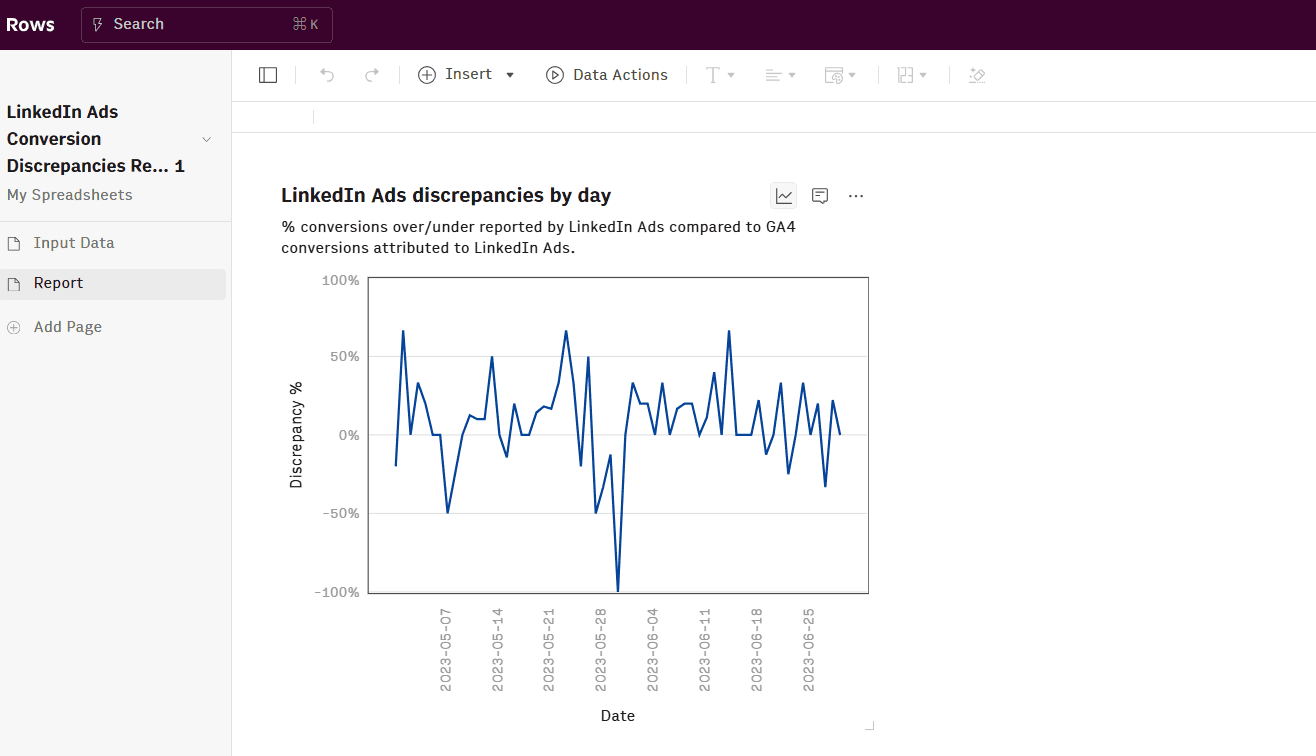
Disparity Trend Graph: Visual representation of daily differences over time
Step 3: Interpreting Results and Taking Action
With your data now visualized, it's time to dig into the analysis:
Examine individual tables: Look for anomalies or unusual conversion numbers.
Focus on the consolidated table: Pay attention to days with significant disparities.
Study the trend graph: Identify patterns, trends, or specific days with notable discrepancies.
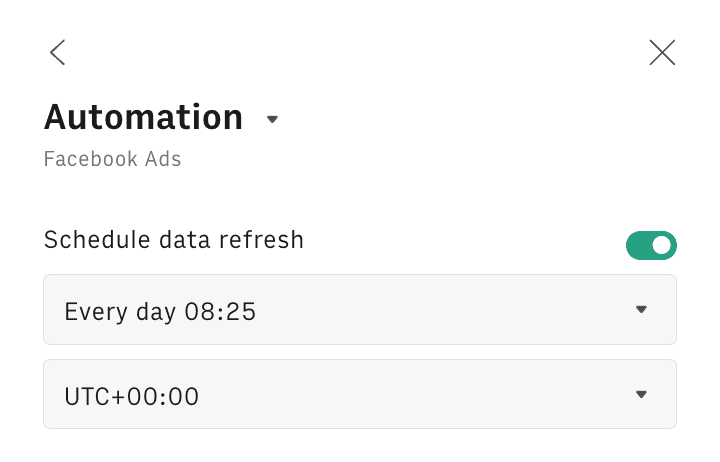
It's also important to note that you can set up regular data refreshes. Rows allow you to schedule automatic data refreshes. Set up daily or weekly updates to ensure you always use current data.
To do so, click the Options menu (...) on both data tables and pick 'Edit Data Table'. Then select the Automation table and toggle on the refresh, as follows:
Based on your findings, take informed action:
Investigate major disparities: Dig into specific campaigns or ad groups running during periods of significant discrepancy.
Review tracking setup: Double-check your LinkedIn Ads conversion tracking and Google Analytics event configuration.
Refine campaigns: Optimize targeting, ad creatives, or landing pages based on your insights.
Adjust reporting methods: Be transparent about known disparities when presenting results to stakeholders.
How To Find and Set an Attribution Model For Your Conversions In LinkedIn Ads
Attribution modeling allows you to credit the channels and touchpoints throughout the buyer's journey that converted a lead into a buying customer.
For most LinkedIn conversion types, the major attribution model is last-touch. There's also the first-touch model, making it two major models.
According to LinkedIn, the last-touch attribution model means that if a member converts multiple times within the conversion window, we'll count it as a single conversion. The conversion will be attributed to that member's most recent ad click or view.
Last-Touch Attribution As mentioned, the last-touch model attributes the conversion to the last ad that the potential customer clicked or viewed before converting. This model is prevalent and more effective because it provides a direct link between viewing an ad and taking an action, making it straightforward.
This model is valuable for campaigns where the final click is likely to be the decisive factor in driving the conversion.
First-Touch Attribution In contrast to last-touch, first-touch attribution credits the first interaction a customer has with your brand. This model is particularly useful for evaluating which campaigns are most effective at generating awareness and initiating customer interest.
You'll need to access your campaign manager to find and set an attribution model for your LinkedIn Ads. Here’s how you can navigate this:
Step 1: Access Your Campaign Performance Reports
The first step is to set an attribution model is to go to your LinkedIn Campaign Manager and select the account associated with your campaigns.
Step 2: Adjusting Conversion Settings
Within the campaign manager, navigate to the 'Account Assets' and select 'Conversion Tracking'. Here you will see options to configure the settings for how conversions are tracked, including the ability to change the attribution model.
Step 3: Customize Based on Needs
When selecting an attribution model, consider what you need to learn from your data. If brand awareness is your goal, a first-touch model might be best. If sales are your main aim, go for the last-touch attribution model.
Read more: How to Check Conversion Discrepancies between LinkedIn Ads and Google Analytics in 2025
Start tracking your LinkedIn Ads with Rows
Now that you've learned how to set up conversion tracking for your LinkedIn Ads, the next step is to set up a comprehensive LinkedIn Ads dashboard for your business.
Our LinkedIn Ads Dashboard template is designed to provide you with a comprehensive overview of your LinkedIn advertising efforts. This powerful tool simplifies your LinkedIn reporting by offering high-level period summaries, including the number of campaigns, total spend, clicks, and cost-per-click (CPC).
