Intro
Today, with a valuation of over $70bn and almost $6bn in revenue, Airbnb is the dominant player in the industry of short-term hospitality. The company has reinvented the market, taking it back when people used to host travelers at home, disrupted the hotel industry, and unlocked incomes for property owners all over the world.
Several elements have contributed to this incredible success, including a hacking attitude, a strong bias to action, and a trial and error mentality. The growth team at Airbnb conducted many so-called growth experiments, which are nothing but a scientific approach to testing and implementing a diverse pool of tactics aimed at cracking the scaling process of your business.
In 2010, they built a bot that visited Craiglist - a competitor platform -, grabbed URLs, and eventually nudged Craigslist users offering to host their property for free on Airbnb. Almost immediately, Craiglist users started preferring Airbnb, and the website gained massive organic traffic.
This example, with many others, shows how important is to try it out while keeping a rigorous approach to tests: from setting a hypothesis to executing it and collecting results.
In this short guide, we’ll show you how to use Rows to plan and keep track of all your growth experiments.
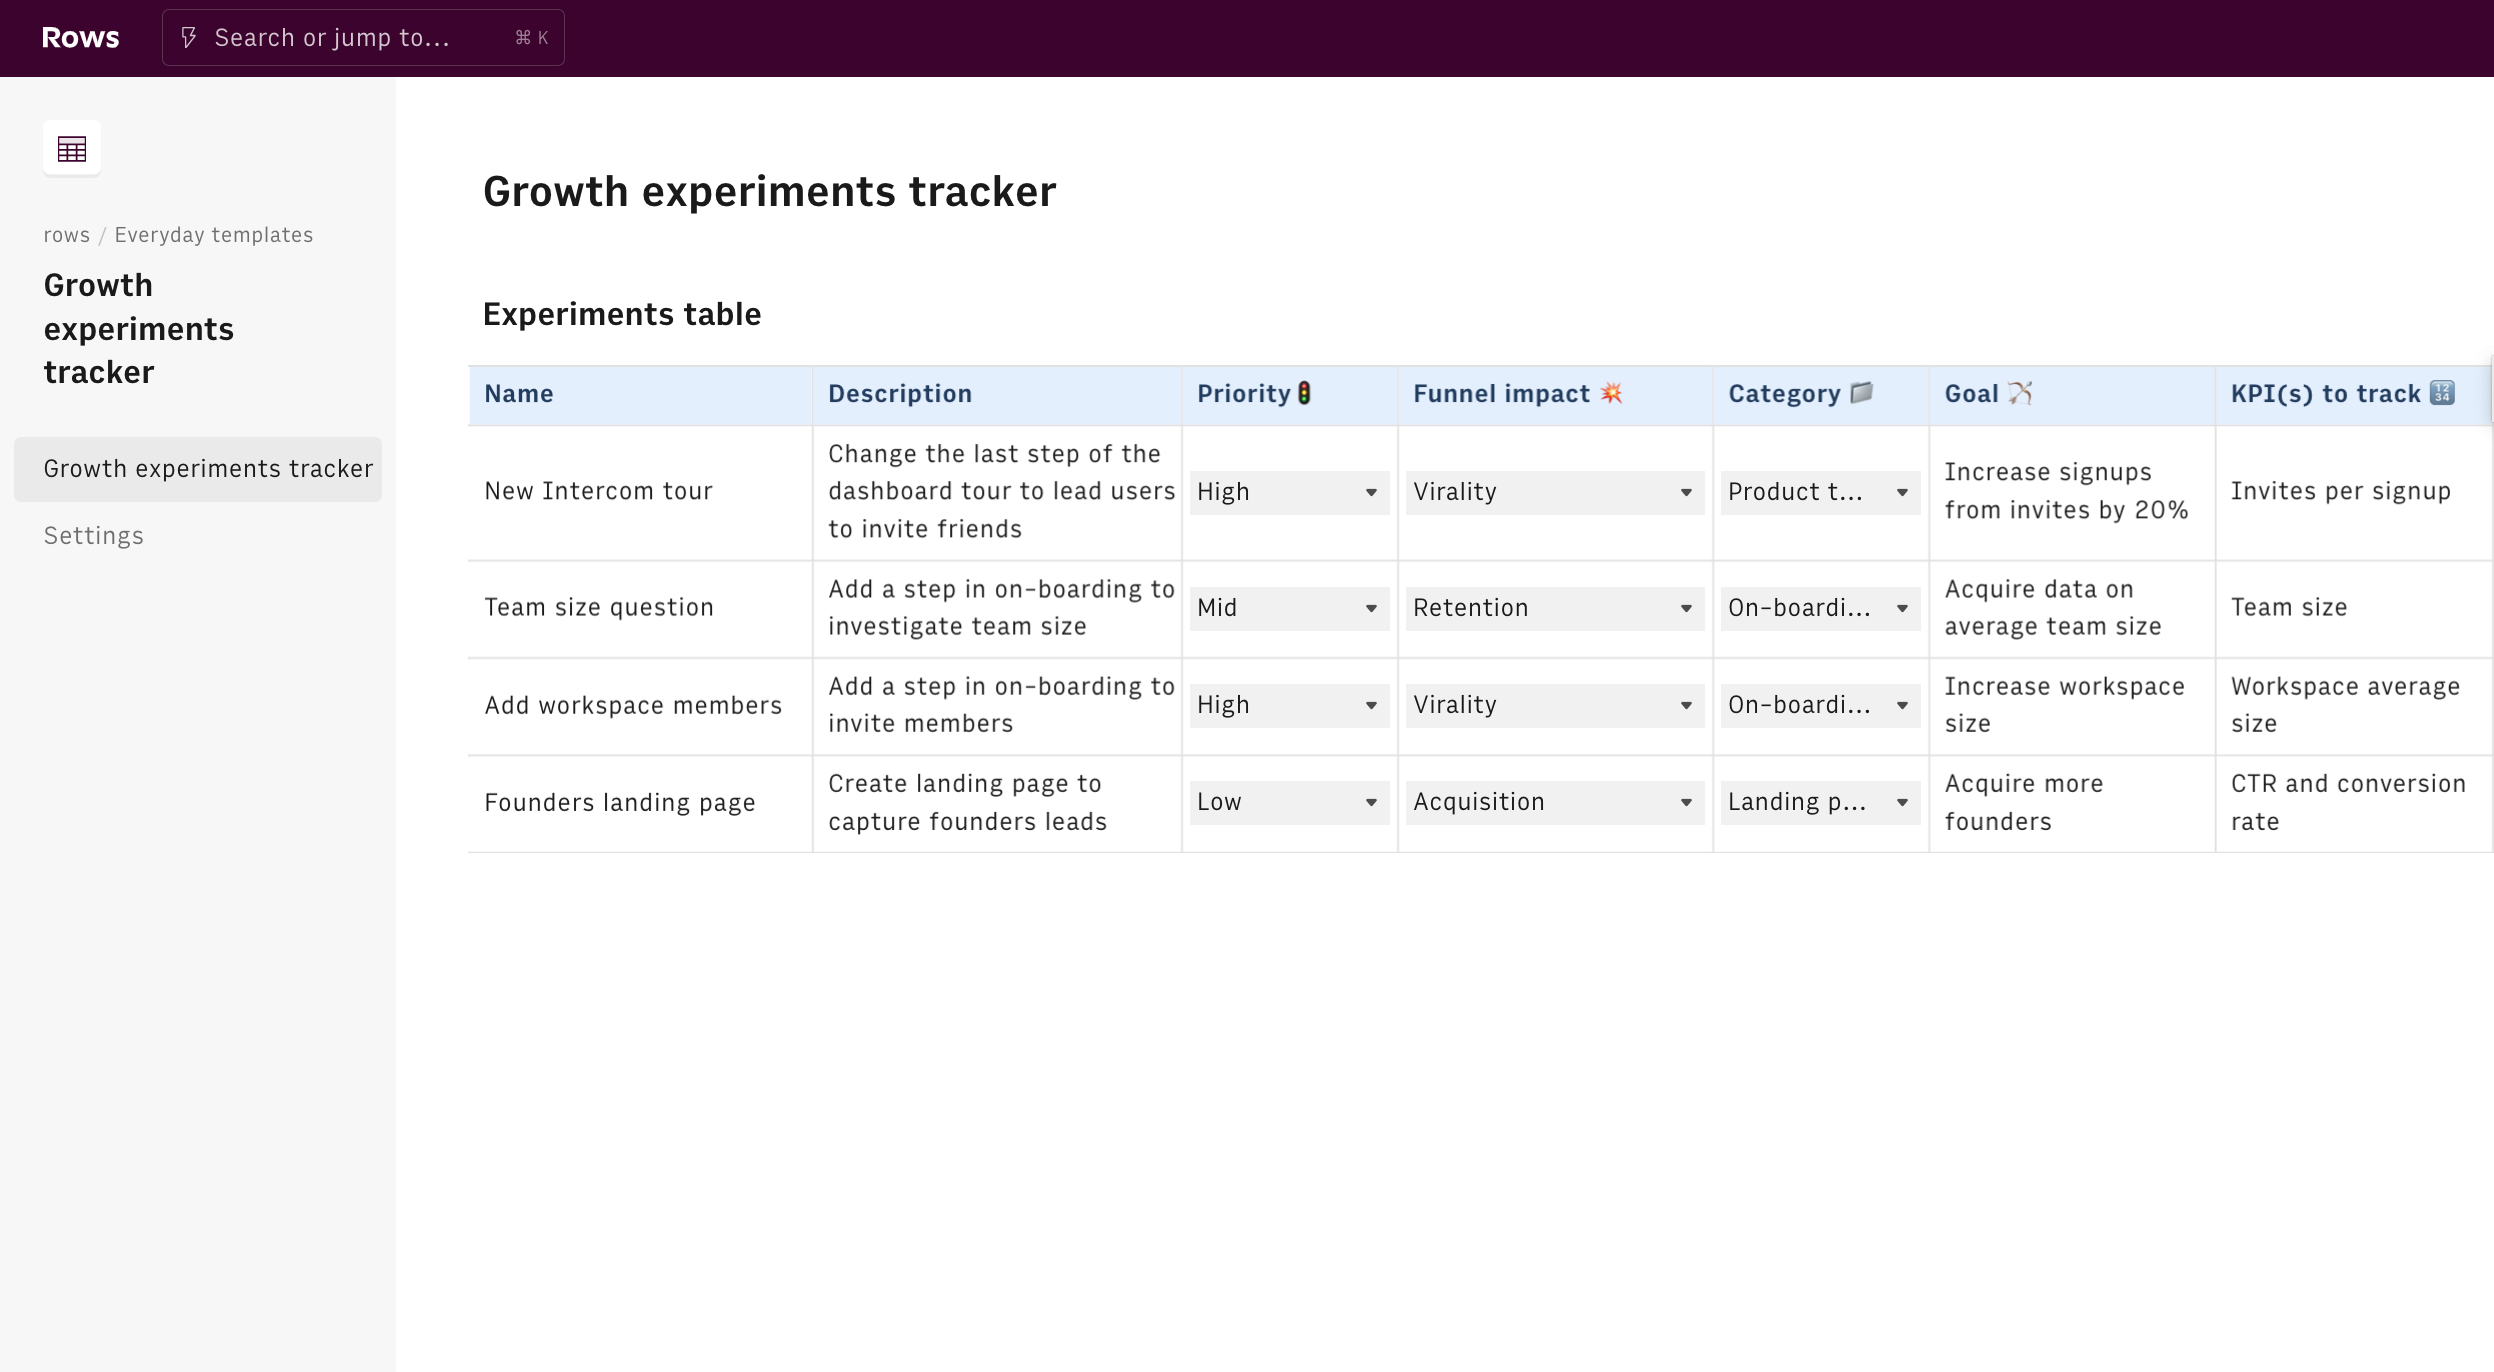
Here’s a sneak peek of what you will get:
Let's start!
To use our template, follow the link Growth Experiments tracker, click on Use template and save it in one of your workspace’s folders.
This template offers you an easy UI to plan and keep track of your growth experiments.
Let's reverse-engineer it together.
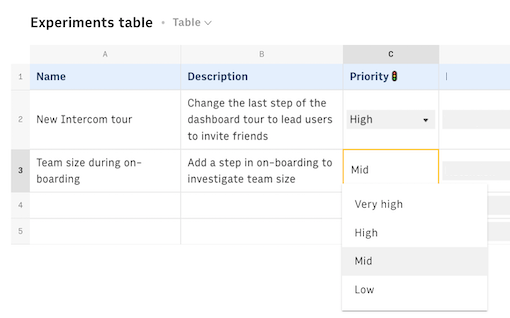
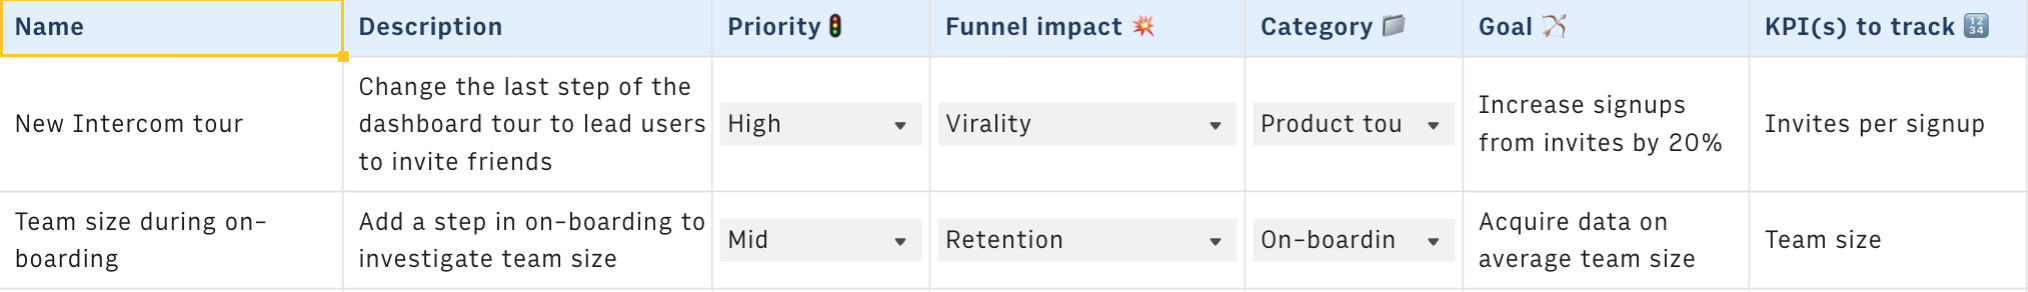
Use columns A and C to title, describe and set a priority for your experiment, whether it is a change in your product tour, or adding a new step in your onboarding.
Columns D and E help you to classify the experiment by choosing the portion of the user journey impacted, i.e. retention, onboarding, revenue, etc and the category to which it belongs, i.e. survey, email, product tour, etc.
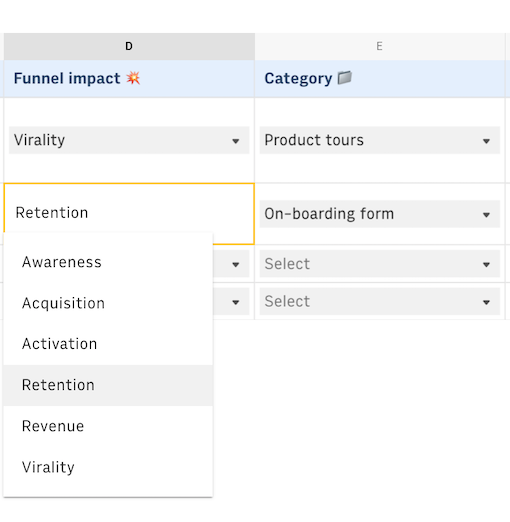
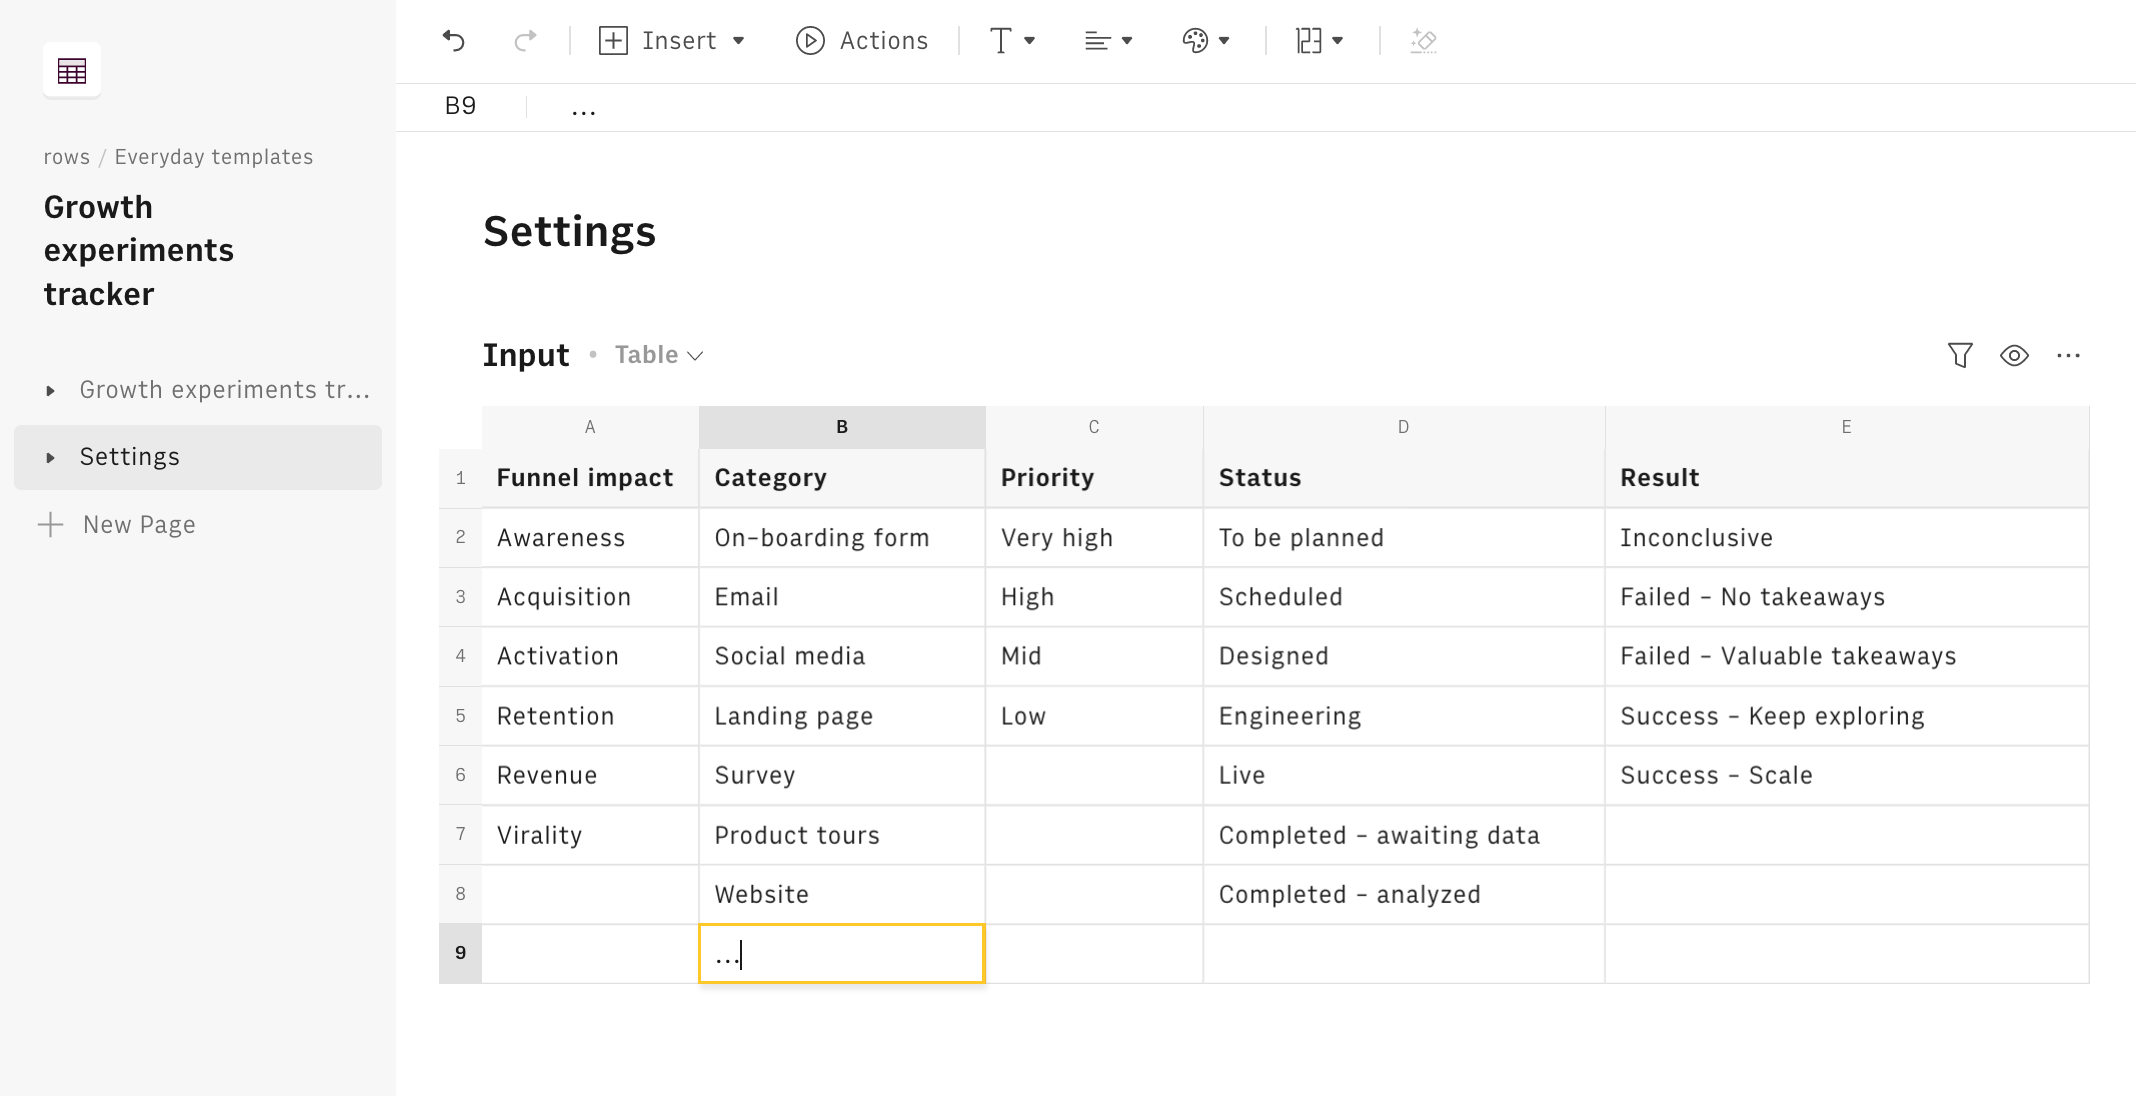
All dropdown lists can be personalized with custom inputs in the 'Settings' page, to best fit your internal processes and organization. Just add or edit any content of the cell, and the new item will appear in the respectve dropdown.
Columns F and G are meant to enclose the goal and the KPI(s) to monitor to evaluate the success of the experiment. This is probably the most important element to keep in mind even before starting the experiment: you need to ask yourself, where does this experiment lead to? Which specific metric will be impacted? is it relevant enough to our company goals?
The remaining columns help you track the project management components of your experiments, such as setting the owner, the time frame, the status, or linking any document you are using to keep extensive notes about the experiment.
Embed into documents
Finally, if you are using Notion or any other internal tools that support iframes to build a report, you can embed any table or chart of this spreadsheet in your document. Just click on the ... icon in the top right corner of any table or chart and pick Embed. A modal will open, as follows:
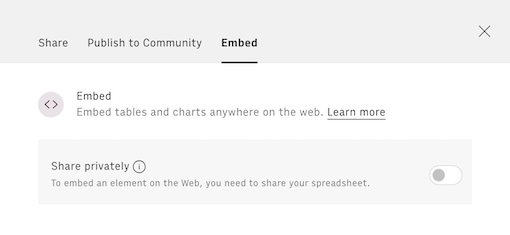
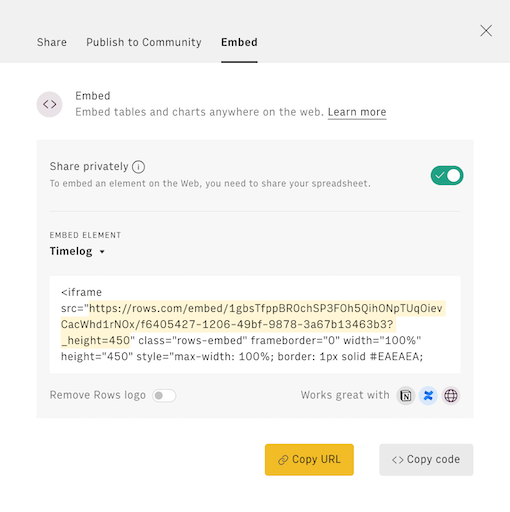
Before embedding, you need to grant access to it. To do so, toggle on the Share privately option and then hit the Copy URL button: your element is now ready to be pasted into your favorite tool.
This is how Rows embed looks on Notion:
You might also like
Check also
Interested in growth marketing? Discover other guides:
- Monitoring your growth experiments with Google Analytics
- Enriching a leads list and automating uploads to CRM
Discover our Marketing playbook.