Intro
Back in 2006, Amazon found that 1 additional millisecond in their pages' load time could cost them $1 million in revenue. This has quickly become one of the most referenced data points when claiming the importance of page load performance.
In the last few years, Google kept increasing the relative weight of website performance in ranking domains, making the engineering and data investment in light, flexible and responsive code even more important.
In this short guide, we’ll walk you through everything you need to generate a detailed audit report of your website load performance with Google PageSpeed, all in a spreadsheet.
Here’s a sneak peek of what you’ll get:
What is Google PageSpeed
Google PageSpeed executes a real-live test browsing session to measure the main loading performance indicators of any webpage. The overall score gives you a glimpse of how fast a webpage can load its content.
The tracked metrics include:
- First Contentful Paint (FCP), the time the page takes to render any part on the screen
- First Input Delay (FID), the time the page takes to process the event in response to the first user interaction, e.g. click on a link or tap on a button
- Large Contentful Paint (LCP), the time the page takes to render the biggest object - text block or image - on the page, visible within the viewport. This is one of the most user-centric metrics for measuring the perceived load speed
- Cumulative Layout Shift (CLS) measures the largest burst of layout shift scores for every unexpected layout shift that occurs during the entire lifespan of a page. A layout shift occurs any time a visible element changes its position from one rendered frame to the next
- Interaction to Next Paint (INP) measures the overall responsiveness of a webpage, by computing all click, tap, and keyboard interactions
- Time to First Byte (TTFB), the time the page takes to process a request for a resource and deliver the first byte. It helps identify how responsive your connection configuration and web server are.
Google classifies the performance into three buckets: Good, Needs Improvement, or Poor, and sets the following thresholds:
| Metric | Good | Needs improvement | Poor |
|---|---|---|---|
| FCP | [0, 1800ms] | (1800ms, 3000ms] | over 3000ms |
| FID | [0, 100ms] | (100ms, 300ms] | over 300ms |
| LCP | [0, 2500ms] | (2500ms, 4000ms] | over 4000ms |
| CLS | [0, 0.1] | (0.1, 0.25] | over 0.25 |
| INP | [0, 200ms] | (200ms, 500ms] | over 500ms |
| TTFB | [0, 800ms] | (800ms, 1800ms] | over 1800ms |
Let's go!
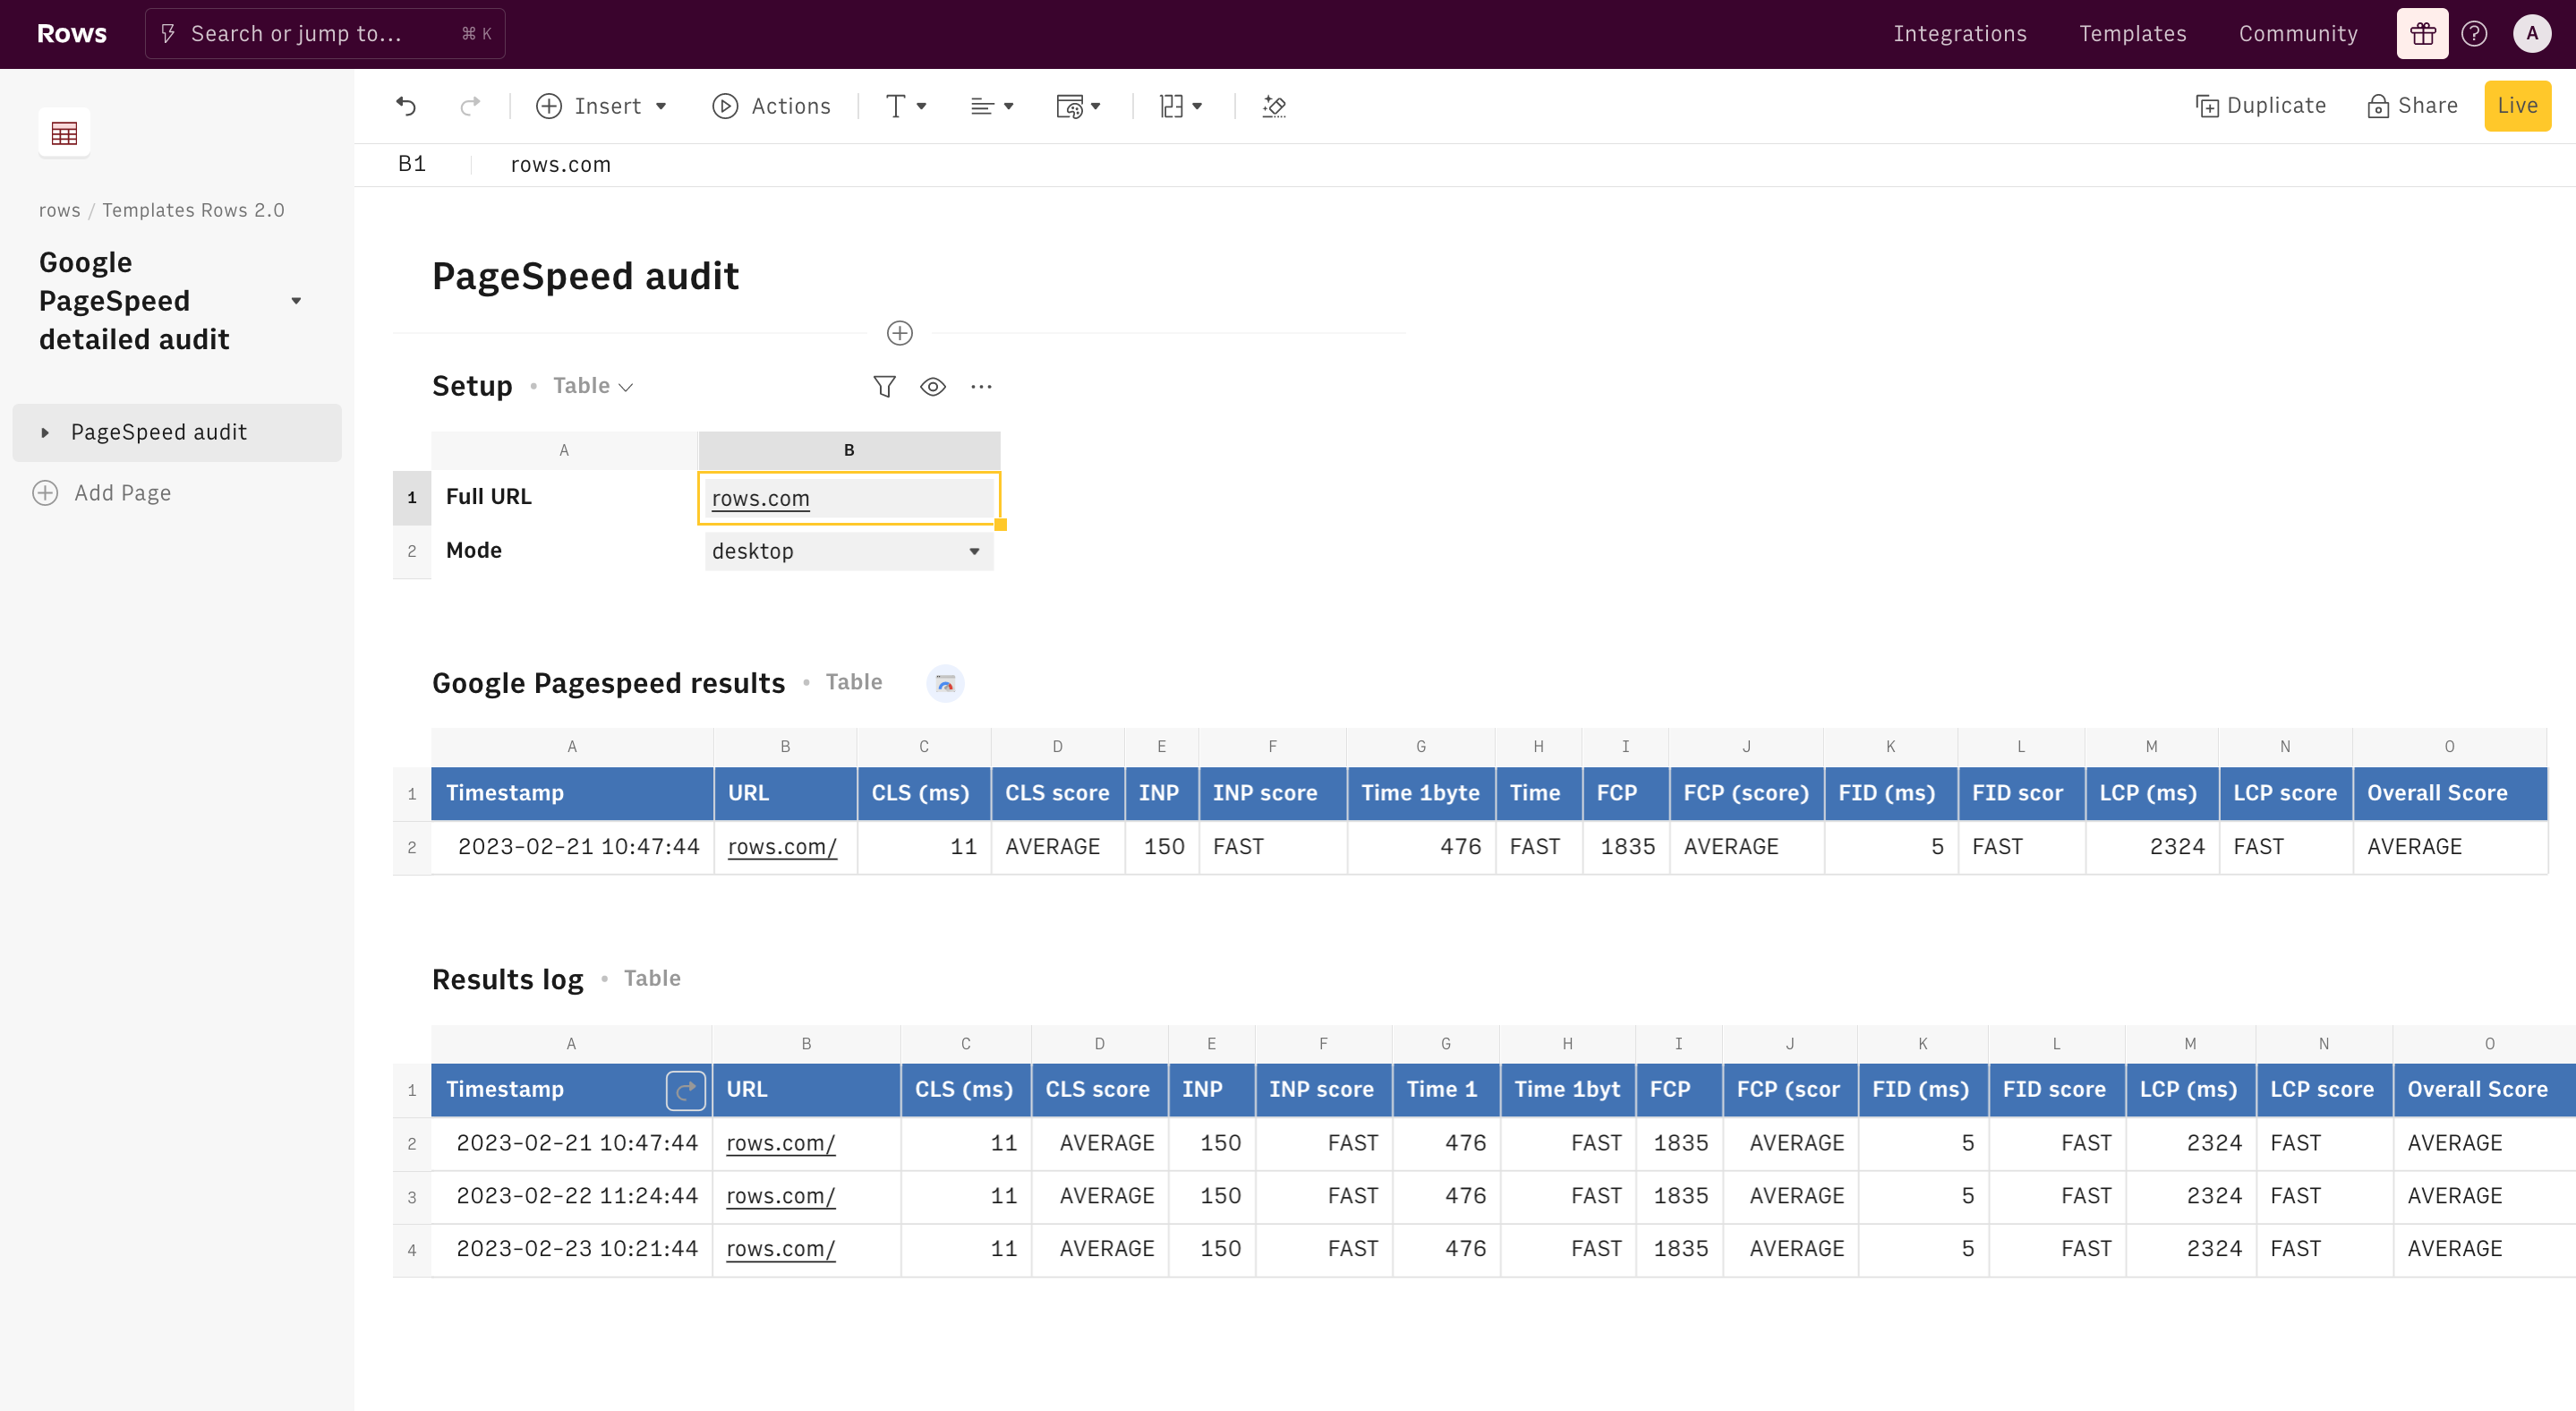
To understand how we’re going to use it, let’s go step by step. Use our template at the following link Google Pagespeed detailed audit and save it in one of your workspace’s folders.
This template allows you to run a detailed audit of any website loading performance.
Let's reverse-engineer it together.
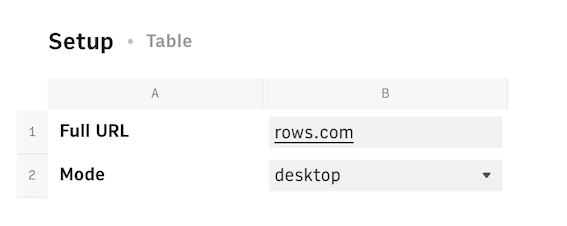
All you need to do is to enter the full URL of the website and pick the mode you want to check (desktop or mobile) respectively in cells B1 and B2 of the Setup table.
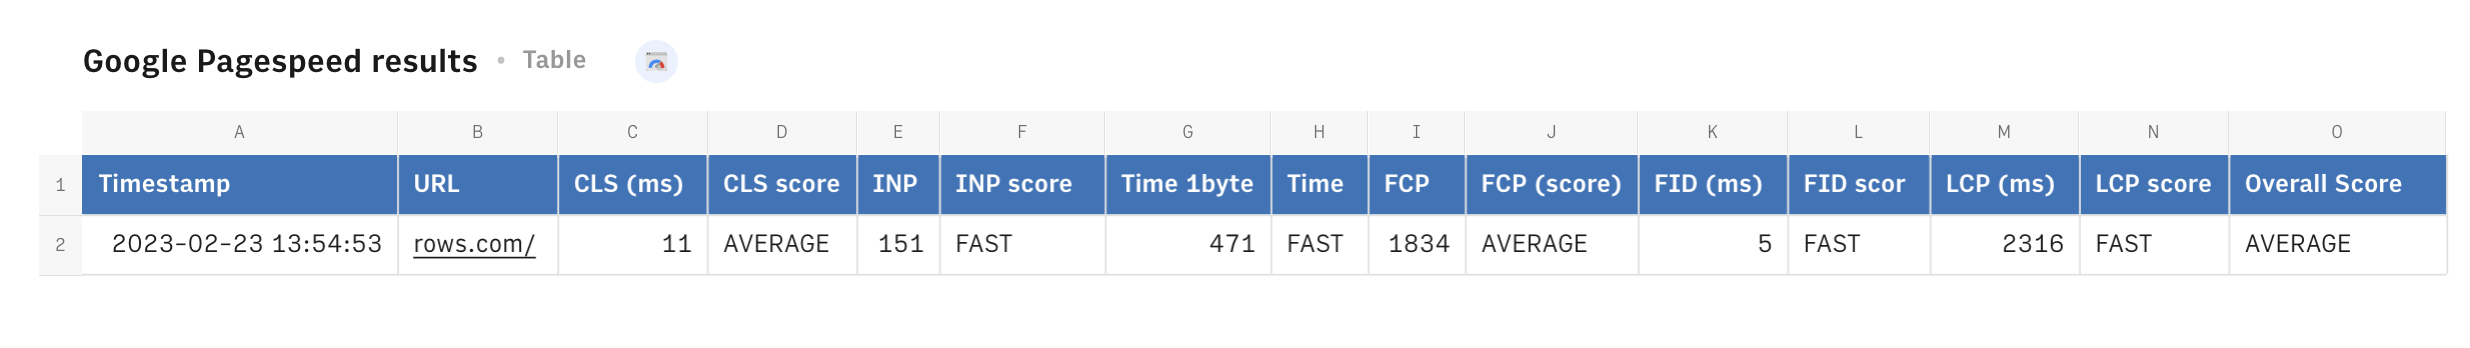
Please wait up to 25 seconds for the analysis to be completed. Once the audit is done, results will be displayed in the data table below. The table 'Google PageSpeed results' contains the parsed output of the audit, and is dynamically synced with Google Pagespeed.
The Results log table is designed to store the results of all tests executed.
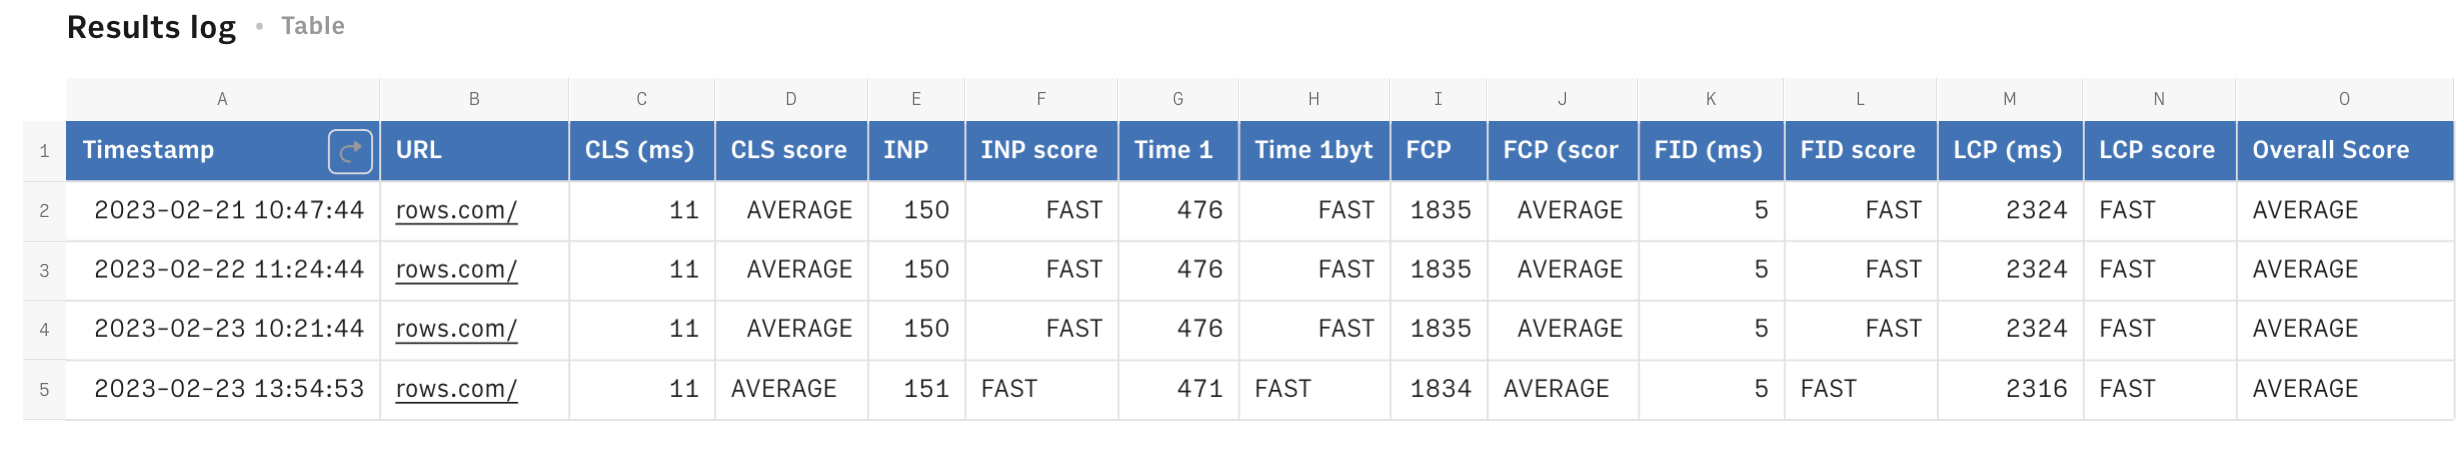
The UPDATE function in cell A1 populates the table by upserting the data generated by the audits, as follows:
1=UPDATE('Google Pagespeed results'!A1:O2,'Google Pagespeed results'!A1:B1)Its mandatory arguments include:
- the data you want to upsert, including the header. Here is the output of the PageSpeed audit: range A1:M2 of the Pagespeed result table.
- the keys, i.e. the values Rows will check against before allowing for the update. Here, the date and the URL.
- the destination table's header. Here the log table (range
'Results log'!A1:M1).
Schedule automation
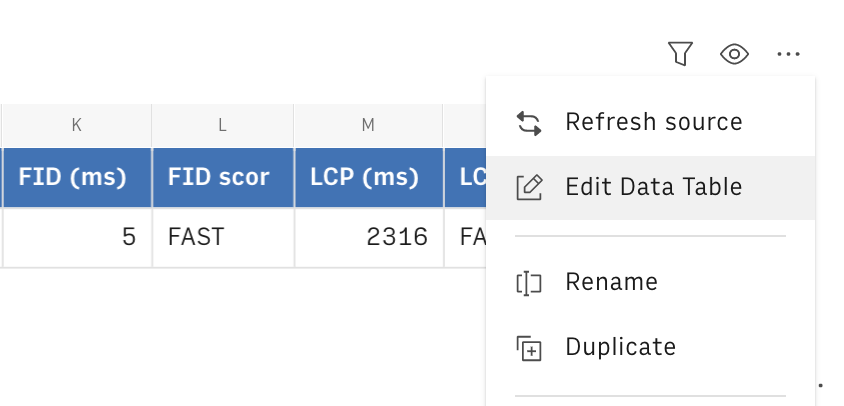
Instead of coming back to the spreadsheet and triggering the function manually, by hitting Enter in the Full URL field, you can set up a Refresh Schedule in Pagespeed Data Table: to do it, just open the option menu in the table's top right corner ... and click on Edit Table
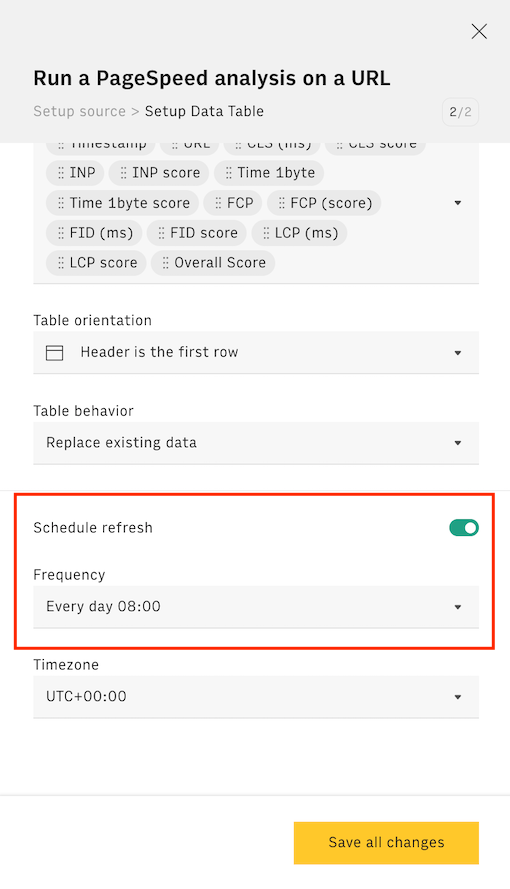
The switch on the toggle and choose a frequency (e.g. every day 08:00)
Embed into documents
Finally, if you are using Notion or any other internal tools that support iframes to build a report, you can embed any table or chart of this spreadsheet in your document. Just click on the ... icon in the top right corner of any table or chart and pick Embed. A modal will open, as follows:
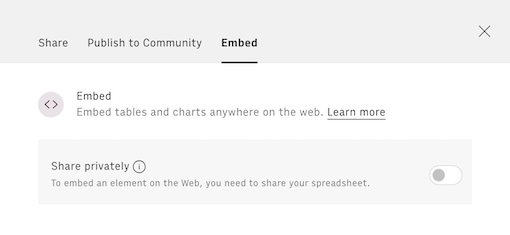
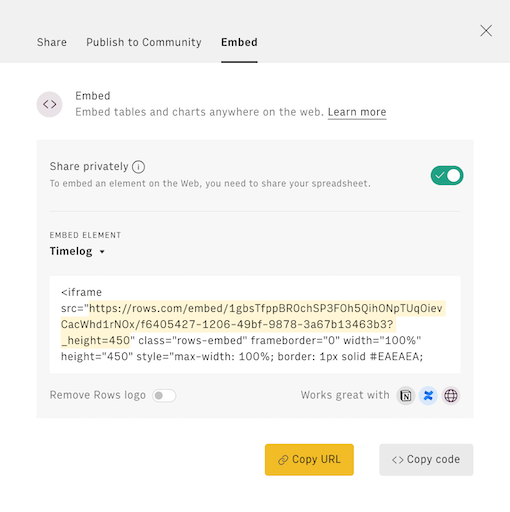
Before embedding, you need to grant access to it. To do so, toggle on the Share privately option and then hit the Copy URL button: your element is now ready to be pasted into your favorite tool.
This is how Rows embed looks on Notion:
You might also like
Check also
Obsessed with loading performances and SEO? Check out our guides:
- Tracking your competitors’ website loading performance with PageSpeed
- Monitoring your website search performance with Search Console
- Tracking keywords' performance with Search Console
- Planning link-building activity
- Tracking on-page SEO elements
Discover our Marketing playbook.