The Create Data Tables option lets you create Data Tables without writing any formulas. However, you might notice that these automatically generated Tables don’t always have the most optimal structure.
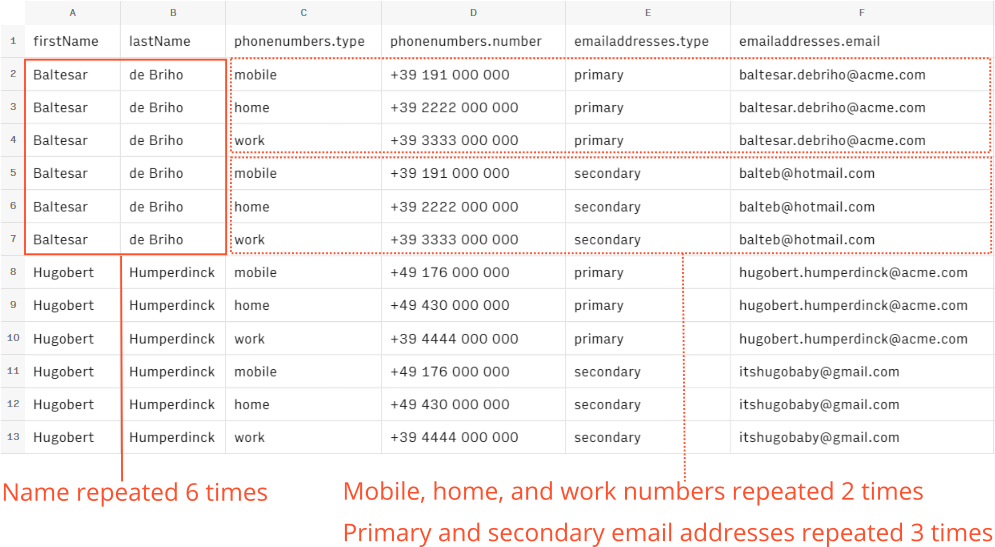
Let’s look at an example. Here’s a screenshot of a Data Table created from an query to an external service.

This is from a service that allows you to search for people’s contact details:
But look at all that duplication! Surely there’s a better way to display the data There is indeed a better way, you could display it like this.

This view was created by applying the FLATTEN function which we explain in a later section.
But first, let's understand why this duplication happens in the first place and when you might need to use functions such as FLATTEN and UNNEST.
When you create a standard Data Table, Rows automatically adds a special formula behind the scenes. If click the top-left cell, you’ll see the formula that's being used to convert the data into a Table.

The previous screenshot, you can see that the UNNEST and REMOVEARRAYS functions are being used in combination with EXPAND.
Don’t worry if you’ve never heard of these functions before, we’ll get to them in a minute. But first, it's important to understand why they're necessary.
The problem with nested data structures
When you pull data from an external service such as a contact details API, the data is usually provided in the JSON format. This format organizes data into hierarchies which makes it challenging to convert the data into a table. Whichever way you decide to do it, you’ll probably have to make some kind of compromise.
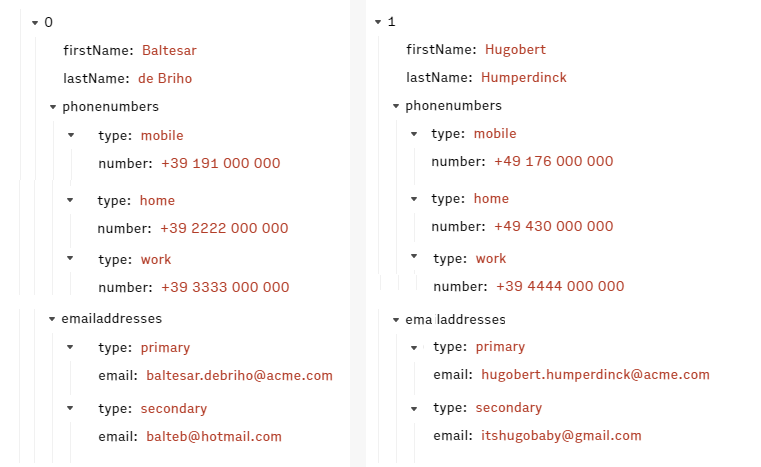
Here’s an example of the raw data before it was converted into the Data Table from the previous screenshot.

How do you turn this into a table? There are a couple of ways to do it. One way is to use the UNNEST function.
However, the UNNEST function can sometimes result in some duplicated data which we can see in the previous example.
Why UNNEST can cause duplicate rows
To understand why duplicate rows show up in our example, let’s look at the structure of the raw data has changed. As mentioned earlier, Data Tables use the UNNEST function to convert JSON data into a tabular format.
The following illustration shows how the data is structured before and after the UNNEST function is applied.

Before UNNEST was applied
There were data categories that had subcategories such as “phonenumber” which contains the subcategories. “type “ and “number”.
- In total, there are 4 subcategories:
1) phone number type, 2) email type, 3) phone number 4) email address.
After UNNEST was applied
After UNNEST, all subcategories are removed, and are converted into top-level categories such as phonenumber.number, phonenumber.type — these correspond to columns in a table.
- There are now 4 columns — one for each of the 4 top-level categories.
- There are now 6 rows — one for each combination of values such as home phone number and primary email.
These combinations are calculated by multiplying the variants for each subcategory together:- For “number type”, there are 3 variants:
1) mobile number, 2) home number 3) work number. - For “email type”, there are 2 variants:
1) primary email, 2) secondary email. - Therefore: 3 number types * 2 email types = 6 combinations/rows for one contact (which is why "Baltesar de Briho" is repeated 6 times).
- For “number type”, there are 3 variants:
So, what can you do about this? You can try to flatten the data by adding more columns instead of rows.
Reducing duplication with FLATTEN
You can solve this problem with a similar function called FLATTEN. This function tries to add more columns instead of adding more rows.
Here’s an example of what the data from our previous example looks like if we use FLATTEN instead of UNNEST.

Look at that! No more duplicate rows for each contact. But our table is now very wide because instead of 6 rows, we have 6 pairs of columns for each of our data variants (12 columns in total).
As you can see, how you handle duplication depends on the structure of your data and whether you prefer wider tables or taller tables.
- If your data contains data categories that have many subcategory variants (such as
"country": “america” { "state": "alabama"; "state": "alaska"- 48 more variants of
"state"), you’re probably better off sticking withUNNESTso that the variants are inserted into rows.
- 48 more variants of
- If your data contains a manageable number of subcategory variants (such as in our previous example), it might be better to put the variants in columns with
FLATTEN.