L’Oréal: Mastering SEO Reporting Across a Global Beauty Empire


While working at L'Oréal in the capacity of Head of Tech SEO, Andrea had the opportunity to manage a complex digital landscape spanning 374 websites across 13 brands. This wasn't just a challenge. It was a data conundrum.
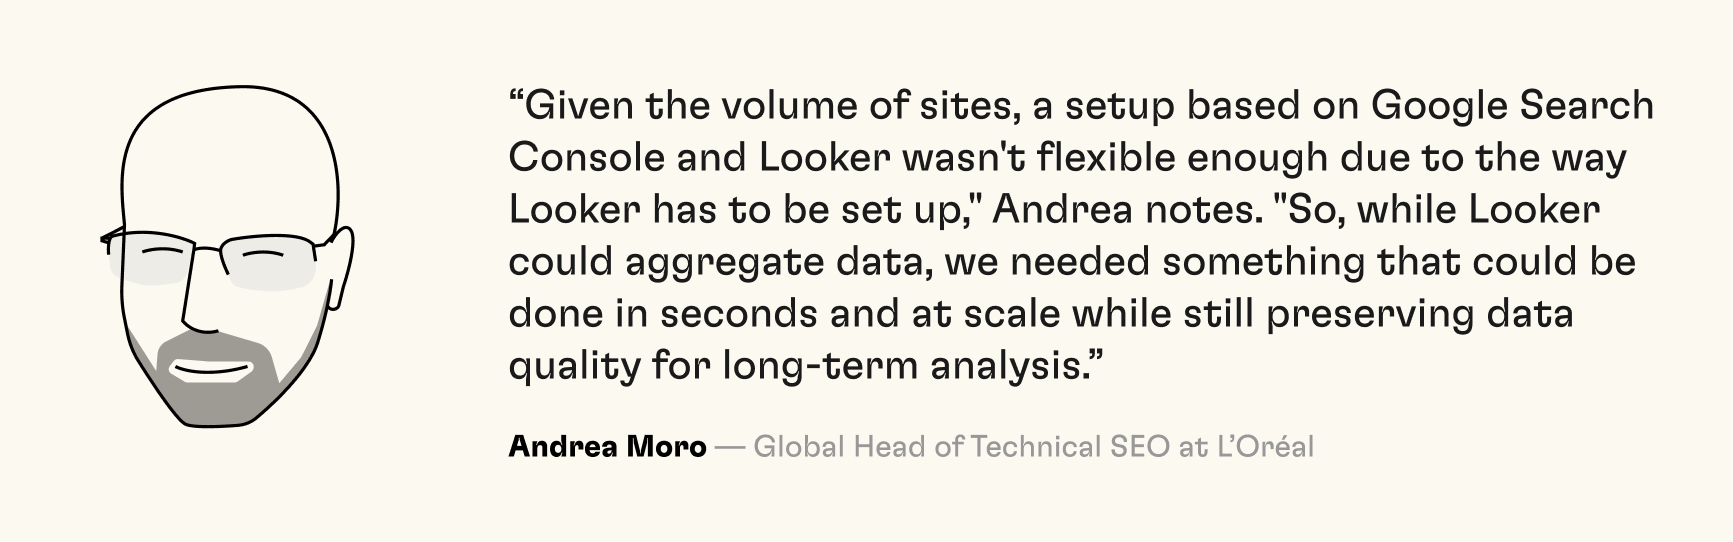
“We faced two significant challenges,” Andrea explains. “First, the sheer volume of our SEO data was immense, spread across hundreds of websites. Second, our existing data collection, while functional, was a bit demanding for rapid reporting. With such a broad digital footprint, we saw an opportunity to adopt a more agile solution — that could combine all our organic data in one place, making it easy to consume but also take action based on what we learn”.
But Andrea's needs went beyond just gathering recent data. They required a system that could unify data from multiple markets and brands while empowering his team making high-level checks where often Excel is involved, and for which multiple copy/paste would have been required.
Their search for a solution led them to Rows.com. Andrea stumbled upon Rows through a blog post about its Notion integration and was immediately intrigued by the possibility of combining the tools. The organic search data collection later presented was a natural consequence to start prototyping what today is getting considered for further development.
To avoid resistance, what played a role was the Rows guarantees on the highest standards of data security and encryption, ensuring that data is visible only to the owner and those with whom the document is shared, providing peace of mind for all users.
Building a SEO Dashboard for 370 domains
With Rows, L'Oréal's WSF SEO team tackled three key areas of optimization: (i) month-over-month performance tracking, (ii) geographic cannibalisation detection, and (iii) data reconciliation with third-party providers.
Here's how it all comes together:
Multi-Brand Performance Tracking
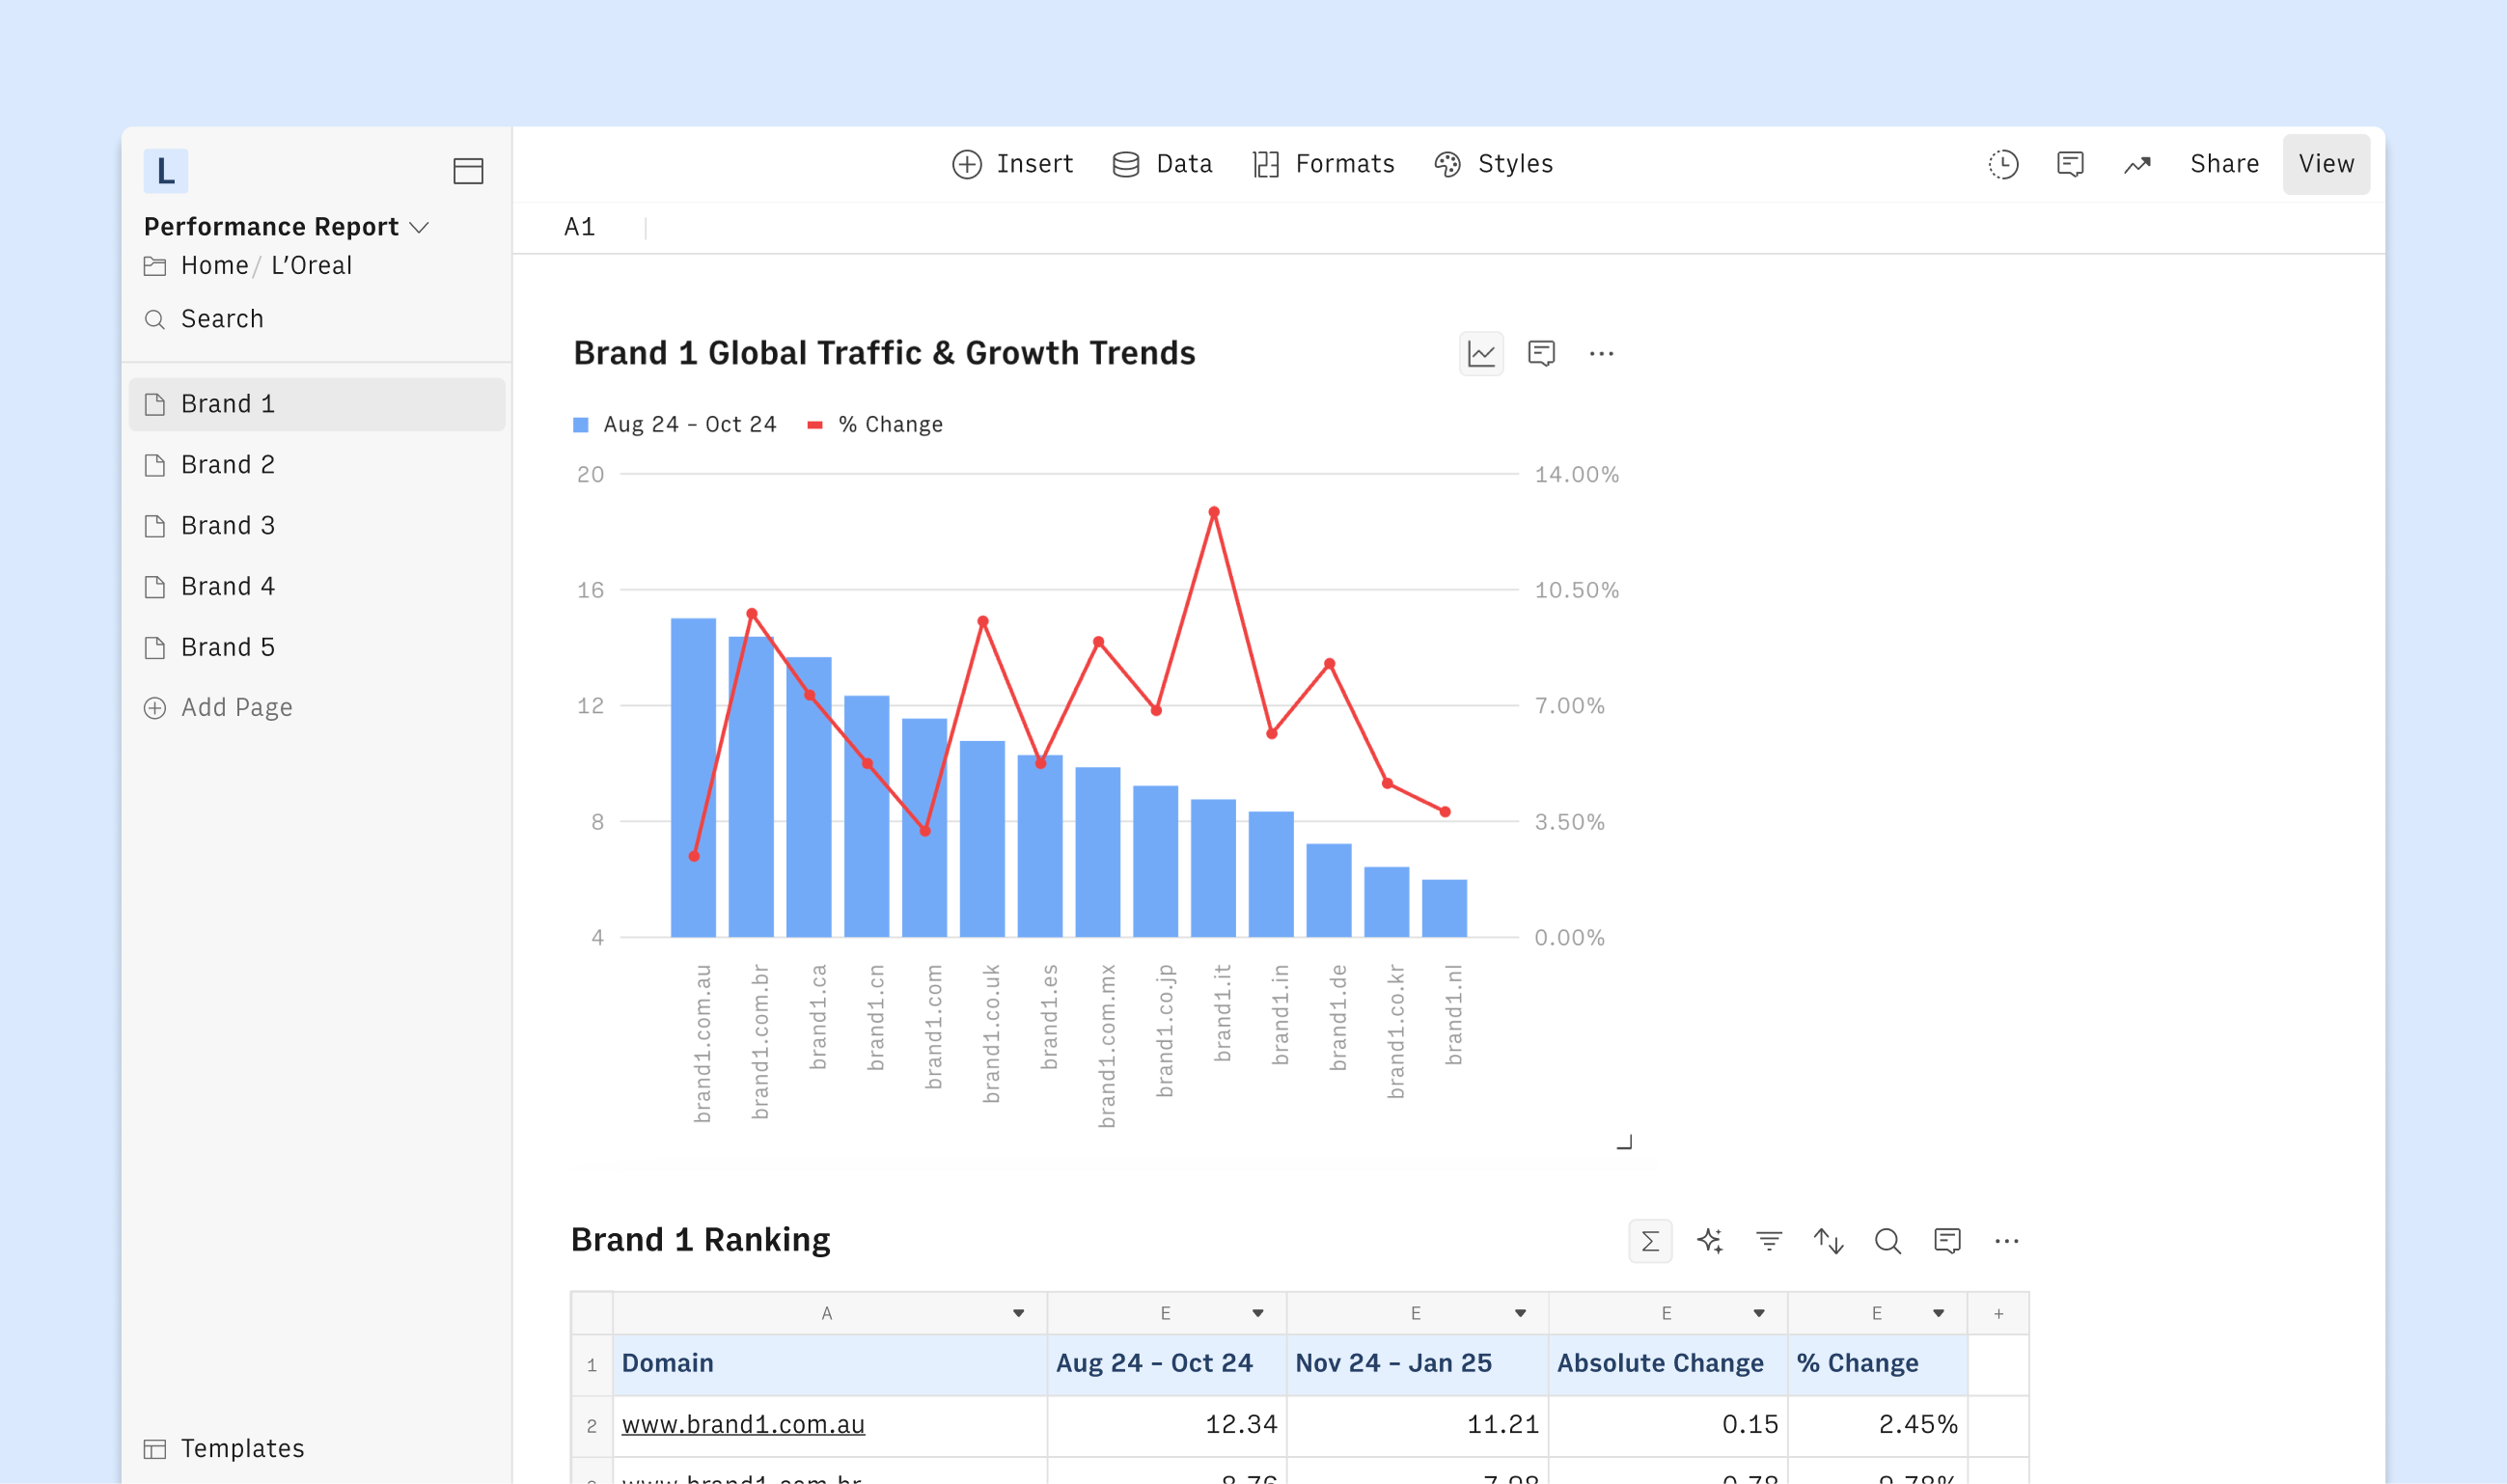
The team began by importing Google Search Console data into Rows to monitor changes across all websites and brands each month. Rows offered the flexibility to create custom visualizations like query-page tables, dropdown filters, and tailored charts that went beyond what GSC provided.
Andrea’s team structured their dashboard to include:
Brand-Specific Pages: Each brand has its own page with neatly organised tables and charts.
Interactive Drop-downs: These allow users to select specific domains and view SERP position trends over the past year.
Comprehensive Data Tables: Connected directly to GSC, these tables compare impressions and clicks over the previous two months.
Top Performers and Underperformers: Separate tables highlight the websites that saw the most significant gains and losses in impressions.
Charts: Pie charts show market-specific drops, while bar charts display increases or decreases in clicks and impressions for each website.
The magic? Automated updates that give Andrea's team a real-time view of their digital performance. Finally, Rows allows them to archive historical performance data, overcoming the limitations of Google Search Console.
Geographic Cannibalisation Detection
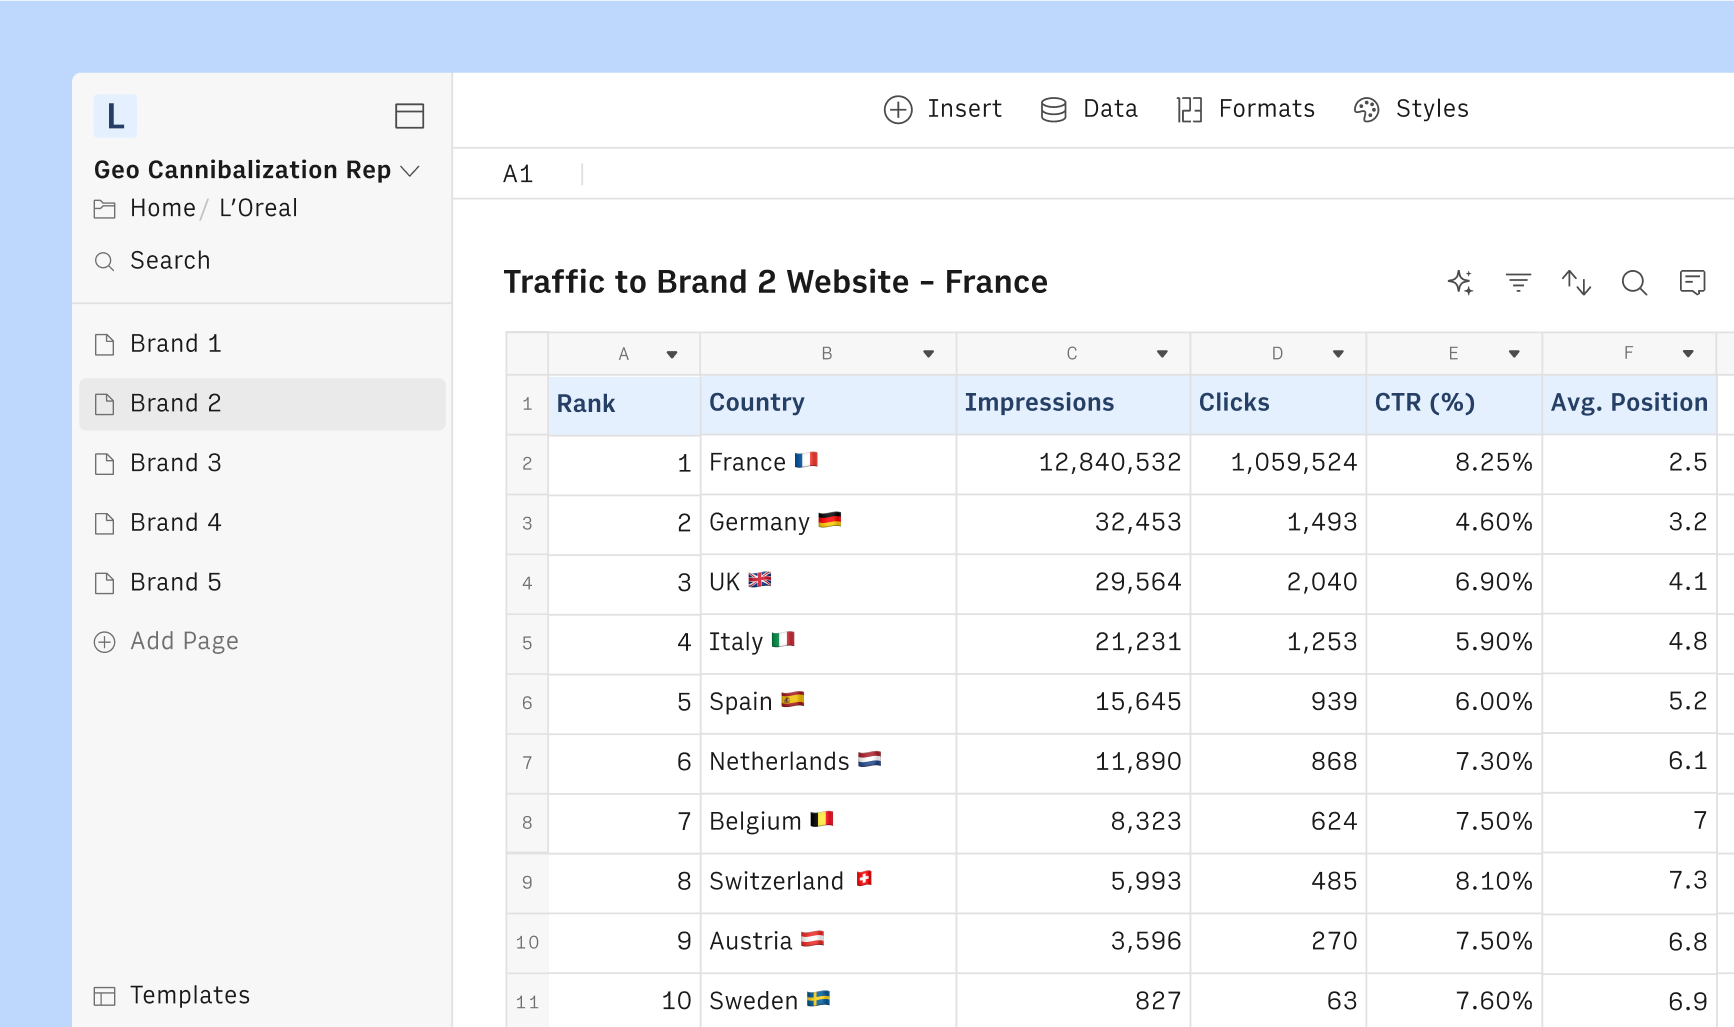
For a global brand, understanding how users from different regions interact with websites is crucial. Rows helped L'Oréal to track nuanced scenarios like Italian users landing on the UK websites for the same brand.
“We needed to analyse cases like Indian users landing on UK websites, for instance” Andrea explains. “Incorrect traffic distribution has negative effects on the user experience, but also does not help to determine correctly the performance of a website per set. Once again, having the raw data available and the possibility to play around with custom functions not available in other BI platforms made Rows a good asset to help us determine these patterns and prioritise actions.”
Rows makes it extra easy by offering a Data Table configuration that breaks down visitor data (impressions, clicks, and position) by country for each website. This way, it becomes easy to spot how many times a French website shows up in the SERP of a German user. Conditional formatting highlights the most severe discrepancies, which act as the starting point for Andrea’s team projects and team initiatives improve geo cannibalisation.
Advanced Data Integration
Andrea is what you might call the modern Marketing manager: equally comfortable directing the Tech SEO strategy for L'Oréal, digging deep into the data, or coding his way to a solution when necessary.
So much so that, before starting using Rows, he had even built and public API wrapper for Google Search Console (how many marketers could do that?).
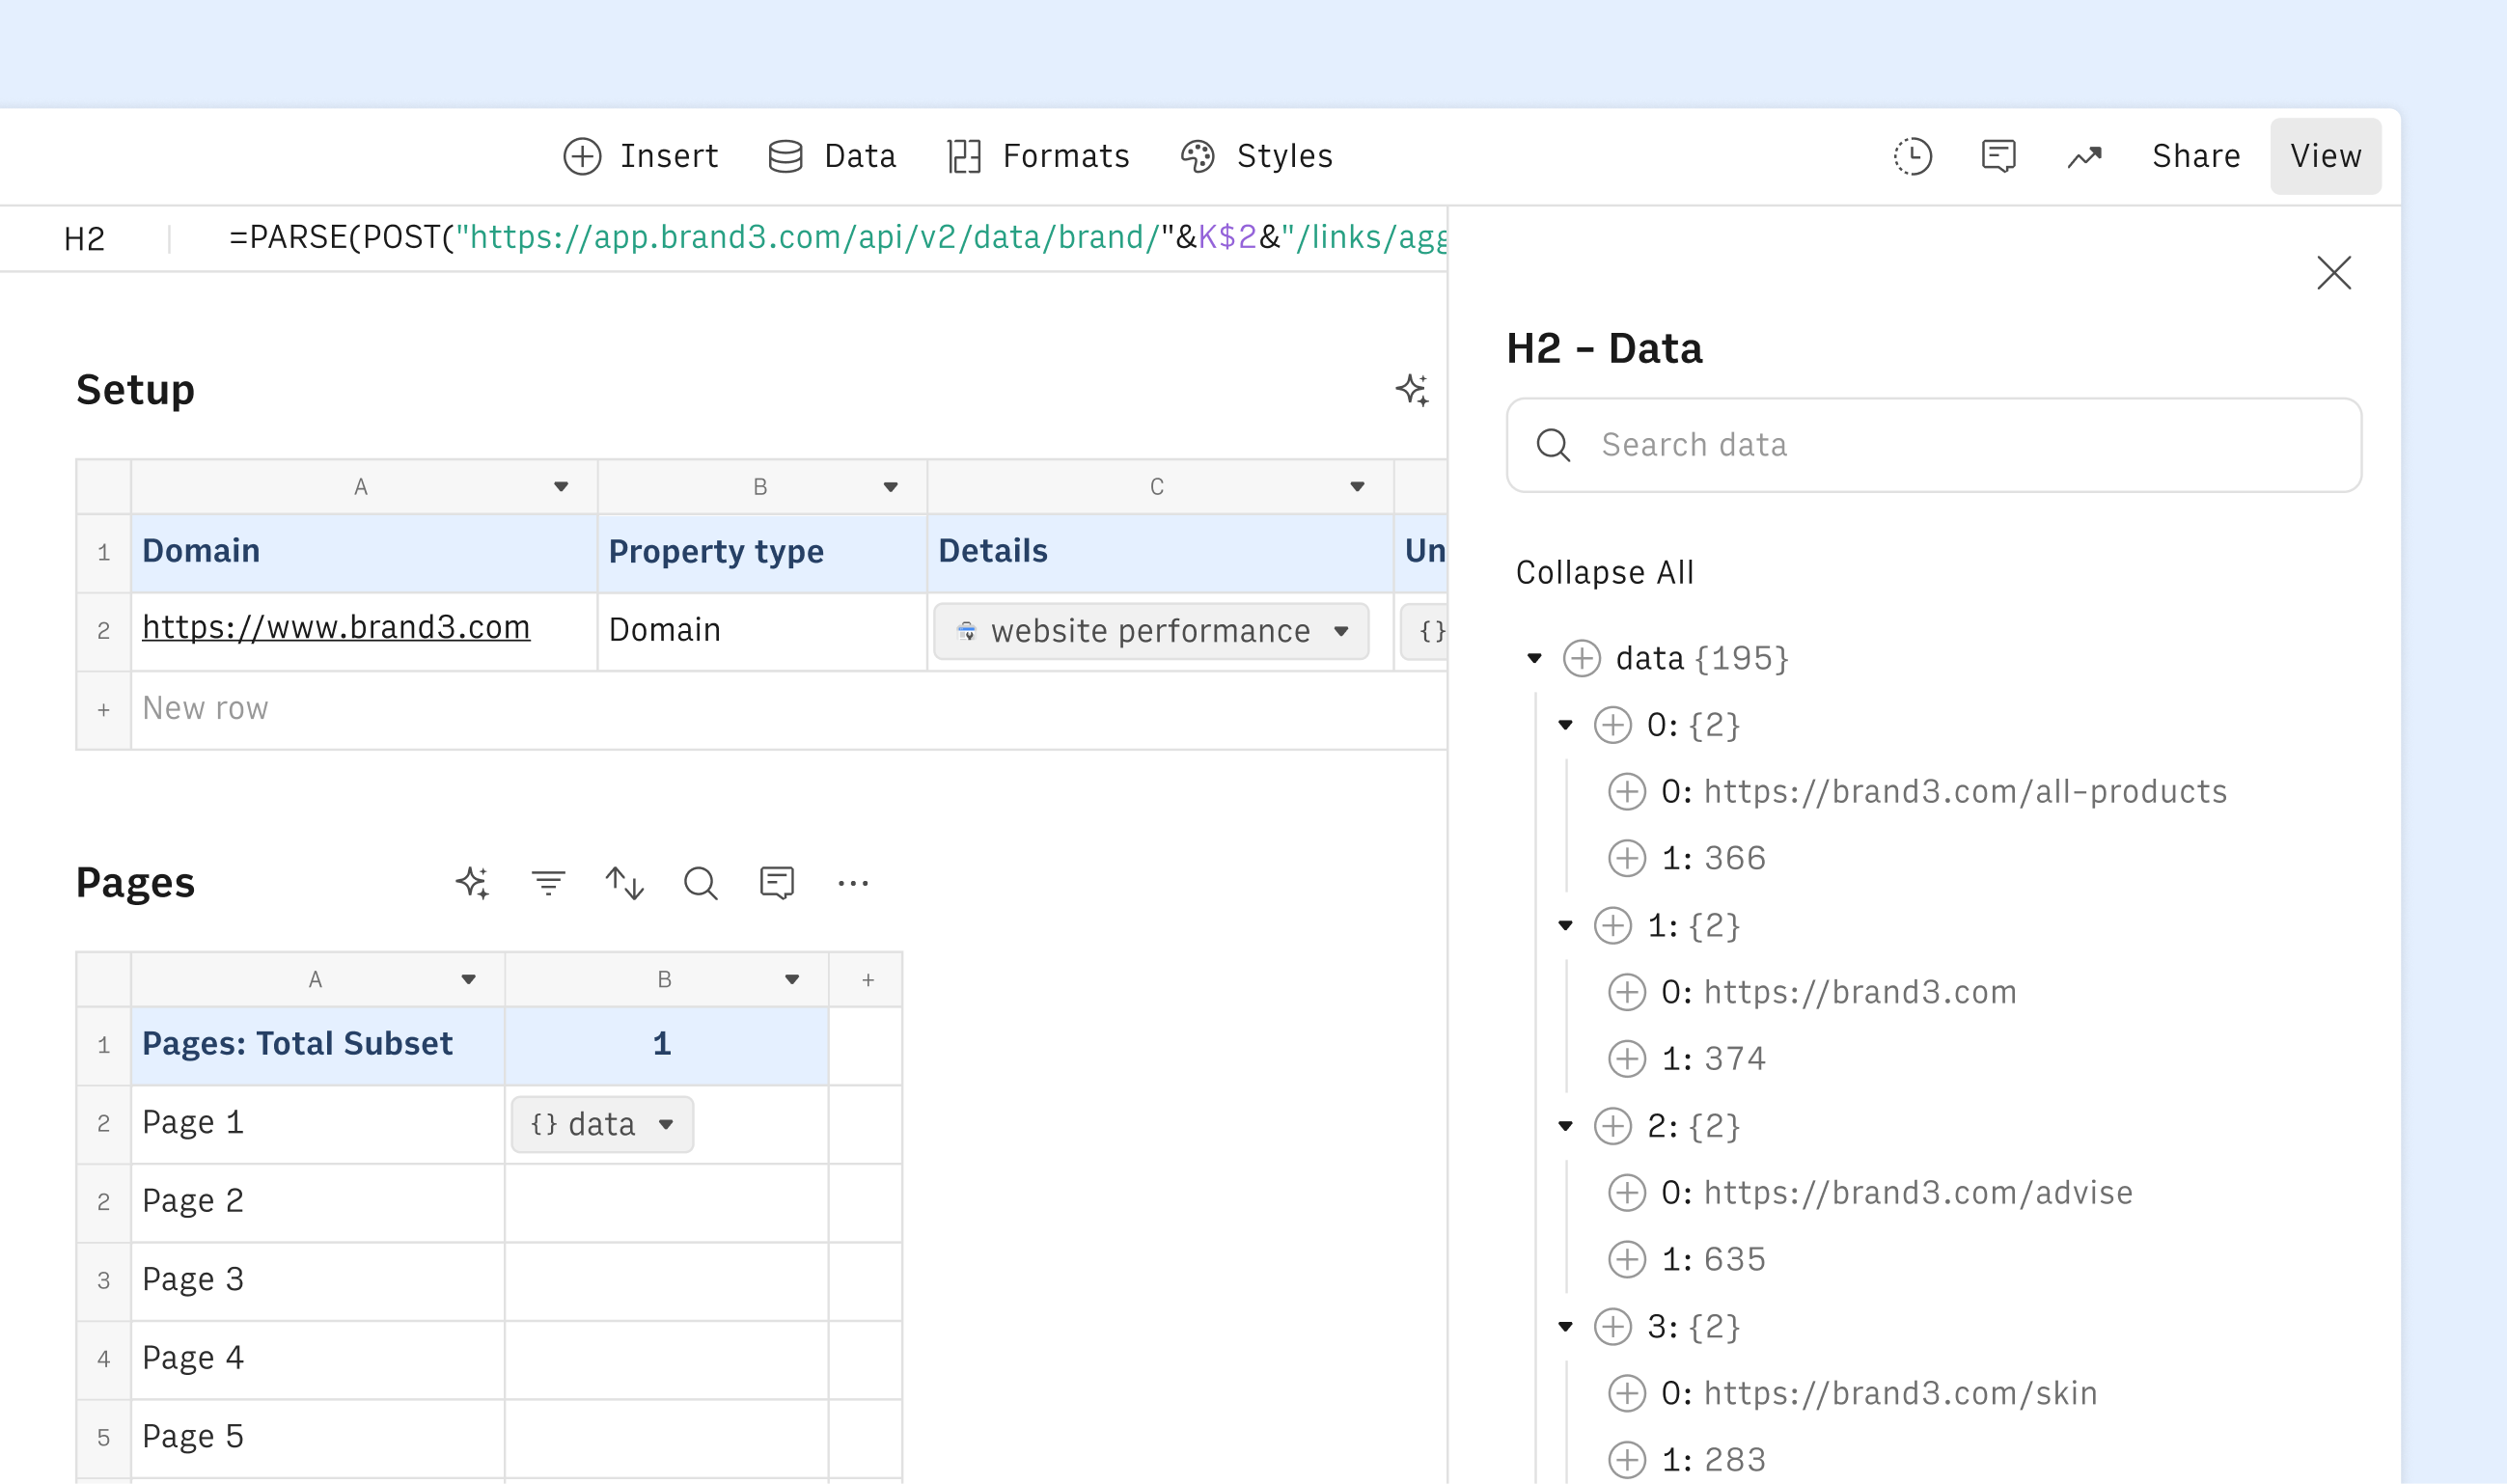
So, when he saw the opportunity to use Rows’ HTTP connector to bring even more data to his SEO reports, he jumped at that opportunity.
And that’s when plugging in the details from the online crawler used to regularly check the website details came to reality, intersecting visibility details with performance details to offer a more holistic picture of the managed websites.
Andrea also suggested several improvements that our dev team is currently exploring, and which we hope to get out soon from our roadmap. From multiple refreshing of formula columns, to how we handle imports, undo actions, and CSV downloads, Andrea’s feedback has been invaluable in making Rows better for everyone.
A lesson for SEO Teams Everywhere
What started as a solution for consolidating data grew into a trusted resource within L'Oréal’s global SEO strategy. Andrea's bias to action proves that complex problems can be solved with the right mindset, and the right spreadsheet 😎.