How to Remove Gridlines in Google Sheets? [2025]

Removing gridlines from your spreadsheet eliminates visual clutter, allowing data to stand out. It creates a cleaner, more professional appearance of your reports and data tables.
In this article, you'll learn how to remove grid lines in Google Sheets.
TL;DR
How to get rid of gridlines in Google Sheets
Method 1: Using the View Menu
Method 2: Using the border menu tab to remove gridlines in specific cells
How to remove gridlines from mobile devices?
How to Supercharge Your Sheets with Rows?
Related: The 10 best spreadsheet software in 2025.
How to get rid of gridlines in Google Sheets
There are two basic methods of removing gridlines in Google Sheets:
Using the view menu
Using the border icon
For these methods, you can choose to remove the gridlines of your entire sheet or decide to remove the grid line of specifically selected cells.
Let's start with the first method.
Method 1: How to remove gridlines in Google Sheets using the View Menu
Step 1: Open your Google Sheets document.
Step 2: Click on "View" in the top menu bar. In the dropdown menu, look for "Gridlines." Afterward, click "Gridlines' to toggle them off (the check mark will disappear).
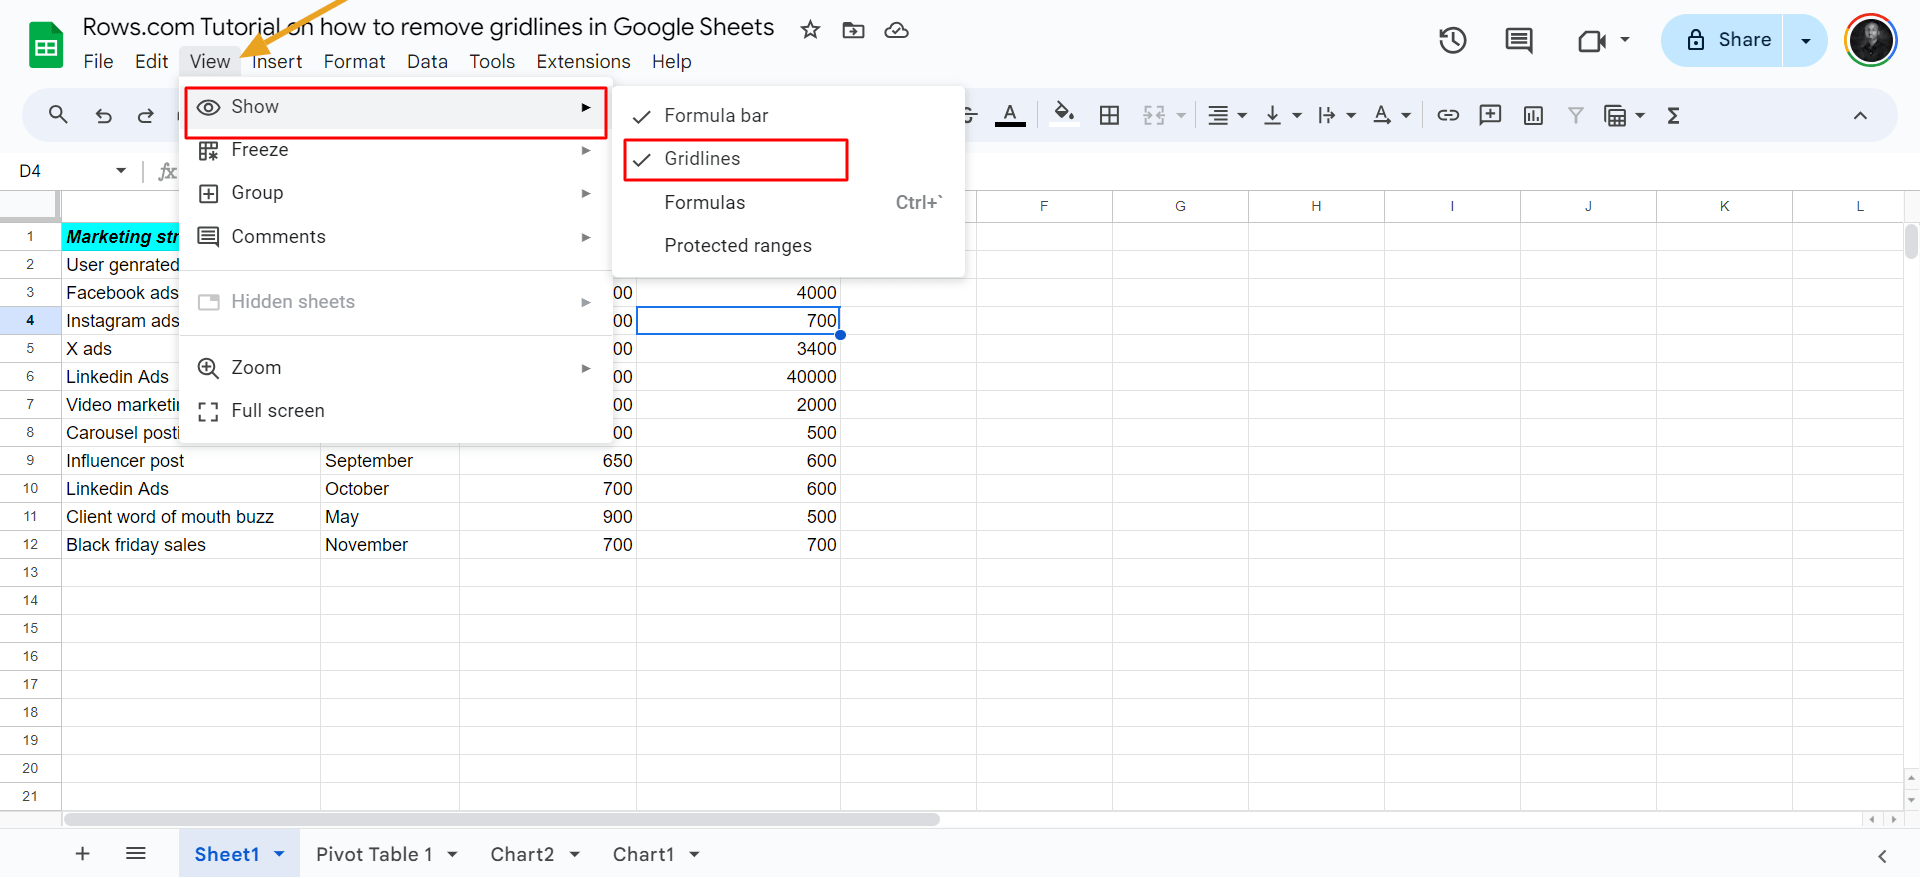
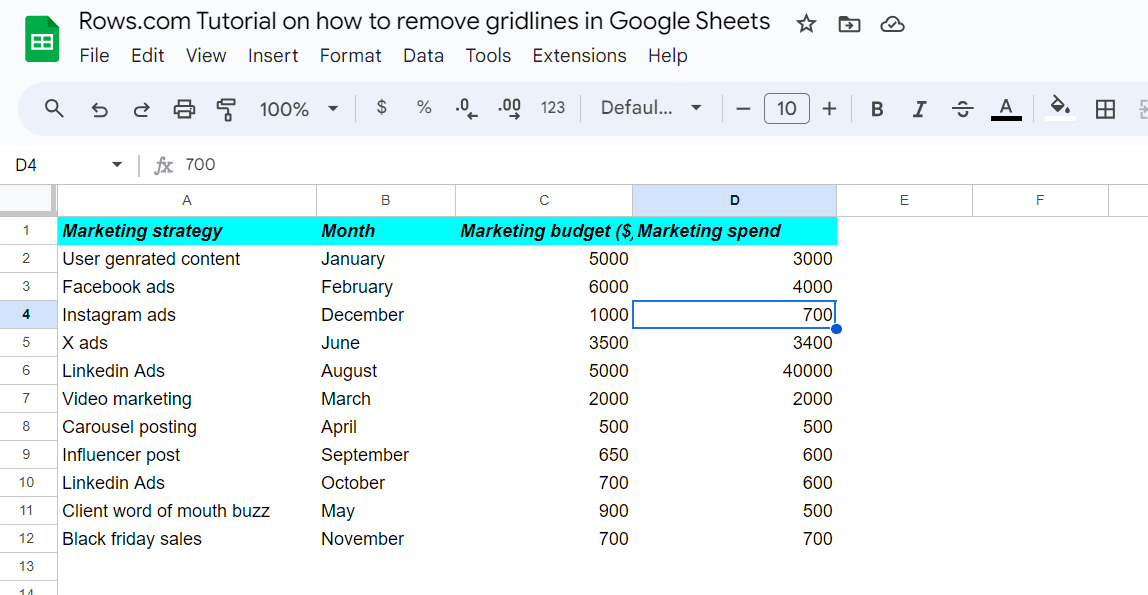
The gridlines automatically disappear once it's toggled off, and the background becomes plain.
Method 2: How to remove gridlines in Google Sheets using the border menu tab
Step 1: Open Your Google Sheet: Navigate to the Google Sheets document where you want to remove the gridlines.
Step 2: Select the Cells — click and drag to select the cells or area from which you want to remove gridlines.
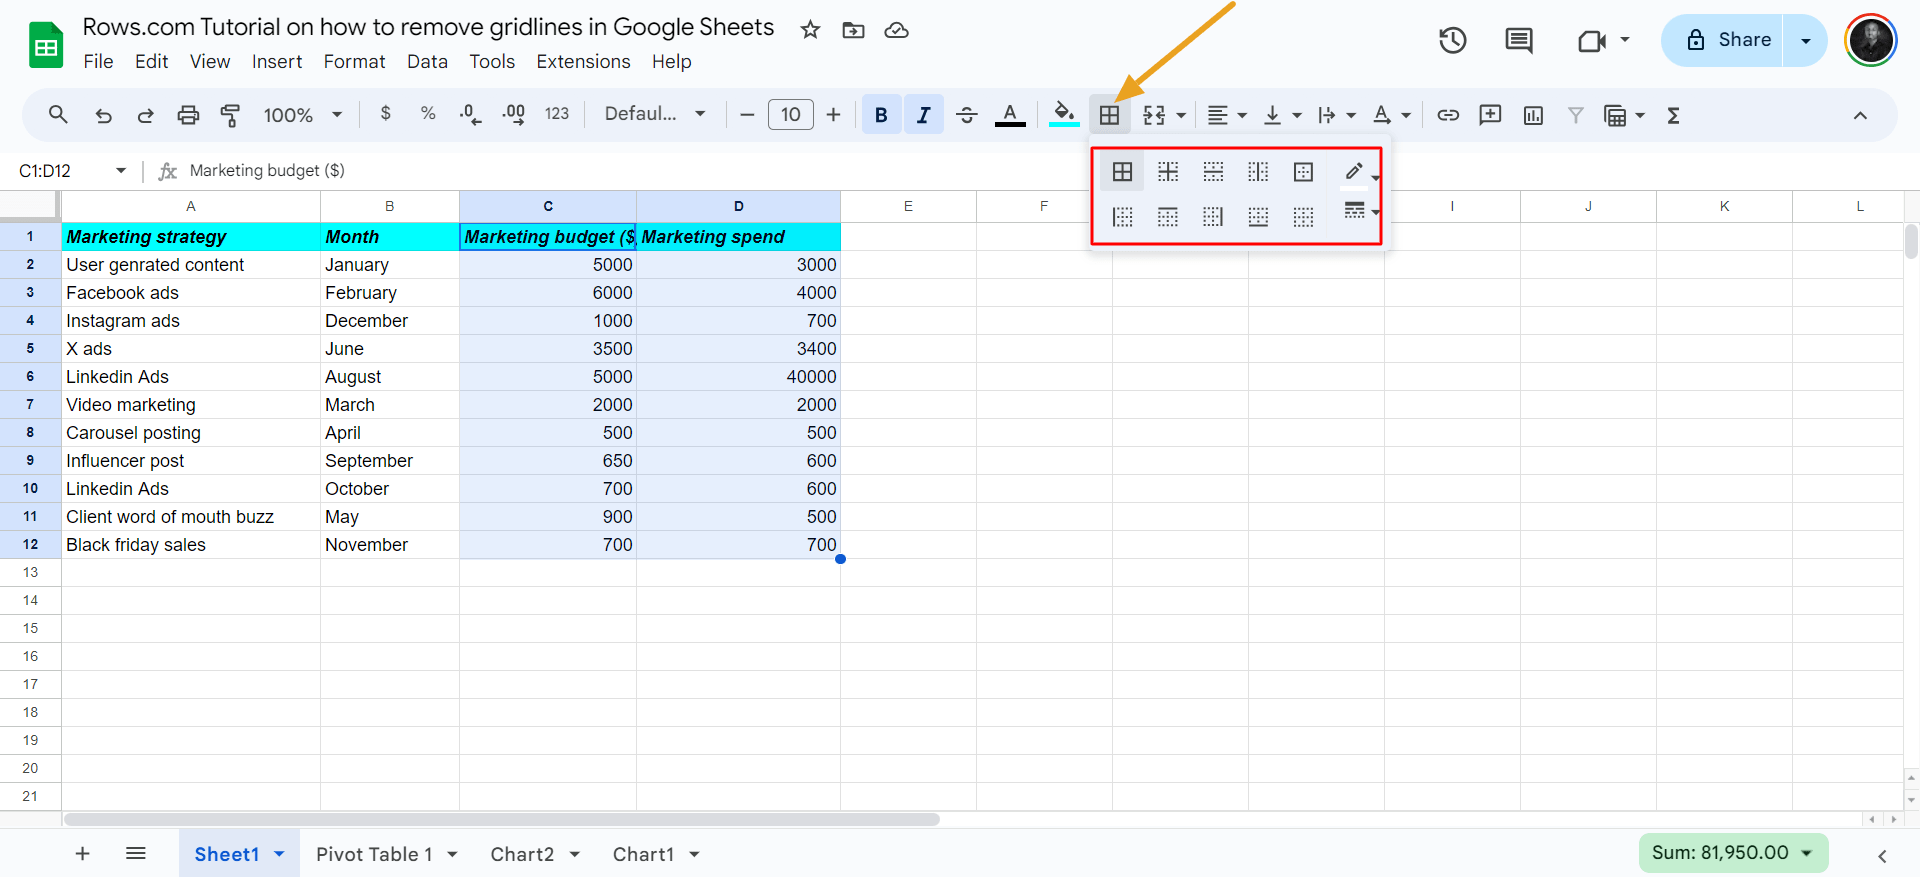
Step 3: Open the Borders Toolbar: In the toolbar at the top of the Google Sheets interface, locate the "Borders" icon, which looks like a grid.
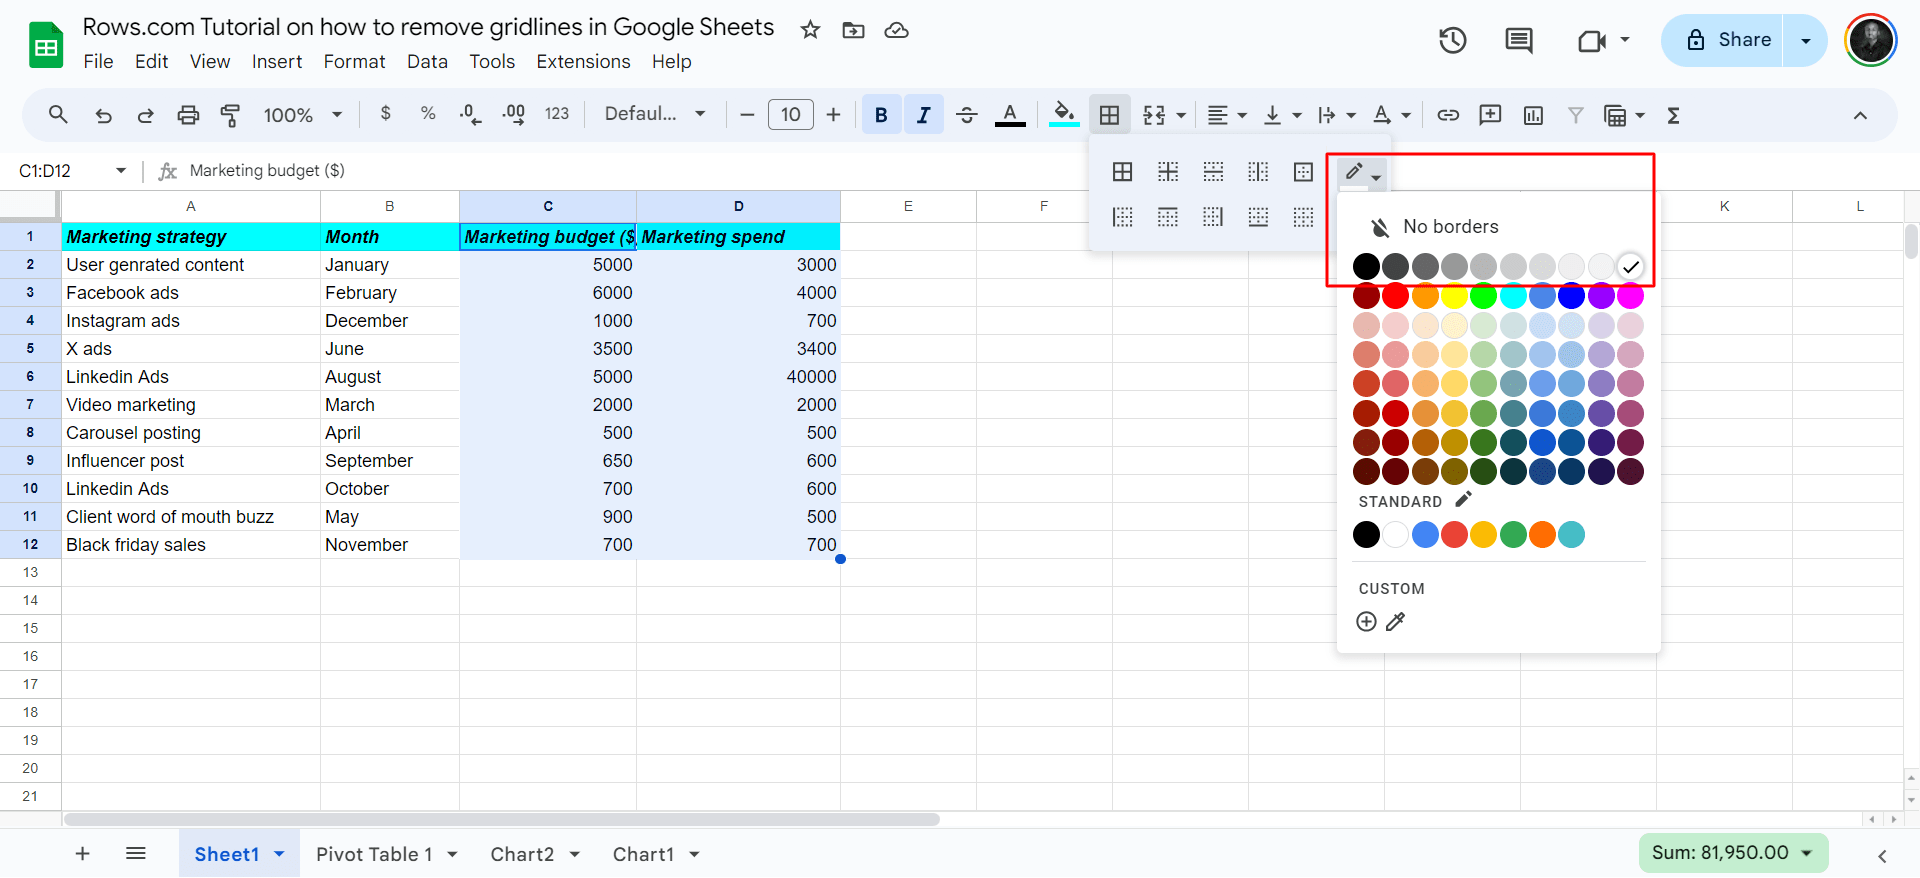
Click on it to open the border menu. Remove Borders: In the dropdown menu, you will see various options for adding borders. To remove existing borders or gridlines, select the "No borders" option (often represented by an icon with a grid and a slash through it).
Before or after selecting the border style, click on the “Border color” button (often represented by a palette icon next to the border styles). A color palette will appear. Pick a Color: Choose the color you want for your borders from the palette.
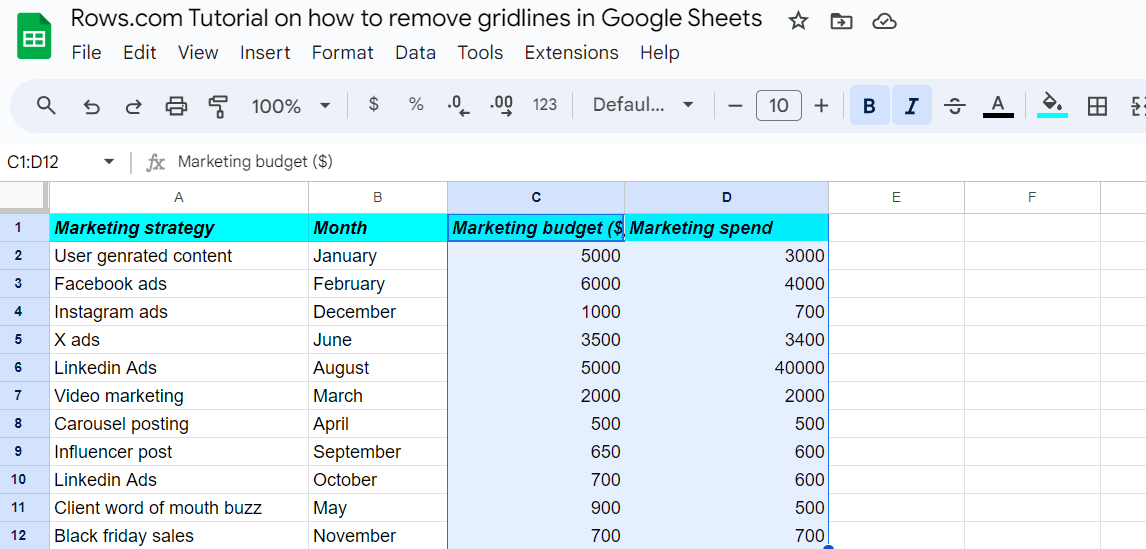
For this example, this is how the result looks like after I hide gridlines. You can choose to style and color it how you like.

Your new AI Data Analyst
Extract from PDFs, import your business data, and analyze it using plain language.
Try Rows (no signup)How to remove gridlines from mobile devices?
You might often want to use your mobile device to check a sheet quickly. Learning to remove gridlines through mobile lets you quickly declutter the page for visual clarity.
Step 1: Open your spreadsheet in the Google Sheets mobile app.
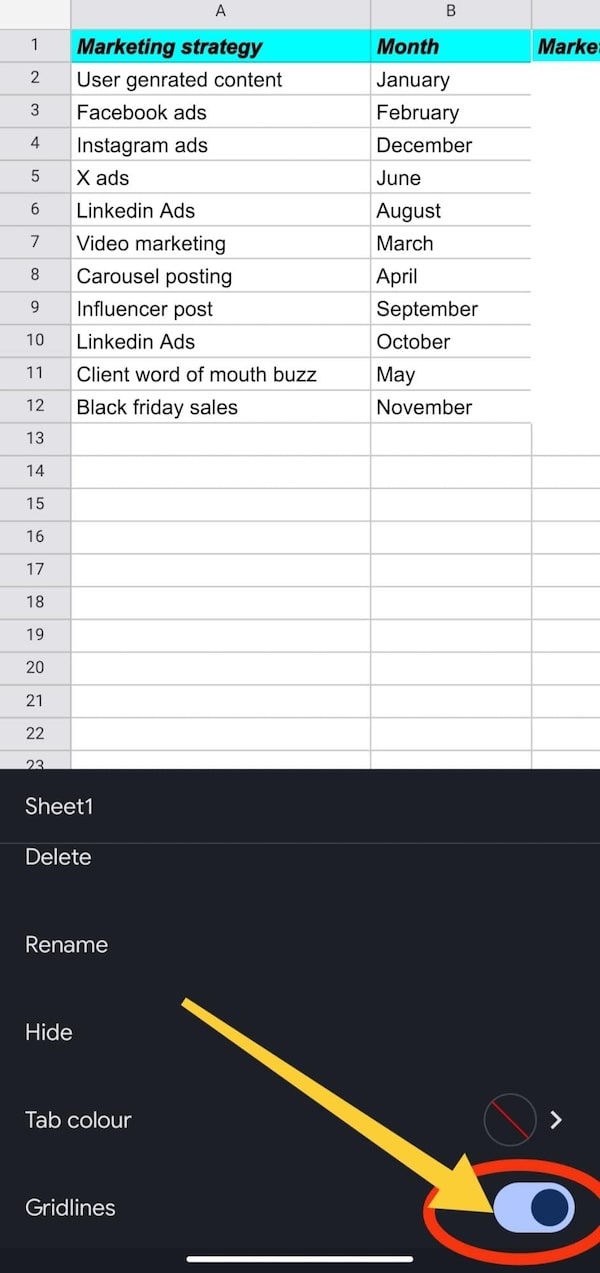
Step 2: Tap the Sheet menu in the bottom right corner.
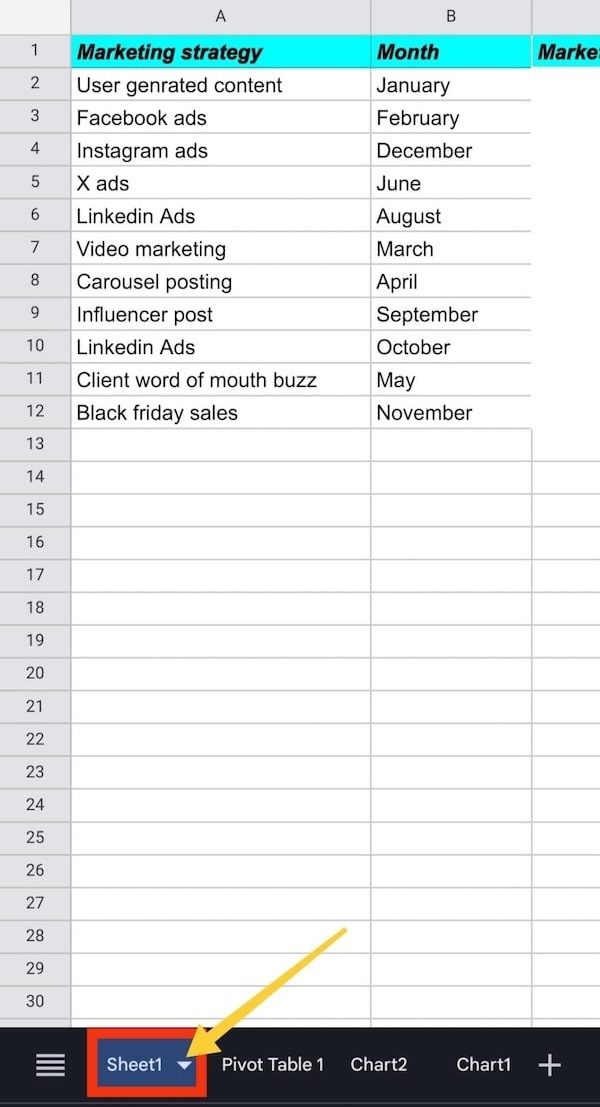
Step 3: Scroll down and toggle off "Gridlines" in the View section.
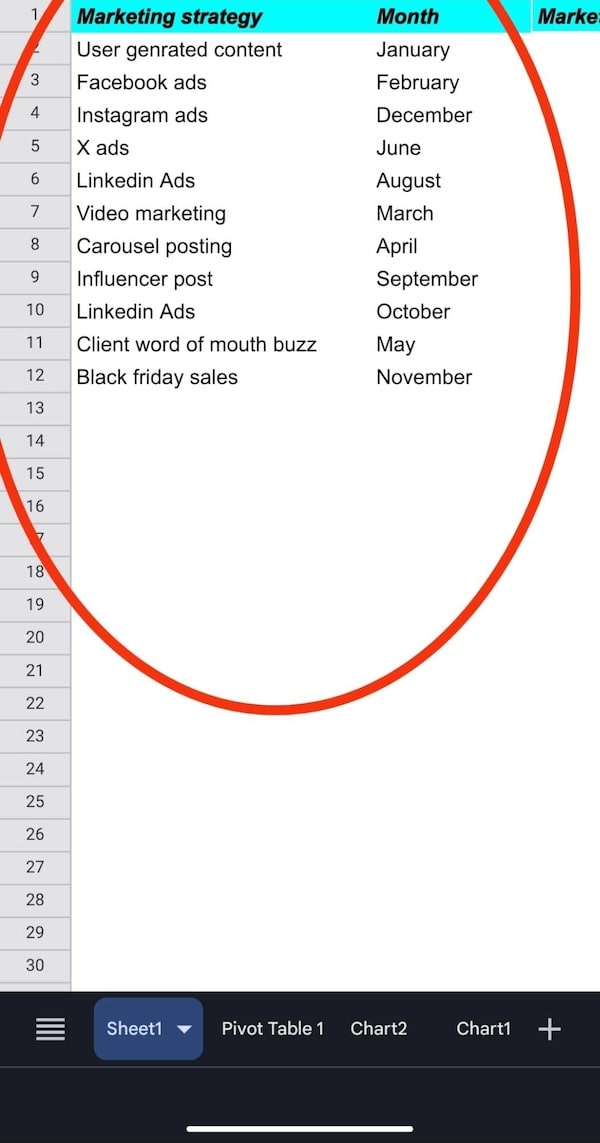
Once done, all the gridlines are removed and your data is on a blank space.
How to Supercharge Your Sheets with Rows?
Rows is a comprehensive spreadsheet for modern teams that offers a better interface, built-in integrations for data ingestion and has native AI capabilities (AI analyst, AI-generated subtitles, native AI functions).
How to remove gridlines in Rows?
You can remove gridlines in Rows with a few clicks:
Step 1: Open your spreadsheet in Rows and ingest data into your sheet. You can import a CSV file, or use one of our integration to have live data from your most used tools, like Notion, Google Analytics or Facebook Ads.
The example below shows how to import live data from a Notion database:
Read more: Learn how to import data from other sources, such as Google Sheets or a CSV file.
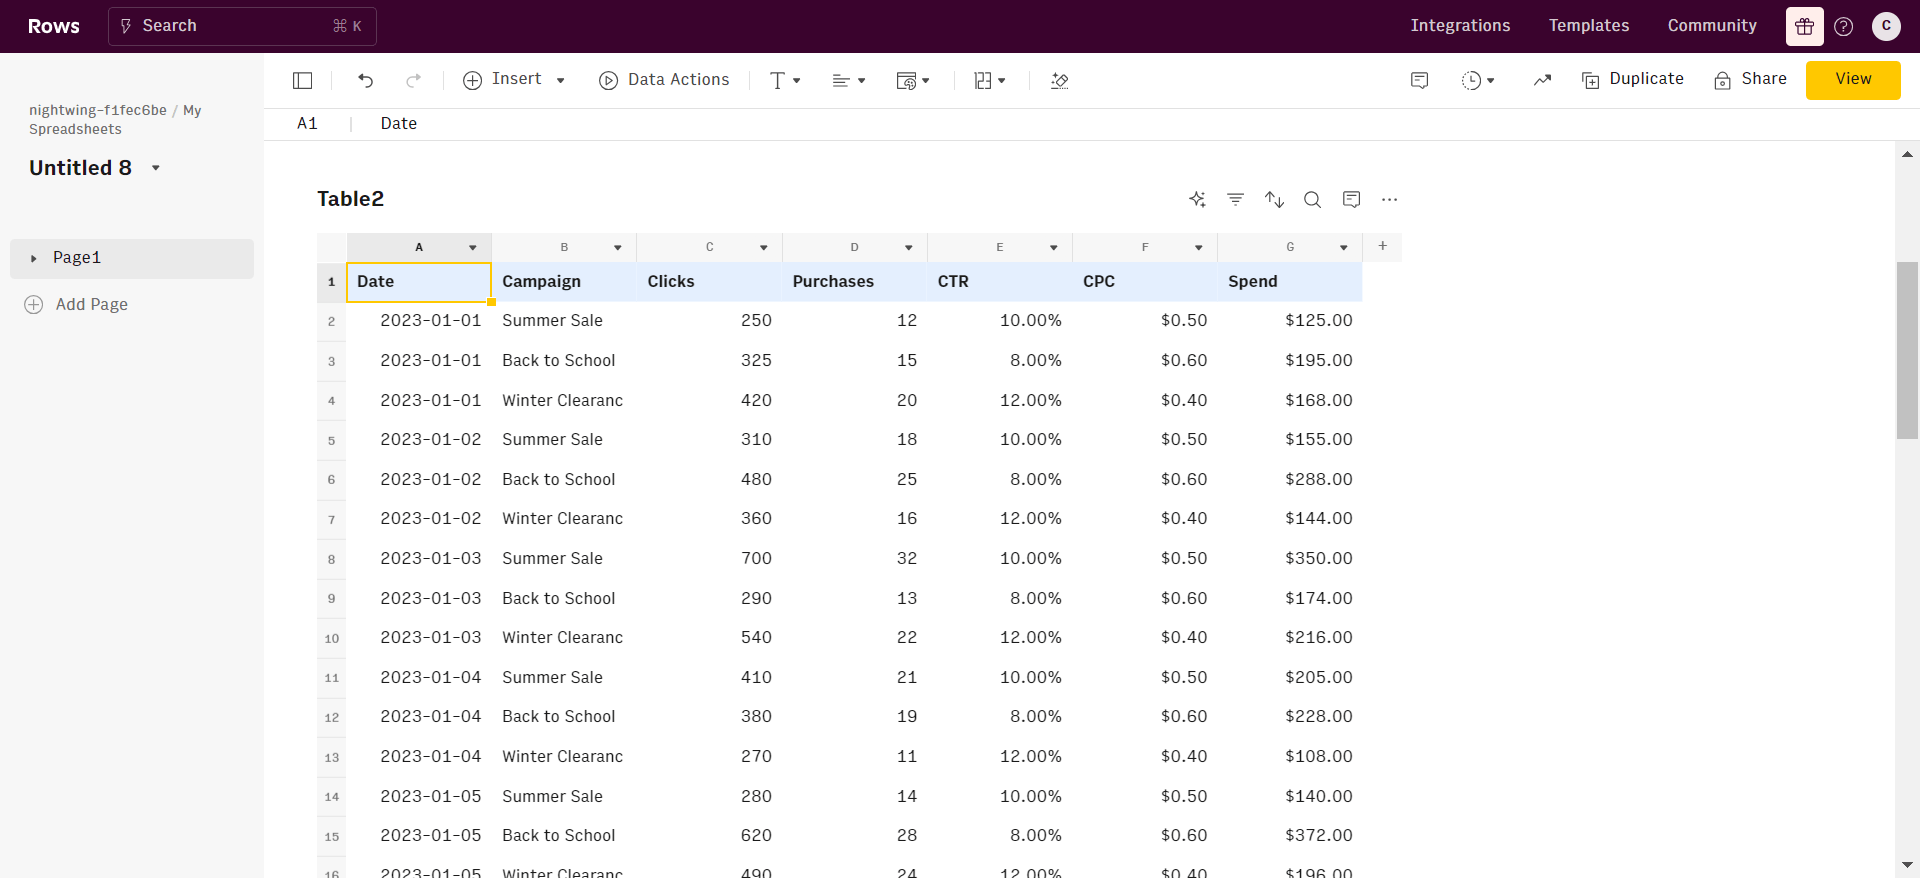
Step 2: After importing data, click the three-dotted icon on the top left corner of your spreadsheet. Click it, and you'll get a drop down menu of several functions. You'll see Show gridlines toggled on. All you have to do is toggle off.
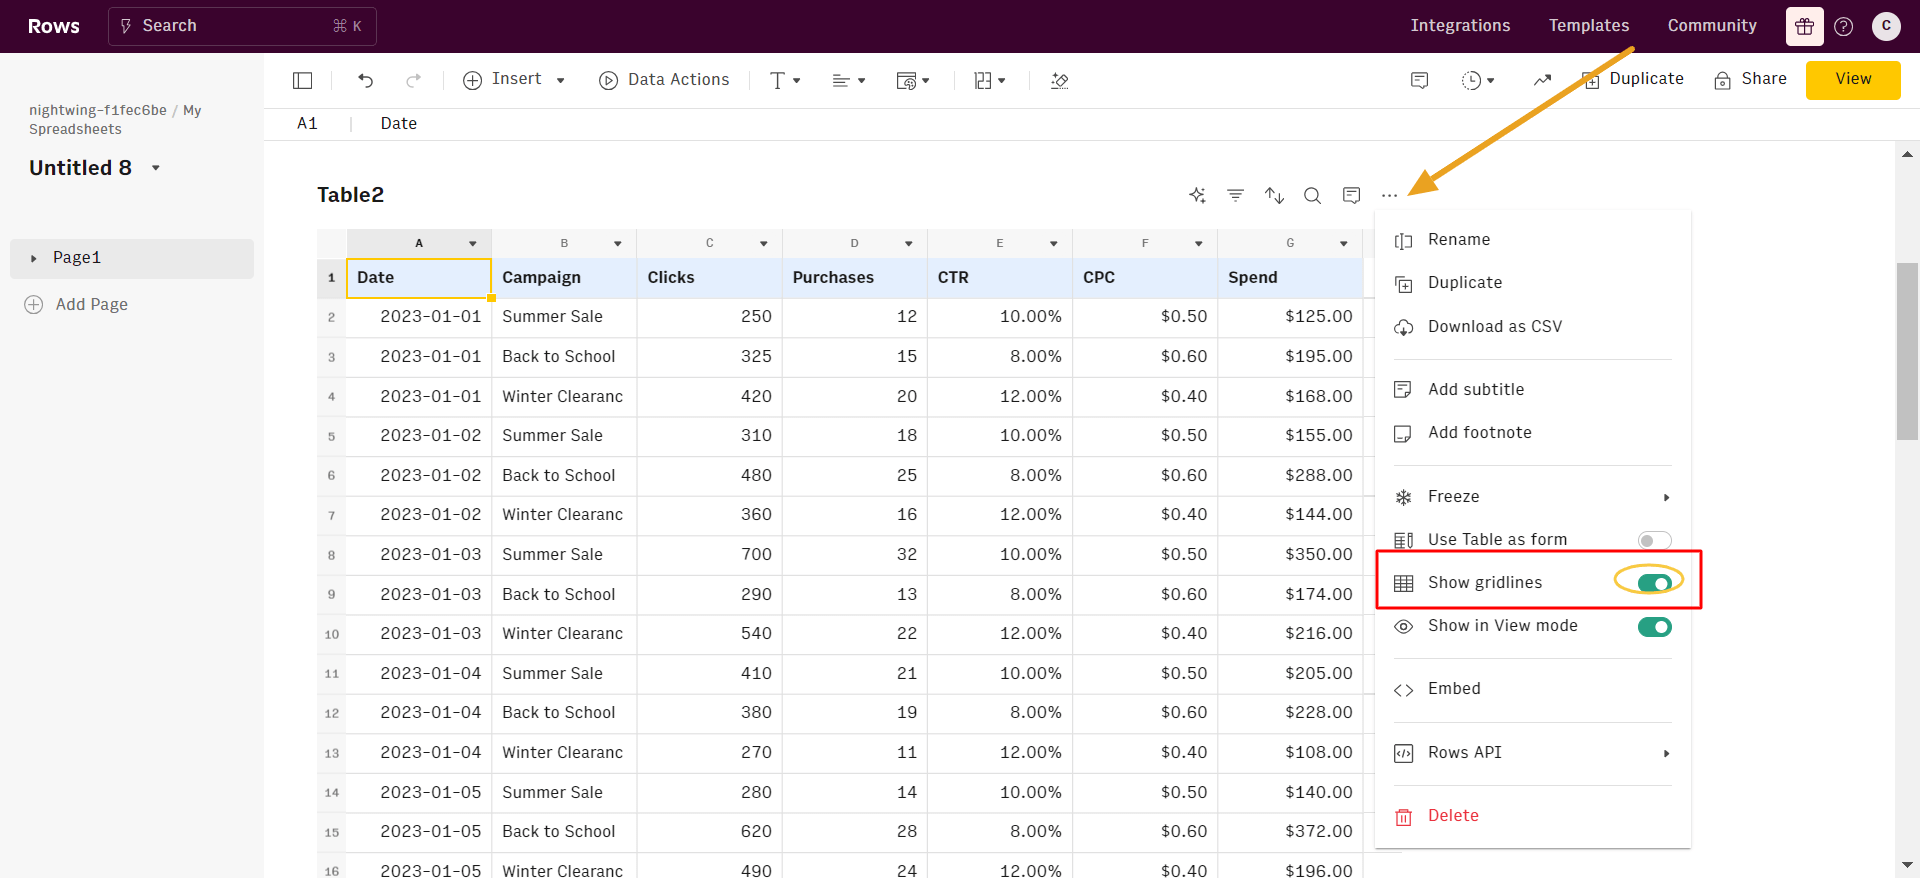
After toggling off, this is the result I got. All gridlines are off.

The spreadsheet powered by AI
Access the power of AI to analyze, summarize and transform data. Build better spreadsheets, faster.
Try Rows for FreeHow does Rows compare with Google Sheets?
Modern UI
Rows has a tidier UI when compared to Google Sheets. Here are features that make its UI clear:
Spreadsheets in Rows present a document-like layout with standalone tables and charts stacked vertically and horizontally.
WYSIWYG: The spreadsheet is the dashboard. All data is rendered as regular spreadsheet tables, positioned neatly. You can move elements vertically and horizontally with simple drag-and-drop.
View Mode: View mode makes your spreadsheets work like web applications. With input fields, you can help anyone understand how to use your spreadsheet by highlighting the cells that need an input by the user.
50+ built-in data source integrations in various domains
Rows boast over 50+ integrations across different facets like marketing, analytics and databases.
This makes it easy to ingest data into your table quickly and reduces your team's stress when it comes to recurring reporting. With Rows, you can gather data from various sources in your system. This allows for more detailed analyses and helps your team uncover insights they might miss.
Here's a division of the built-in integrations in Rows:
Marketing: GA4, GSC, Facebook, Instagram, Tiktok
Productivity software: OpenAI, Notion, Slack, Email, Translate
Data warehouse: MySQL, BigQuery, PostgreSQL, Snowflake, Amazon Redshift
Read more: Best data aggregation tools in 2025.
AI-powered automation
With the AI Analyst, you can ask AI to analyze, summarize, transform, and enrich your analysis. Click on the ✨ icon, at the top right corner of any table.
A chat interface will open on the right: you can ask a broad range of questions, from basic spreadsheet commands - plotting a chart or adding or formatting columns - to more complex tasks, such as slicing, pivoting, or computing metrics about your data.
For example, given a dataset with daily revenue and costs of various marketing campaigns, you can ask the Analyst to add a column with the profit margin. Watch the video below:
In addition, our AI Analyst is instructed to use our native OpenAI functions to perform data enrichment or extraction tasks.
For example, you can ask the AI analyst to run a sentiment analysis on a column with product reviews, or add a column that categorizes addresses into regions, see below:
Want to know more about how our Analyst works? Check out our guide or watch our demo.
Related: Do you want to learn how to create pivot tables? If yes, click the link!
Started Using Rows today!
With Rows, you get an AI analyst that automatically derives spreadsheet insights. The Analyst slices the main table by highlighting the top keywords by clicks. Additionally, you get a tidy and uncluttered UI before you think of removing gridlines — unlike Google Sheets, where gridlines spread across the whole sheet beyond the data.
Ready to get started with Rows.com? Start using the product right away for free.