Financial Reporting Automation: A Practical Guide for Modern Teams


Financial reporting. A crucial part of business life. It sees teams heading into the same spreadsheets, doing the regular data input and janitorial work, saving… and then doing the exact same thing every reporting cycle.
If this is you, then you’re probably looking for any solution that can save your Monday mornings. And thankfully, there is: Financial reporting automation!
While most finance teams know automation could save them hours every month, figuring out how to actually implement it without abandoning the spreadsheet skills you've spent years building often presents a roadblock.
The good news is, you don’t need to. If anything, believing that you do presents a misunderstanding of what automation can actually do. So, in this guide, we’ll walk you through what financial reporting automation really involves, which tasks it handles best, and how to start automating your reports this quarter without requiring a massive IT overhaul. Let’s go.
What is financial reporting automation?
Financial reporting automation is software that handles repetitive accounting tasks by pulling information from various systems to deliver faster, more accurate insights.
Instead of manually downloading data, copying it into spreadsheets, and formatting reports month after month, automated systems connect directly to your accounting software and generate reports without human intervention.
Before you start automating, you’ll need to decide how much of the process you actually want to automate. You can either do partial automation or full true automation. We recommend full.
Partial automation still requires manual downloads and copy-pasting into spreadsheets. True automation pulls data directly from source systems and automatically populates reports, with no manual file handling required.
And the best thing is that financial reporting automation handles all the major tasks involved:
Expense reporting and automatic transaction categorization.
Account reconciliation between ledgers and bank statements.
Internal management reports, like profit and loss statements.
Cash flow statements and balance sheet generation.
And if you’re still not convinced, automating the routine work transforms finance teams from data preparers into strategic business partners. When you're not stuck reformatting the same report every month, you can actually analyze what the numbers mean and help leadership make better decisions.
The real benefits of financial reporting automation
Getting your reports done faster is nice. But the real value goes beyond saving a few hours.
Benefit | What it means for you |
|---|---|
Time savings that compound | Three-quarters of finance professionals spend more than 10% of their time just manipulating data, not analyzing it. That's roughly half a day every week moving numbers between systems. McKinsey projects that 25% of finance tasks can be automated by 2027, freeing up capacity for work that actually matters. |
Fewer errors | Manual copy-pasting from five different systems practically guarantees you'll transpose a number or paste into the wrong column eventually. Automated systems apply the same validation rules every time, so data either flows correctly or flags an error immediately. |
Current data, instead of looking backward | Traditional reporting means analyzing information that's already 30 days old by the time you've finished compiling it. Automation gives you visibility into your current financial position, so leadership can react to trends while they're still happening instead of reading about what happened last month. |
Audit trails built-in | Every transaction gets logged, every formula change gets traced, and every modification gets timestamped with who made it and when. This makes external audits faster and gives you confidence that your reports can withstand scrutiny when questions come up. |
Speed creates competitive advantage | While your competitors are manually closing their books for three days, you're already analyzing last month's performance and adjusting this month's strategy. Moving faster than organizations stuck in manual processes is the real benefit automation delivers. |
Pretty huge, right? The benefits far outweigh the costs and the time spent implementing automation.
And we haven’t even gotten onto the good part yet. Because automation is actually far more accessible now than it ever has been. There are plenty of tools and solutions available online that can help you automate your finance reports in a fraction of the time required to set them up yourself. So let’s take a look at some.

Automate your financial reporting with Rows.
Connect your data, use AI to handle categorization and analysis, and share reports that update themselves automatically.
Get started (free)Best tools and software for automated financial reporting
The automation software market is crowded, and every vendor claims they'll transform your financial reporting. That’s true in a lot of cases, but different tools fit different needs. But considering the amount of choice out there, it can be difficult figuring out what tool will actually fit your needs. Let’s take a look.
Start with what you already have: Excel
Before jumping to new platforms, let’s start with a tool you’re already familiar with. The fact is, Excel can automate more than most finance teams realize. Power Query pulls data from external sources automatically, and Office Scripts handle repetitive formatting tasks. You can even run Python directly in Excel now for advanced analysis.
The catch? These features require setup and ongoing maintenance. You're essentially building your own automation infrastructure, which works fine until the person who built it leaves and nobody else knows how to update the queries.
Excel add-ons like Datarails, Cube, and Claude’s Excel add-on connect to your existing files but often rely on the same legacy file structures that cause problems in the first place.
Modern tools offer spreadsheet flexibility with built-in connectivity that doesn't break when someone changes a column name in your accounting system. Let’s look at those.
What to look for in automation platforms
Not all automation is created equal. Here's what actually matters:
Real-time data integration: Pulls directly from source systems without manual exports.
Pre-built templates or customizable dashboards: So you're not starting from scratch each time you need something new. The best platforms offer templates and the capabilities to build new models that fit your needs.
Integration depth beyond simple CSV uploads, look for API connections that stay live.
But, before evaluating specific tools, document your requirements:
Which systems need to connect to your reporting platform?
How many people will use it regularly?
Do you need to scale as transaction volume grows?
What level of support do you need during implementation?
What's the total cost, including setup, training, and ongoing subscriptions?
The right tool depends on your specific situation. A 20-person startup has different needs than a 200-person company with multiple subsidiaries.
Tools organized by what you actually need
For teams who want to keep their spreadsheet workflow
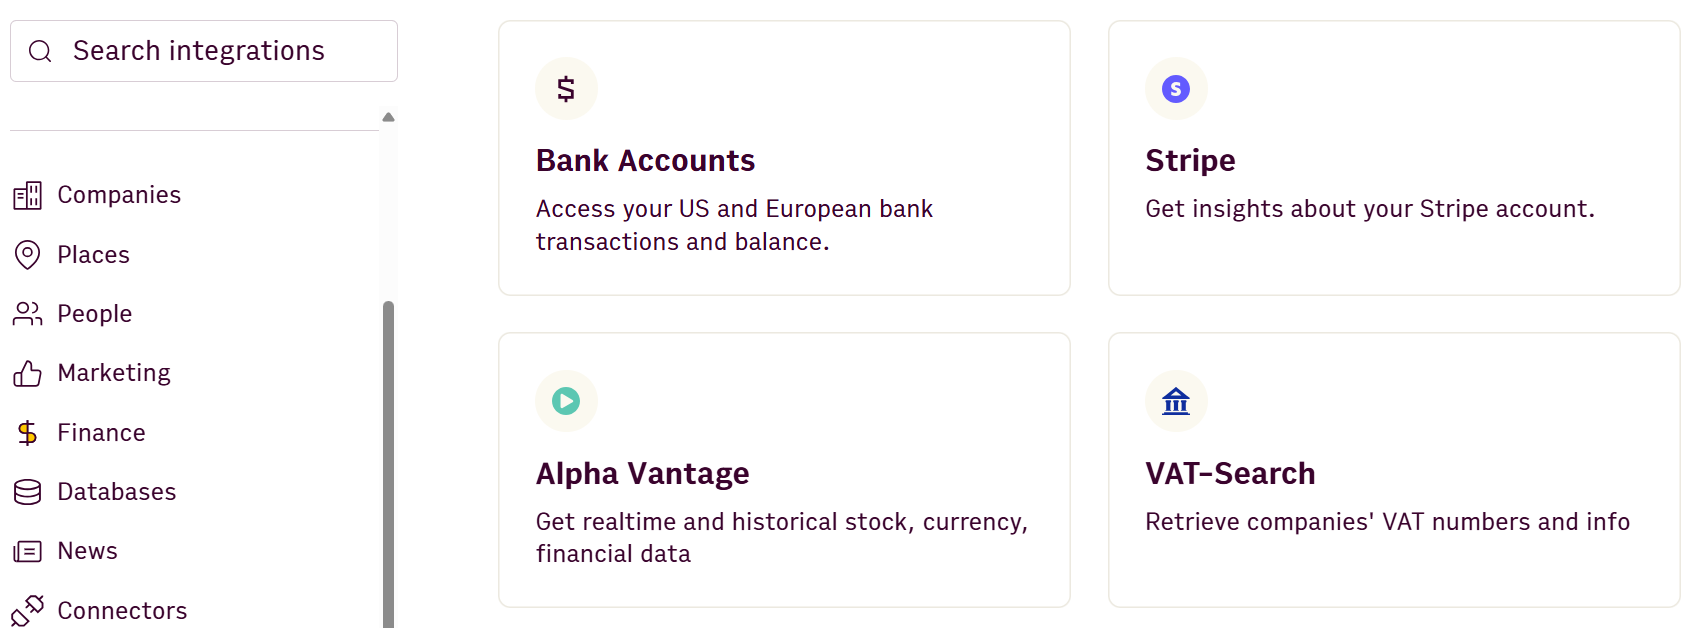
Platforms like Rows and Shortcut let you work in a familiar grid interface while connecting live data from 50+ business tools. You get dynamic reports that update automatically without abandoning the spreadsheet skills you've already built.
For teams focused on visualization
BI tools like Power BI and Tableau excel at creating executive dashboards and self-serve analytics. The learning curve is steep, and editing the underlying data means going back to your source systems.
For enterprise complexity
Platforms like Workiva and Redwood handle multi-entity consolidation, external disclosure management, and formal financial close workflows. They're built for organizations with complex reporting requirements and budgets to match.
For specific workflows
Task-specific tools like Bill.com automate accounts payable and receivable, while DataSnipper focuses specifically on audit documentation. These work well when you need deep functionality in one area.
How financial reporting automation works in practice
Understanding the mechanics helps demystify what happens between connecting your systems and getting finished reports.
The general data flow
Automation follows a consistent pattern regardless of which tool you use:
Connect → APIs pull data from ERPs, banks, and CRMs without manual exports.
Extract → OCR reads PDFs and invoices, converting paper documents into structured data.
Validate → System checks for duplicates, anomalies, and missing information before processing.
Transform → Standardization handles currency conversions, date formats, and account mapping automatically.
Assemble → Pre-configured templates populate with your data – balance sheets, P&Ls, cash flow statements.
Distribute → Reports share via secure links instead of email attachments that go stale.
Can AI actually do financial reporting?
Yes. AI handles extraction from non-standard documents, spots transaction anomalies automatically, and generates formulas from plain English descriptions. It can also handle imports from third-party data and build models from scratch based on your needs… but human judgment still matters for validating outputs and reviewing unusual transactions.
At the end of the day, AI isn’t a magic solution that’ll solve all your problems. So, make sure to check everything, because mistakes can be made. With that out of the way, let’s take a look at what an actual workflow could look like with Rows.
Real workflow example using Rows
Here's how automation works end-to-end with a spreadsheet-native platform like Rows. It uses a chat with data-style approach, allowing you to set up automations by asking the AI, and allowing you to analyze your numbers once the spreadsheets are populated:
Import live data: Connect your business account to pull transaction data automatically. Set the refresh schedule – daily, hourly, or even minute-by-minute depending on your needs.
2. Let AI categorize transactions. Ask the AI Analyst to "Categorize unlabeled transactions based on vendor name and historical patterns." The AI applies consistent logic across all your transactions without manual review of each one.
3. Share live reports: Embed the updating chart into your Notion doc or internal dashboard. When new data flows in, the report updates automatically—no need to regenerate and re-share.
💡 Did you know? The Vibe Analytics Guide for Finance includes 10 ready-to-use prompts for automating finance operations. From parsing invoices to reconciling payments and building budget variance reports, just ask, and the AI will set them up!
Rows allows you to use templates (which we’ll cover below), but by providing a simple prompt to the AI Analyst, you can create a custom dashboard that’ll suit your every need. We tested it out with a DCF (Discounted Cash Flow) model. We used this prompt:
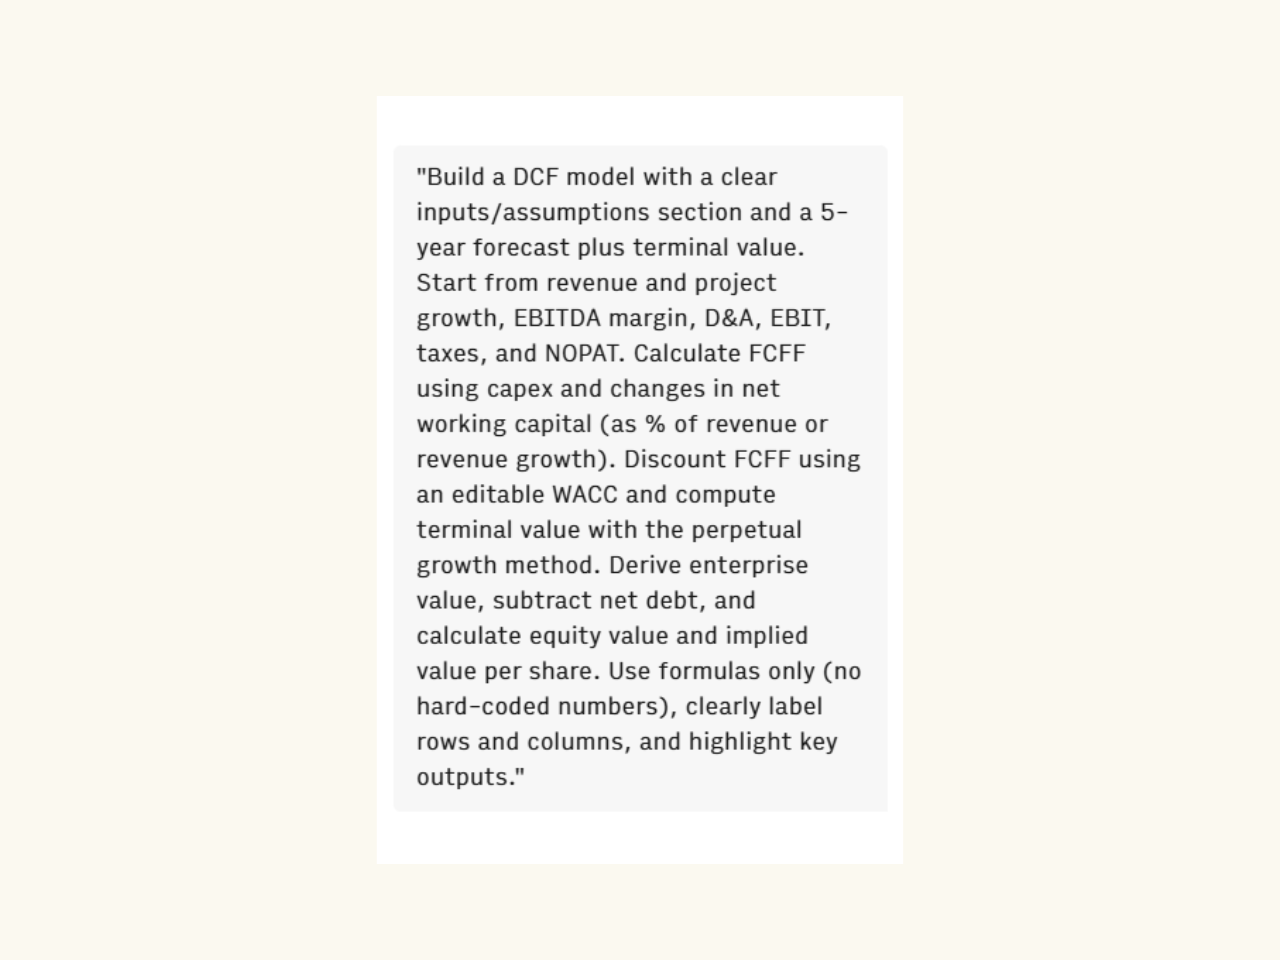
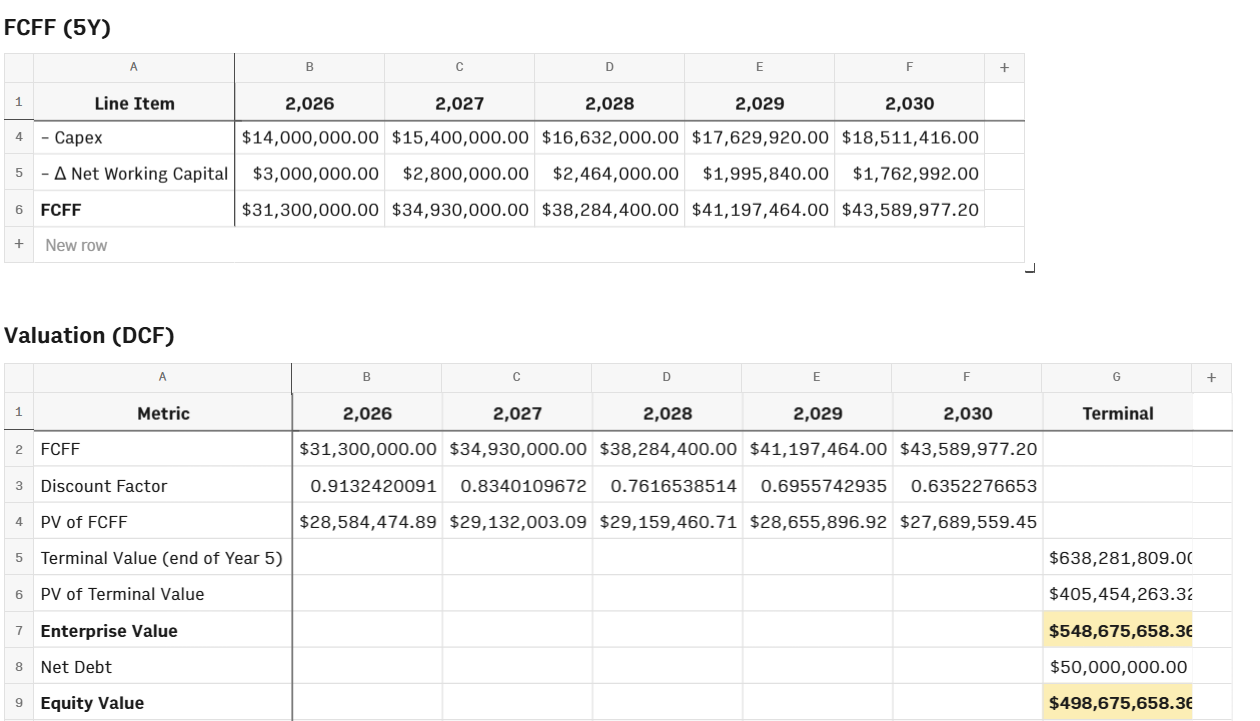
And within a couple of minutes, we got this:
Real-time cash flow monitoring with templates
Now, if you don’t want a custom dashboard, Rows also has a library of templates. You can choose from the official templates, or take a look through the community library:
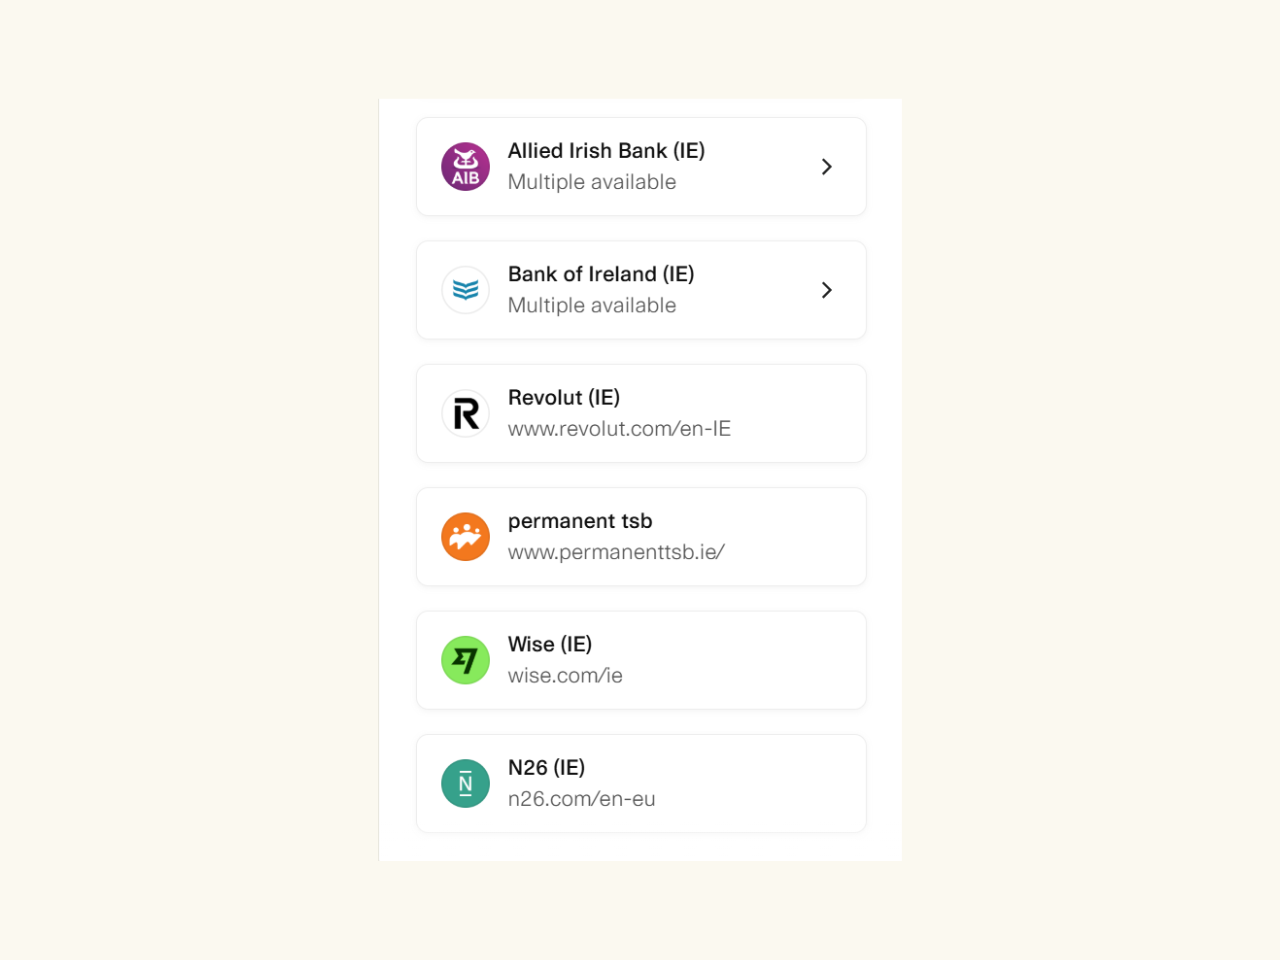
Connect your bank accounts and payment systems: Pull transaction data directly from your banking APIs and payment processors like Stripe. This captures both actual cash movements and pending transactions.
Apply a cash flow template: Use a pre-built cash flow statement template that automatically organizes transactions into operating, investing, and financing activities. The template adjusts in real-time as new transactions post.
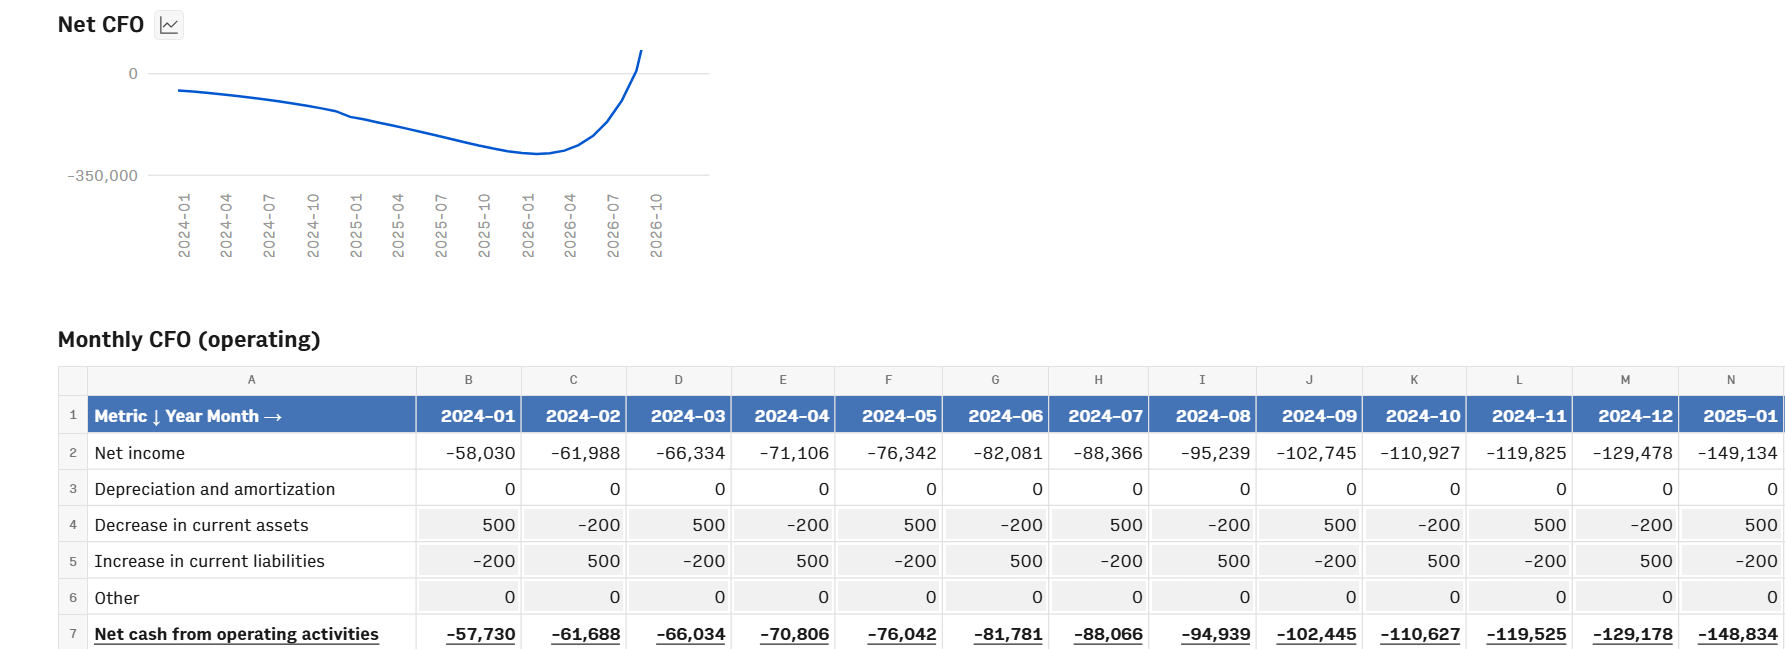
3. Monitor current position continuously: Instead of waiting until month-end to see your cash position, you get visibility into today's balances, this week's outflows, and next week's expected receipts. Leadership can make spending decisions based on actual current cash, not estimates from last month's close.
Automate your financial reporting with Rows.
Connect your data, use AI to handle categorization and analysis, and share reports that update themselves automatically.
Get started (free)Best practices for implementing automated financial reporting
Automation is a process that requires planning, testing, and realistic expectations about what changes immediately versus what takes time to refine.
Clean your data first: Automation amplifies whatever you feed it. If your chart of accounts has inconsistent naming conventions or duplicate vendors with slightly different spellings, that’s not going to be fixed. Spend time standardizing before you automate.
Start with one painful report: Don't try to automate everything at once. Pick the report that causes the most frustration. Maybe the monthly variance report or weekly cash flow statement, and then pilot automation there. You'll learn what works without risking your entire reporting infrastructure.
Configure and map once, maintain as you grow: Set up your chart of accounts mapping, establish validation rules, and define exception handling logic. These configurations serve as your automation foundation and can be updated as your business changes, rather than every time you run a report.
Run parallel for validation: Generate the new automated report alongside your manual process for at least one full reporting cycle. Compare line by line to catch mapping errors or logic gaps before you trust the automated version completely.
Involve the team early: People trust systems they helped build. Include team members in setup decisions and testing. When they understand how automation works, they're more likely to flag issues early instead of working around the system.
What you can't automate
Accountability remains a human responsibility. Someone still needs to review whether the logic makes sense (alongside the business rationale) and whether outputs pass the common-sense test.
Even highly accurate AI categorization will misclassify some transactions. New vendors, unusual purchase types, or one-off expenses might not fit established patterns. So, make sure to build review checkpoints for edge cases rather than assuming 100% accuracy. You’ll thank yourself for the extra effort, believe us.
⚠️ The biggest implementation mistake is automating messy processes and expecting clean results. Fix your workflows before you automate them.
Your first step towards automated financial reporting
You don't need a massive IT budget or a six-month implementation timeline to start automating.
Identify your biggest pain point: Which report takes the longest? Which one do you dread building every month? That's your pilot candidate.
Start this quarter, not next year: Pick one report, connect your data sources, and test the automation alongside your manual process. You'll get your first win within weeks, not months.
Choose the right fit for your workflow: If you want flexible internal analysis with live data connections, spreadsheet-native automation makes sense. If you need complex consolidation and external reporting, enterprise platforms fit better.
The difference between teams that successfully automate and teams that stay stuck in manual processes comes down to starting small and proving value quickly.
Start automating your financial reporting with Rows – connect your data, use AI to handle categorization and analysis, and share reports that update themselves automatically.
FAQs
Can MS Excel be used to automate financial statements?
Yes. Excel offers Power Query for data connections, Office Scripts for task automation, and built-in Python for analysis. But someone needs to update queries when source systems change, and formulas break if file structures shift. Modern platforms handle these updates automatically.
What are the four main types of financial reports?
The four core financial statements are the Balance Sheet (financial position at a point in time), Income Statement or P&L (revenue and expenses over a period), Cash Flow Statement (cash movements in and out), and Statement of Shareholders' Equity (changes in ownership interest). Automation handles all four by pulling data from source systems and populating standardized templates.
Can financial reporting be automated?
Yes. Automation handles data extraction from multiple systems, transaction categorization, report generation, and distribution. The repetitive mechanics – downloading data, copying into spreadsheets, applying formulas, formatting – can all run automatically. Human judgment is still required for reviewing outputs, handling exceptions, and analyzing what the numbers mean.
What are examples of automated financial reporting?
Common examples include expense reports that pull transactions from corporate cards and categorize them automatically, monthly P&L statements that update when new transactions post to your accounting system, bank reconciliations that match ledger entries against bank statements without manual comparison, and cash flow forecasts that refresh daily based on current account balances and upcoming obligations.

