Chat With Data: How It Works And The Best Tools

Chat with data means asking questions about your spreadsheets, databases, and documents in plain English and getting instant answers. No need for formulas, SQL, or waiting on your data team.
This matters because most of us aren't data scientists, yet we're drowning in data. Marketing managers need campaign ROI comparisons, finance teams want cash flow projections, and founders sit at the top, requiring autonomy over their business metrics. Chat with data delivers these insights without forcing you to become a formula expert.
The reason it works is simple: You upload your data sources, ask questions like "which region had the highest sales growth," and the AI retrieves the right information to answer you. But before you jump excitedly to ChatGPT to test this out, stick with us first, because while it suits basic use cases, it’s not the best fit if you’ve got complex data.
No worries, we’re here to show you what tools can help you. We'll also cover how this technology actually works under the hood and address the privacy considerations that matter when your company data is involved. Let’s get started.
Chat with your data using AI: What it means and how it works
The "magic" isn't magic – it happens in two distinct steps.
First, the AI translates your plain English request into operations it can execute on your data. When you ask "show me sales by region," the system converts that into the appropriate structure – Python code to run on a CSV, a pivot table schema to aggregate data, or a chart configuration to visualize results. This translation step is what makes natural language work with structured data.
And then, at the context level, you have the Retrieval-Augmented Generation (RAG) process. Instead of an AI model just "knowing" the answer, it retrieves relevant chunks from your specific files before generating a response.
Here's the basic flow:
Upload/Connect: You link a source like a CSV or Google Ads account.
Interpret: The system reads headers and sample data to understand context. It sees the "Rev" and "Cost" columns and recognizes them as revenue and costs.
Query: You ask in plain English: "Summarize sales by region."
Visualize: The AI retrieves relevant data and generates a table or chart.
The entire process takes seconds rather than hours of formula writing. But we should pay special attention to the upload and connect part of the flow.
That’s because the type of data you're working with determines which tool you need. Structured data requires different handling than unstructured data. Getting this distinction right is the difference between a tool that solves your problem and one that wastes your time.
Two types of data: Structured and unstructured
Structured data is your CSVs, Excel files, databases like MySQL or BigQuery, and marketing analytics platforms. This data has clear rows and columns where each field means something specific. Tools handling structured data need to understand mathematical relationships, joins between tables, and pivot operations.
Unstructured data includes PDFs, contracts, scanned invoices, and long-form text documents. There are no predefined fields or columns, just information that needs to be extracted and organized before you can analyze it. These files require vision and language models to pull text and tables out of images or documents, then transform that content into structured formats.
The distinction matters because trying to analyze a PDF invoice with a tool built for spreadsheets will fail, and vice versa.
Common use cases
Document querying: Extracting information from PDFs, Word documents, and spreadsheets, then analyzing that data using AI without manual data entry.
Data visualization: Creating tables, bar plots, and charts by asking questions instead of building them manually.
Business intelligence: Allowing non-technical staff to analyze data without learning BI tools or waiting for reports from the data team.
Marketing reporting (The "Stitching" Problem): Instead of copying data from Google Ads, Facebook, and GA4 into separate sheets, then manually combining them, chat with data tools consolidates channels automatically. You can ask questions like "Which platform has the highest ROI?" and get instant answers across all your marketing data.
Key platforms and tools (mapped to jobs)
Once you’ve got a good idea of what kind of data you’re working with, we can move on to the actual tools. We’ve separated these based on the specific jobs they handle best, though you might notice some overlap here and there.
For spreadsheets and structured data
Rows: Built for end-to-end data analysis workflows. Connects to 50+ business tools and lets you share results as interactive websites.
Key differentiators:
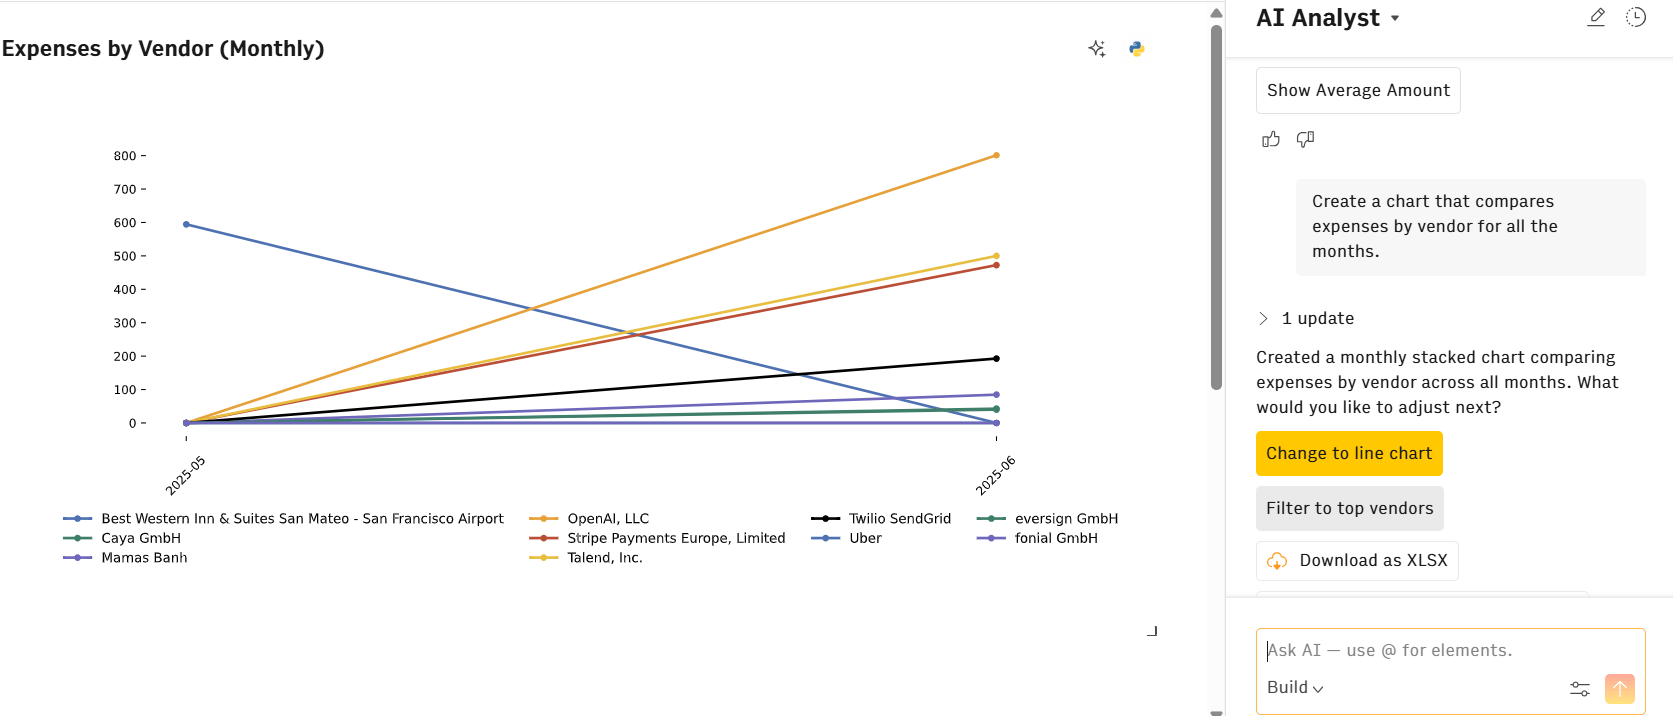
AI Analyst integration: Lives inside the document as a persistent partner, not a side panel. Enables iterative deep dives and collaborative analysis within the same workspace.
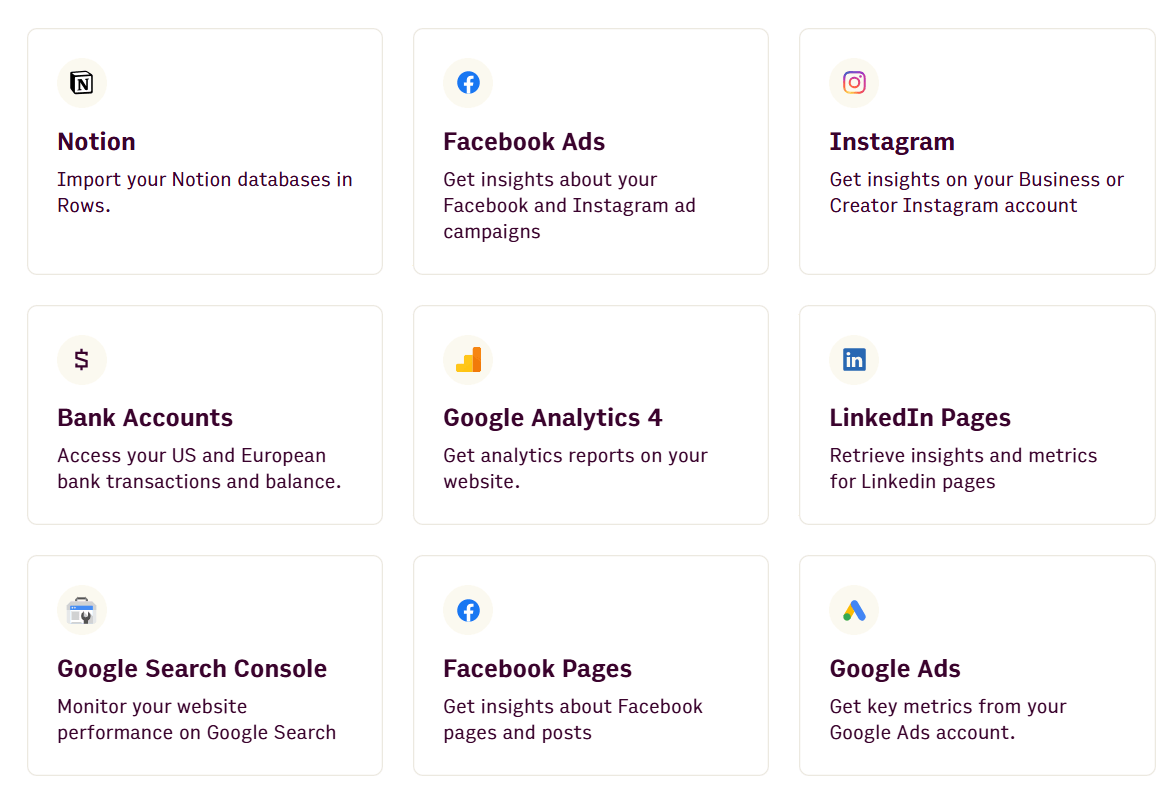
Native data connections: Direct integrations with GA4, Google Search Console, Google Ads, Facebook Ads, and LinkedIn Ads – no third-party connectors needed.
Agentic mode: Import, analyze, and transform data in one continuous flow without switching between applications.
Python-powered analytics: Perform cohort analysis, predictive modeling, and multivariate analytics without writing code, making data science accessible to even non-technical users.
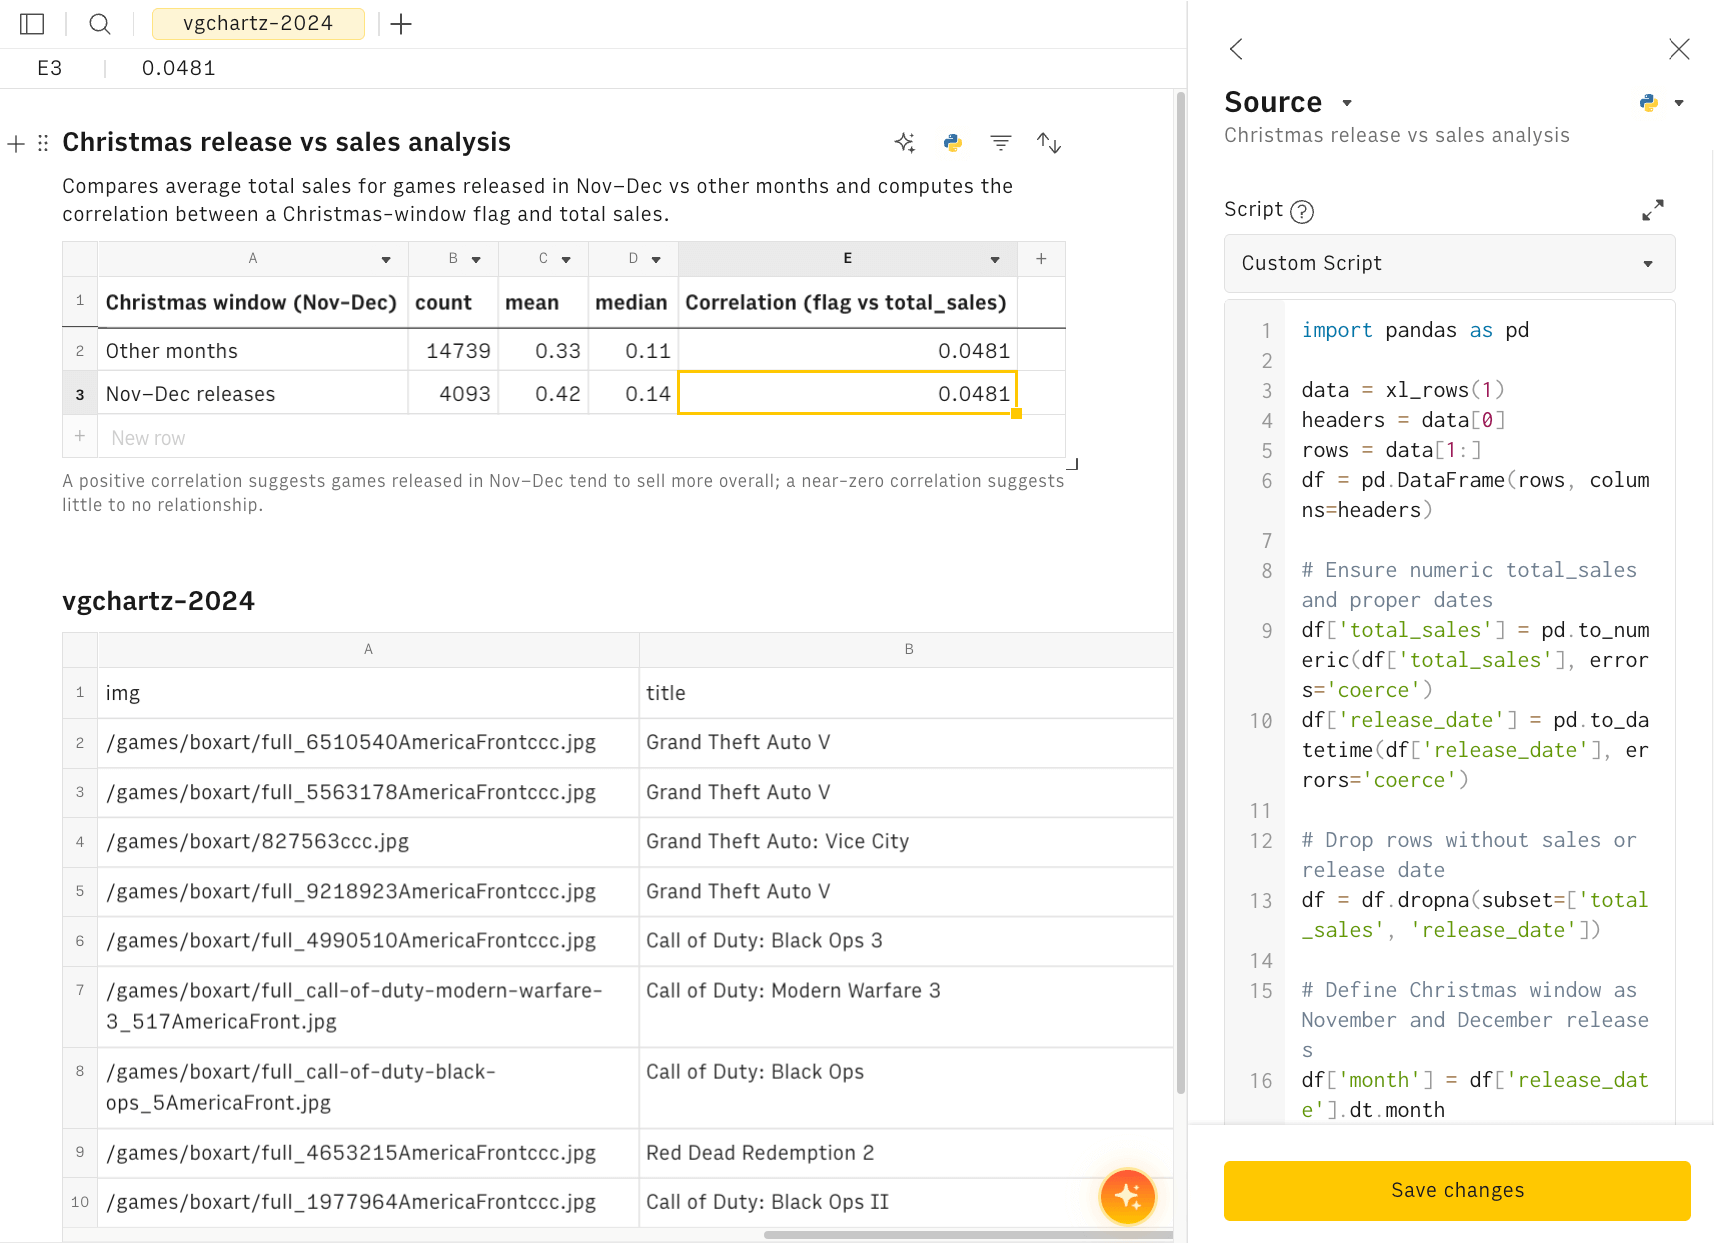
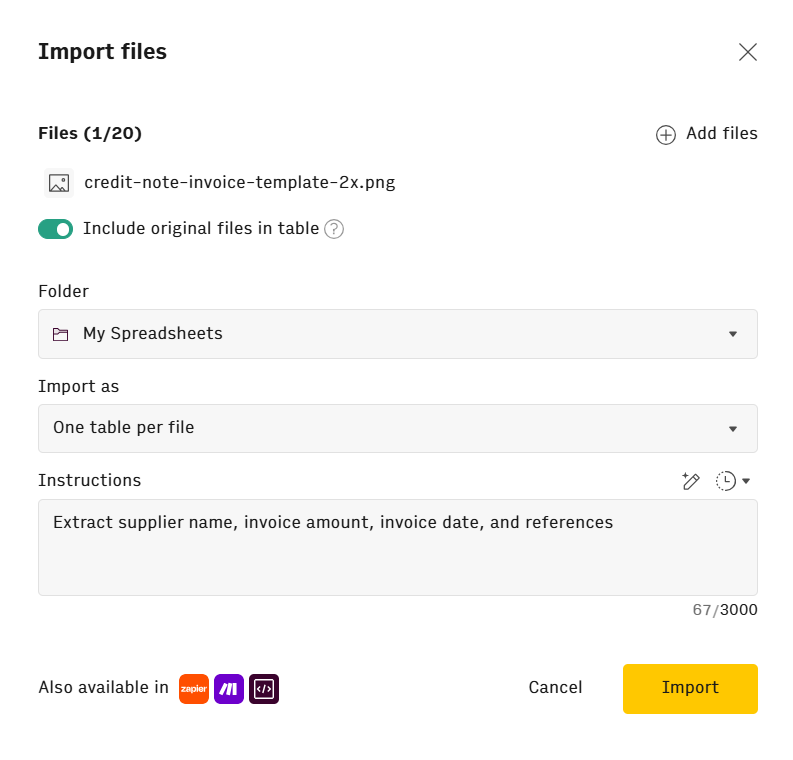
Document extraction: The "See It, Get It" feature converts PDFs, images, and screenshots into editable tables using vision models, bridging structured and unstructured data analysis.
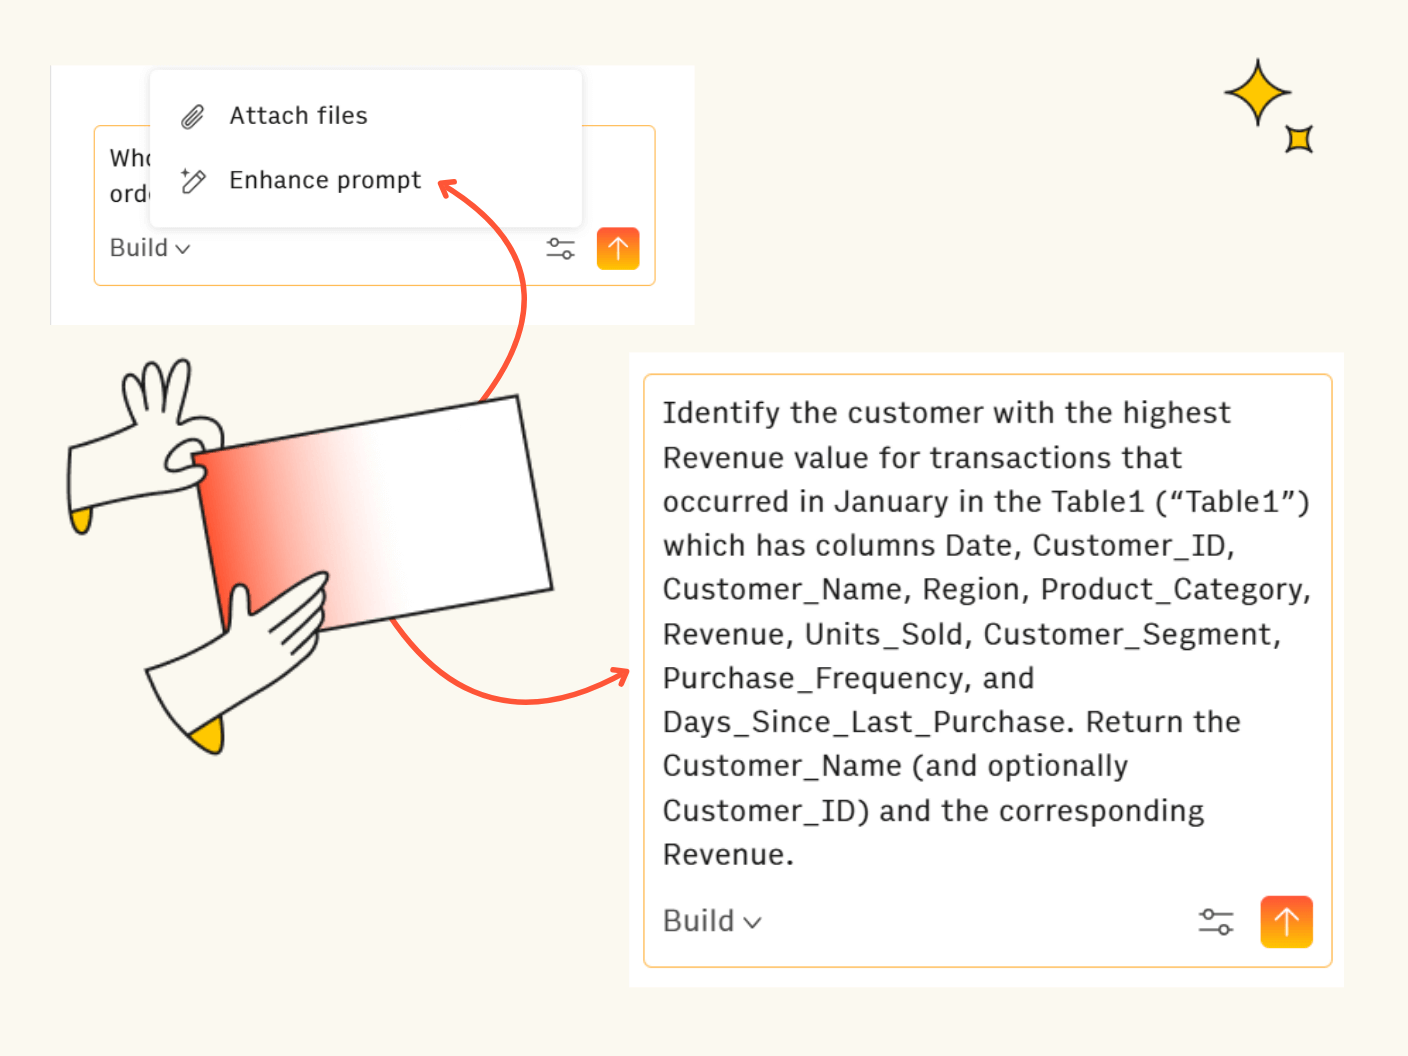
Plus, you don’t need to feed Rows AI Analyst perfect prompts in order to get the answers you need. For instance, you can write “Who was the customer that had the highest order value in January?” and use the Prompt Enhancer to make the statement easier for the AI to understand.
Of course, if you’d rather not jump platform, you can still use Excel Copilot and Google Gemini.
However, they do work differently from Rows AI. These tools typically work through side panels rather than integrating at the cell level. Excel Copilot only works with files stored in OneDrive or SharePoint, and Google Gemini requires specific Workspace subscriptions. Neither offers the "loginless" accessibility of modern web apps.

Turn hours of manual analysis into seconds of conversation
Ask Rows' AI Analyst to create histograms, spot outliers, or check distributions in plain English. Connect your data sources and start exploring.
Start today (no sign-up)🤔 Curious how these tools stack up against each other in more detail? Check out our AI Spreadsheet Benchmark, where we test Rows, Excel Copilot, Google Sheets with Gemini, Julius AI, and Shortcut.
Finally, if you’d rather, you can use Formula Bot. It started as an add-in for generating Excel formulas, but evolved into a web-based chat platform. It’s good for the quick generation of Excel formulas and SQL code when you need to accomplish technical tasks.
For basic one-off analysis
ChatGPT and Claude are perfect for quick, single-file analysis. If you’re summarizing a PDF, brainstorming with data, or exploring a CSV, these are great one-stop shops that’ll give you the answers you need.
But if you’re working with large datasets or have spreadsheets and CSVs that are continuously updated, you’ll need something better. That’s because, when you’re done with a chat (or reach the chat limit), that’s it. Your conversation is gone, and you can’t go back to it. Plus, if you’re looking to do anything complicated with the data, you’d best look elsewhere.
Another option for this use case is Julius AI, an LLM optimized for spreadsheets and charts. You can carry out more complicated analysis and forecasts, though you’ll still have to wrestle with the same shortcomings: Single-session chats and unevolving data.
Unlike Rows, which lets you create a document you can revisit and iterate on, Julius is best suited for immediate, disposable analysis.
For Enterprise BI
These solutions are for data scientists and large organizations dealing with heaps of client data, where you need the highest level of security protocols.
Our recommendations are Microsoft Power BI / Alation. They’re built for massive structured databases and complex technical environments requiring strict governance.
These tools are powerful but often too complex for average business users who just need quick answers from their data.
For customer support
Now, if you’re looking for an AI customer support agent, and scrolled past all of the spreadsheet and data talk that certainly wouldn’t help you… Well done. Your persistent search for an answer is admirable. But you’d be better off with Chatbase / Chat Data.
They’re designed for building AI agents that answer customer questions based on your documentation. These tools sit on your website as widgets, responding to visitor queries using information you've uploaded.
Building custom solutions
If you're comfortable with code and want full control over your chat with data implementation, you can build your own system using frameworks like LangChain.
DeepLearning.AI's LangChain course walks through the fundamentals: Loading documents, splitting them into chunks, managing embeddings, and constructing RAG applications from scratch. Granted, you’ll need to invest time in understanding vector databases, prompt engineering, and model orchestration. This isn’t an afternoon project.
For practical guidance without heavy technical jargon, the Chat with Data YouTube channel demonstrates building reliable AI agents and LLM applications with real examples.
Besides that, GitHub also hosts numerous open-source chat with data projects you can fork and customize, though you'll need to handle deployment, scaling, and maintenance yourself. Though you’ll have a burgeoning community behind you who’ve already gone through the struggles of development and will be more than happy to help you on your way.
However, most business users will find pre-built tools faster and more reliable than custom development. Build your own only if you have specific requirements that existing platforms can't meet, or if you're working with highly sensitive data that can't leave your infrastructure.
Key considerations
Let’s go over some of the factors you should consider before choosing your tool.
Privacy and data security
Understanding what data leaves your environment matters when you're working with business information.
Training vs. processing: Does the tool use your data to train public models, or just process it temporarily? These are fundamentally different. Processing is fine; training on your proprietary data isn't.
What gets shared: Many tools send data away all the time, so make sure you know where it goes. For example, Rows shares only table headers, a sample of up to 5 rows, and basic statistics (like min and max values) with AI providers. The full dataset stays in your environment and it’s not used to train AI models. Check our privacy page for specifics.
Retention policies: Providers like OpenAI may retain data for up to 30 days via API, while others like Groq don't retain data after processing. Know your tool's retention window.
Access controls: Role-based permissions ensure only authorized users can query sensitive data.
Your data stays secure with Rows
Only headers and 5 sample rows are shared with AI models; your full dataset is never used. Try it risk-free with our transparent free tier.
Get started (no sign-up)Accuracy and hallucinations
AI can make mistakes, even with your data right in front of it.
Verification required: LLMs sometimes misunderstand context or make calculation errors. Always verify outputs before making decisions, especially with financial or compliance-critical data.
Grounding reduces errors: Tools that cite their sources and show their work (like displaying the SQL query or formula used) make verification easier.
Performance benchmarks: Rows achieves 90%+ accuracy for complex tasks, but that remaining percentage still requires human review.
Pricing models
Most chat with data tools follow similar structures, but the details matter.
Freemium tiers: Rows offers 5 AI tasks per month on the free plan, letting you test value before committing. Compare this to per-seat pricing from enterprise BI tools.
Usage-based costs: Understand what counts as a "task" or "execution." Each AI message, action, or API call typically consumes one unit.
Hidden expenses: Look beyond monthly subscriptions. Consider integration setup costs, user training time, and ongoing data refresh expenses.
ROI calculation: Measure time saved versus cost. If your marketing analyst spends 5 hours weekly building reports manually, and a tool reduces that to 30 minutes, the ROI is clear.
Get started: Chat with your data today
You now understand how chat with data works, which tools handle which situations, and what to watch for with privacy and accuracy.
The decision comes down to your workflow:
One-off deep dive? Use ChatGPT or Claude for quick analysis you won't revisit.
Daily data wrestling? Rows hits the sweet spot. Connected, flexible, and powerful enough for decision-makers without the BI tool learning curve. Top choice if you live in spreadsheets.
Massive enterprise datasets? Stick with Power BI or similar platforms built for scale.
Start with tools that offer low barriers to entry. Rows lets you use the product immediately without login ("loginless") to test fit before committing. For teams exploring without commitment, Rows' free tier is the perfect choice.