An honest look at how we’re running the Product/Market fit survey at Rows


At Rows, we've been sending our users a Product/Market fit survey for over a year now. Since we last sent it, we rebranded from dashdash to Rows, added 10+ integrations, released the waiting list and onboarded thousands of teams. So, as the end of Q1 2021 was approaching, it was time to send out the survey again.
If you are a B2B company or have been following the tech Twittersphere over the past year, you’ve probably seen multiple mentions of the “Product/Market Fit Survey”. With a few short questions, it promises to be the barometer for where you are on the quest for the holy grail for early-stage startups, Product/Market Fit.
“Product/market fit means being in a good market with a product that can satisfy that market.” — Marc Andreessen
Initially introduced by Sean Ellis a decade ago, the survey re-gained prominence last year when Rahul Vohra wrote a great post on First Round about using the survey at Superhuman. In short, a leading indicator of a startup product/market fit can be measured as the percentage of users who would reply being “very disappointed” when asked how they would feel if they could no longer use your product. If you’re over 40%, you’re golden. If not, you’ve got work to do.
At Rows — a spreadsheet with superpowers — we’ve been using the survey for over a year. We thought it might be useful to others if we shared what we’re doing, what is working, what’s not, and how we’re thinking about it. This is our honest take on the ins and outs of using this survey as an important tool in your business discovery toolkit. Let’s dive in.

Timing and Frequency
For the past year, we’ve been sending this survey every 3 months, usually in the first week of a new quarter. We chose this timing and frequency because:
1) Product roadmap: Large product initiatives are normally delivered in the second half of the quarter, and we want to give our users enough time to experience large product updates before responding to the survey.
2) KPI mapping: We set our company, product, and business KPIs on a quarterly cadence, and the survey should be part of the quarterly objectives.
There is one disadvantage of this timing though. At the end of every quarter, we conduct our “Growth workshop”, where the Product and Business teams get together to lay out the challenges to tackle in the following 3 months and analyze how the previous quarter went.
Since the survey is only sent a few weeks after the workshop, we can‘t use its results directly in our quarterly planning meetings. It is one of the reasons we’re separating the Growth workshop into two sessions: the Quarter Planning, held 3–4 weeks before the end of the quarter, and the Quarter Retrospective, held 2–3 weeks after the quarter is over and all the data has come in.
Audience
We‘re only interested in feedback from people who actually used the product. We’ve defined our audience as users who were active at least in 2 of the previous 6 months. We could have used a much shorter timeframe, but since we have use cases with a daily/weekly/monthly frequency, we felt it would be relevant to gather feedback from a large pool of people.
As general principles, you’ll want to select an audience that:
1) Aligns with the natural frequency of your product: If you’re running a product with daily usage (let’s say Facebook or Gmail), selecting an audience based on the activity of the last 2–3 weeks is probably enough. But if your use case is less frequent (e.g. Airbnb guests), you’ll want to widen the audience.
2) Gives room for churned users to participate: You’re also looking for responses from people who used the product but were not retained. For that, it is important to define an audience that encompasses people who have used the product but left.
Format
As for the format, we keep it pretty much true to the original version by Sean Ellis. We use Typeform to collect the answers.
We run the Product/Market fit survey with 1 multiple choice question, and 4 questions with open answers:
How would you feel if you could no longer use Rows?
Very disappointed
Somewhat disappointed
Not disappointed
N/A—I no longer use Rows
This is where we’re looking for the magical 40% of “very disappointed” users 🎯
What would you likely use as an alternative if Rows no longer existed?
What is the main benefit you received from Rows?
How can we improve Rows for you?
What type of people do you think would most benefit from Rows?
Getting Replies
One of the toughest things is getting people to reply to the survey. Your users are probably busy with multiple projects, have dozens of browser tabs opened, and a long backlog of unread emails. Catching their attention is hard. We’ve tried multiple twists on the survey email, but still see that only 10–20% of recipients respond to the survey. In Q1 2021 we got a 10% reply rate using this email.

The most recent email we sent getting Product/Market Fit survey
We’re seeing that plain text emails work better than “polished” ones (no buttons, no images). We also see that emails from the CEO/Founder resonate better with our audience — and it is indeed our Founders’ priority to connect with users to understand where we are.
Finally, we keep the reply-to email the same as the sender's email (we’re not afraid of getting some emails), and intentionally don’t track open rates, click rates, or collect personal information on who replied to the survey.
Output
Once the results are in, we’re mostly interested in four things:
How are we doing against the 40% goal? This is the barometer of product/market fit and the overarching KPI that comes out of the survey.
How do our users explain the benefit of using Rows? Here, we’re looking for patterns in answer to “What is the main benefit you received from Rows?”. There is nothing better for positioning and messaging than hearing your users describe your product and what it does for them. It is a great — and often humbling exercise — that helps us craft product messaging that resonates with our audience.
What do we need to do to convert on-the-fence users? As pointed out by Rahul in his article, we want to know what we are missing to turn our “somewhat disappointed” users into people that go crazy about us. Most of the time, these will be obvious improvements, but once in a while, you will find something new or something old described in a new way.
Who do our “not disappointed” users think would benefit the most from using Rows? Often, you’ll attract users that are not a great fit for your product: they might be the wrong persona, they got into the product too early, or they just didn’t need your product badly enough. Nonetheless, these users can offer good feedback on who they think the product is for.
After running our last 2020 survey in Q2, we deliberately skipped sending it to our users in Q3 and Q4. During that period we were working on a lot of changes in the product (new brand, new pricing model, introducing workspaces), and it felt irrelevant to survey the users on the product that is about to change so much. After our public beta launch in February 2021 we were eager to speak with the users again and see where we stand now.
Question by question, these were the top insights from our most recent survey (Q1 2021):
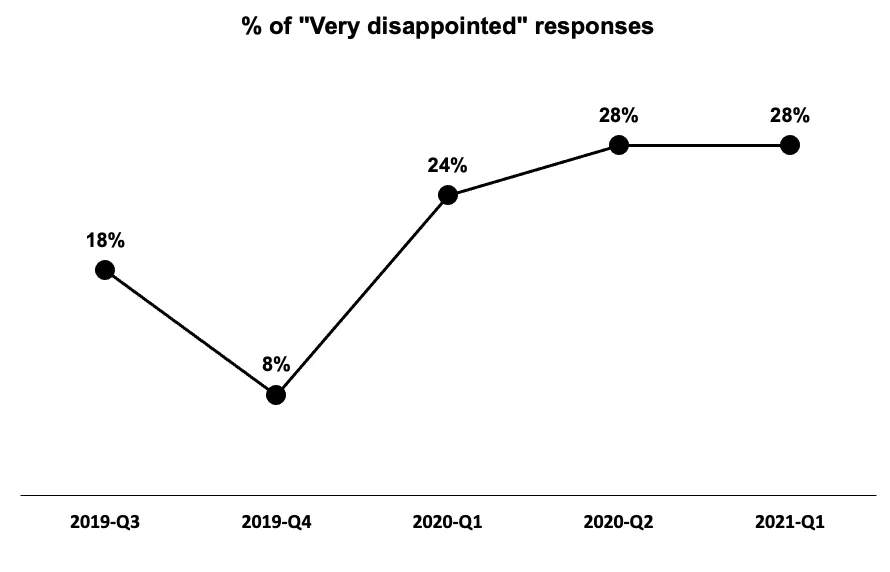
1) How would you feel if you could no longer use Rows?
28% of people responded with "very disappointed". This was similar to the last time we did it. It is an encouraging sign taking into account we had a lot of new sign-ups in Q1 from the funding round announcement and the release of the waiting list.
2) What would you likely use as an alternative if Rows no longer existed?
Not surprising, the majority (45%) of users replied that the alternative to Rows was working in spreadsheets with a combination of manual work and/or automation via scripts.
It becomes clear that for people that are into spreadsheets and need to find/enrich/analyse data from other tools, we're just a much better, faster alternative.
3) What is the main benefit you received from Rows?
Again, aligned with our value proposition and position, the majority (62%) of people highlighted time saved as the number 1 benefit.
"Easy to collect information or data"
"Enriching leads that I got from scraping."
4) How can we improve Rows for you?
This is always our favorite question to analyze. Here, the feedback was clustered in 2 areas:
Making the product simpler to use (picking functions, getting the data, transforming it)
Increasing feature parity with other spreadsheets - add charts, conditional formatting, etc.
All things we are working on now, or are in the immediate roadmap. Now we just need to ship them 🚢.
5) What type of people do you think would most benefit from Rows?
There is always some confirmation bias in these questions. Nevertheless, there are often surprises in the data. This time, the top responses were:
Sales/Business Development
Analysts
Startups/Entrepreneurs
We’re getting there 💪
The output of the analysis is compiled in a short one-pager. We share it with the whole team on Slack, and present it in an All-hands meeting 🙌.

Conclusion
The PMF survey has been an invaluable tool at Rows. It gives us a pulse on how our users feel about the product, a target to chase, leaves us with areas to double down on, and occasionally surfaces new market opportunities. Hearing first hand from our customers about the benefits they see in Rows and areas of improvement is also a great motivator for the team. And in a time where we’re all working remotely, sharing what’s going on across the company is more important than ever.
That being said, my advice would be not to lean too much on the survey results to drive decisions, but rather to inform them. There is a big selection bias in the results — you’ll only get feedback from the small percentage of people who actually responded — and it is easy to get infatuated with the enthusiasm of your most cheerful supporters.
We’ll keep running this survey in the next few quarters and for as long as we feel it is worth it. If you have any feedback, comments, or suggestions (tips on improving the reply rate would be nice), reach out. We would love to hear your thoughts! — Henrique, Head of Growth Natalia, Senior Communications Manager