2022 W42 - Quarter Eval


Rows is now "Building in Public". Every week I'll pick one thing that happened Rows and talk about it!
Read last week's post about managing a board meeting, and about 4 mistakes we did at Rows.
---
Last week we did our Quarter Evaluation. It's a full day dedicated to evaluating every team's performance in the previous quarter:
Teams review each project's goals and results based on data and feedback. There is a simple scale:
0: no impact;
1: objectives accomplished;
2: big impact in the business.
Top management reviews and then presents this assessment to the extended leadership, which includes product managers, engineering managers and designers.
Finally, managers use this assessment to complement the workbooks of their direct reports. We meet again to discuss proposals for promotions, and decide. We compute the new compensation and we're done.
Let's take a look at the Quarter Projects!
Marketing
Increase Activation and W3 retention for Marketing users (1). We improved these 2 indicators, but not as much as we wanted. 2nd-order metrics improved quite a bit, including bounce rates for templates and W1 retention.
Increase the number of shared spreadsheets (2). We released Embedding, and we got to the usage we projected for Embeds. On Q4 we'll jack it up!
Simplify Integrations with Marketing tools (1). We released better versions of our Integrations for Facebook Ads, Youtube, Google Analytics, Google Search Console, Twitter, and Google PageSpeed.
Improve AlphaVantage with better Crypto support (1). We made it much easier to get data for stocks, company financials, and crypto assets. This is a major change for this Integration, and our community asked for it. Because it's not our core use case, the immediate impact on the business is smaller.
Productivity
Grid v3 (1). We released our new Grid for our Shared spreadsheets (Live). The performance is good, though the bigger benefit will be when we release it in the Editor.
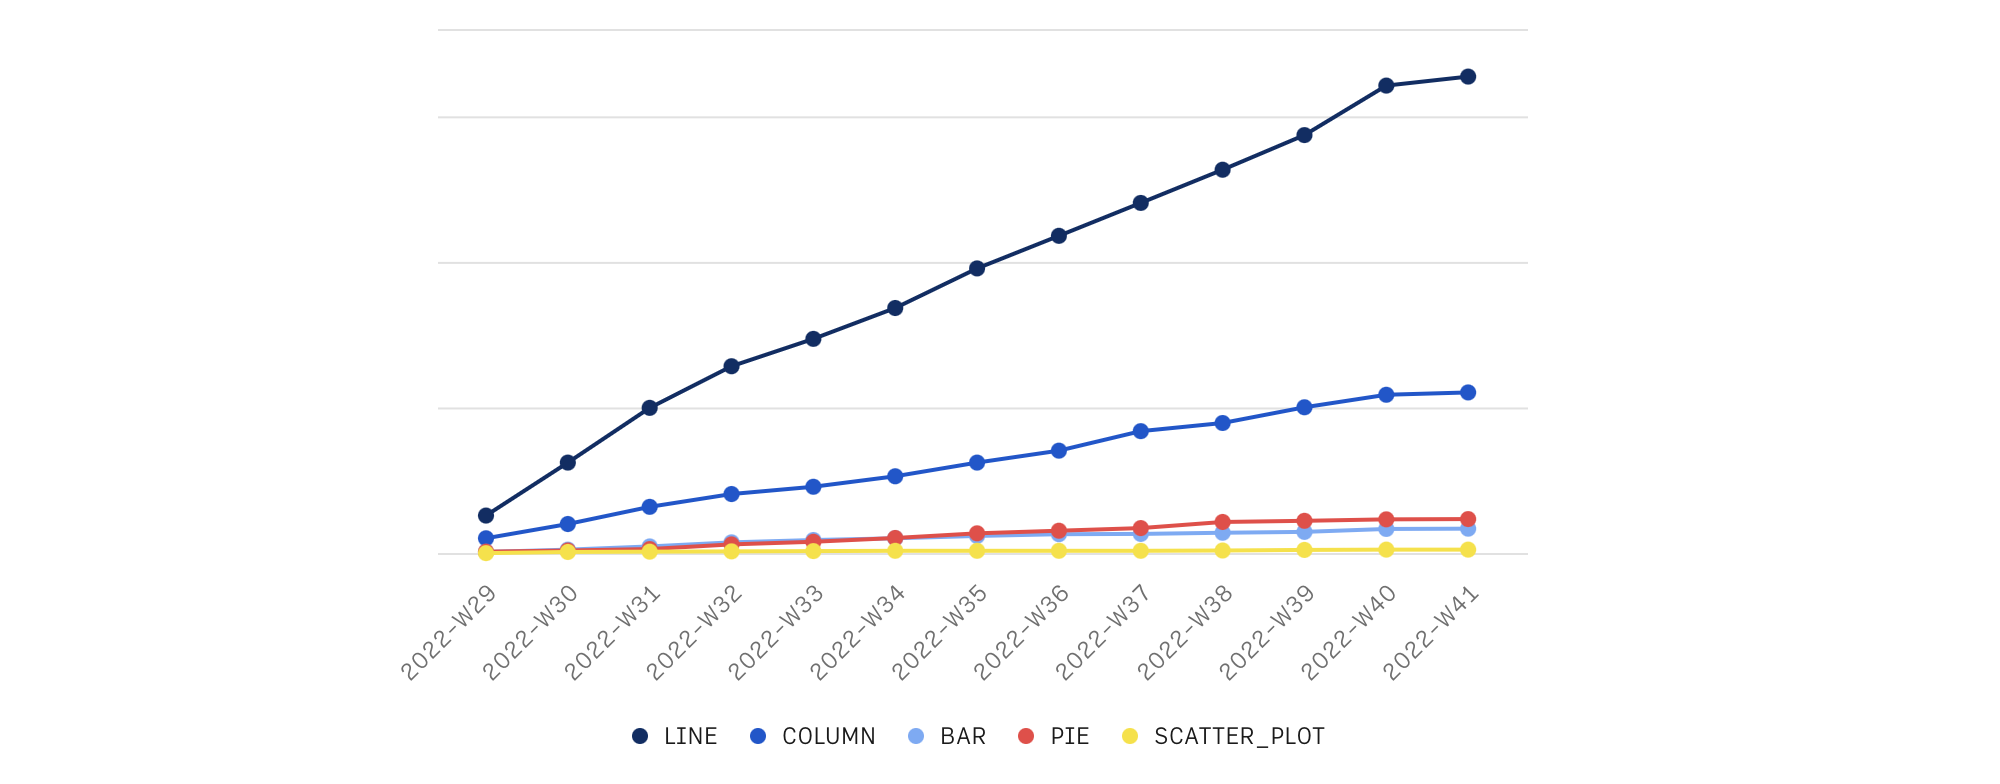
New Charts (1). We launched the Pie and Scatter Plot Charts. People are using them, but their penetration still doesn't compare to Line or Column Charts. Still, Pie Charts beat existing Bar Charts! For now, they are quite impactful for those who need them, but it's not an extraordinary outcome.
Improvements to Live mode (1). Live is our novel way for sharing Spreadsheets, making reports with multiple Tables and Charts shine. Some users couldn't find their way back to the Editor, and we had a couple of bugs on mobile and desktop. We made it all better, and we see less users struggling.
Navigation bar collapse (1). Useful! This was a project from our hackathon.
Sharing & Inviting do over (1). We remade the "Share" panel on the spreadsheet so that users can easily invite users, share a spreadsheet via a link, embed it or publish it to our Community. We also upgraded permissions. No big changes in invite rates yet.

Data
Easier Data Flow (2). We connected our Wizards for finding data and for setting up a table, and made it all much better. Using Integrations improved a lot.
Improve Integration connection process (2). This was on of our biggest reasons for churn new users setting up integrations. We solved it this quarter by giving people better visibility of the status of Integrations and fixing these 2 problems: giving clear feedback that the integration process is complete during integration connection process, and informing what is the default account that is in used when setting up a new action (e.g. you can connect multiple Google Analytics accounts in Rows). We saw users tripping over it, not anymore.
Editing Table headers (1). Our dynamic Data Tables that use Integration sources didn't let you reorder or rename columns easily. Now they do!
Better Company Search (1). Some users were struggling to get data from companies. We made functions super easy, like
=GET_COMPANY("coca-cola.com","size"). Waiting for this to blow up!XYLOOKUP (1). The ultimate lookup function, replacing VLOOKUP and INDEX(,MATCH, MATCH). We already see some usage of it!
Computing
Upgrade spreadsheet limits and performance (2). We went from 5->10 Tables per page; and from 20k->100k rows and 100->404 columns, per table; and we also increased the payload of data cells from 200kb to 2Mb per cell. Meanwhile we made the spreadsheet super powerful! We already see people using this new power, so it definitely paid off.
Improve computing engine latency (2). We shaved 1-2s per computation request on average. That's means that big operations got much faster!
User Success
Convert users to Marketing use case (1). We got a bunch of new users, but not as many as we wanted. So that's a 1.
Improve educational content (1). We redid a number of content pieces, between articles in rows.com/docs and YouTube videos.
---
Overall, July, August and September were good months for Rows. We need more quarters like this!
See you next week!