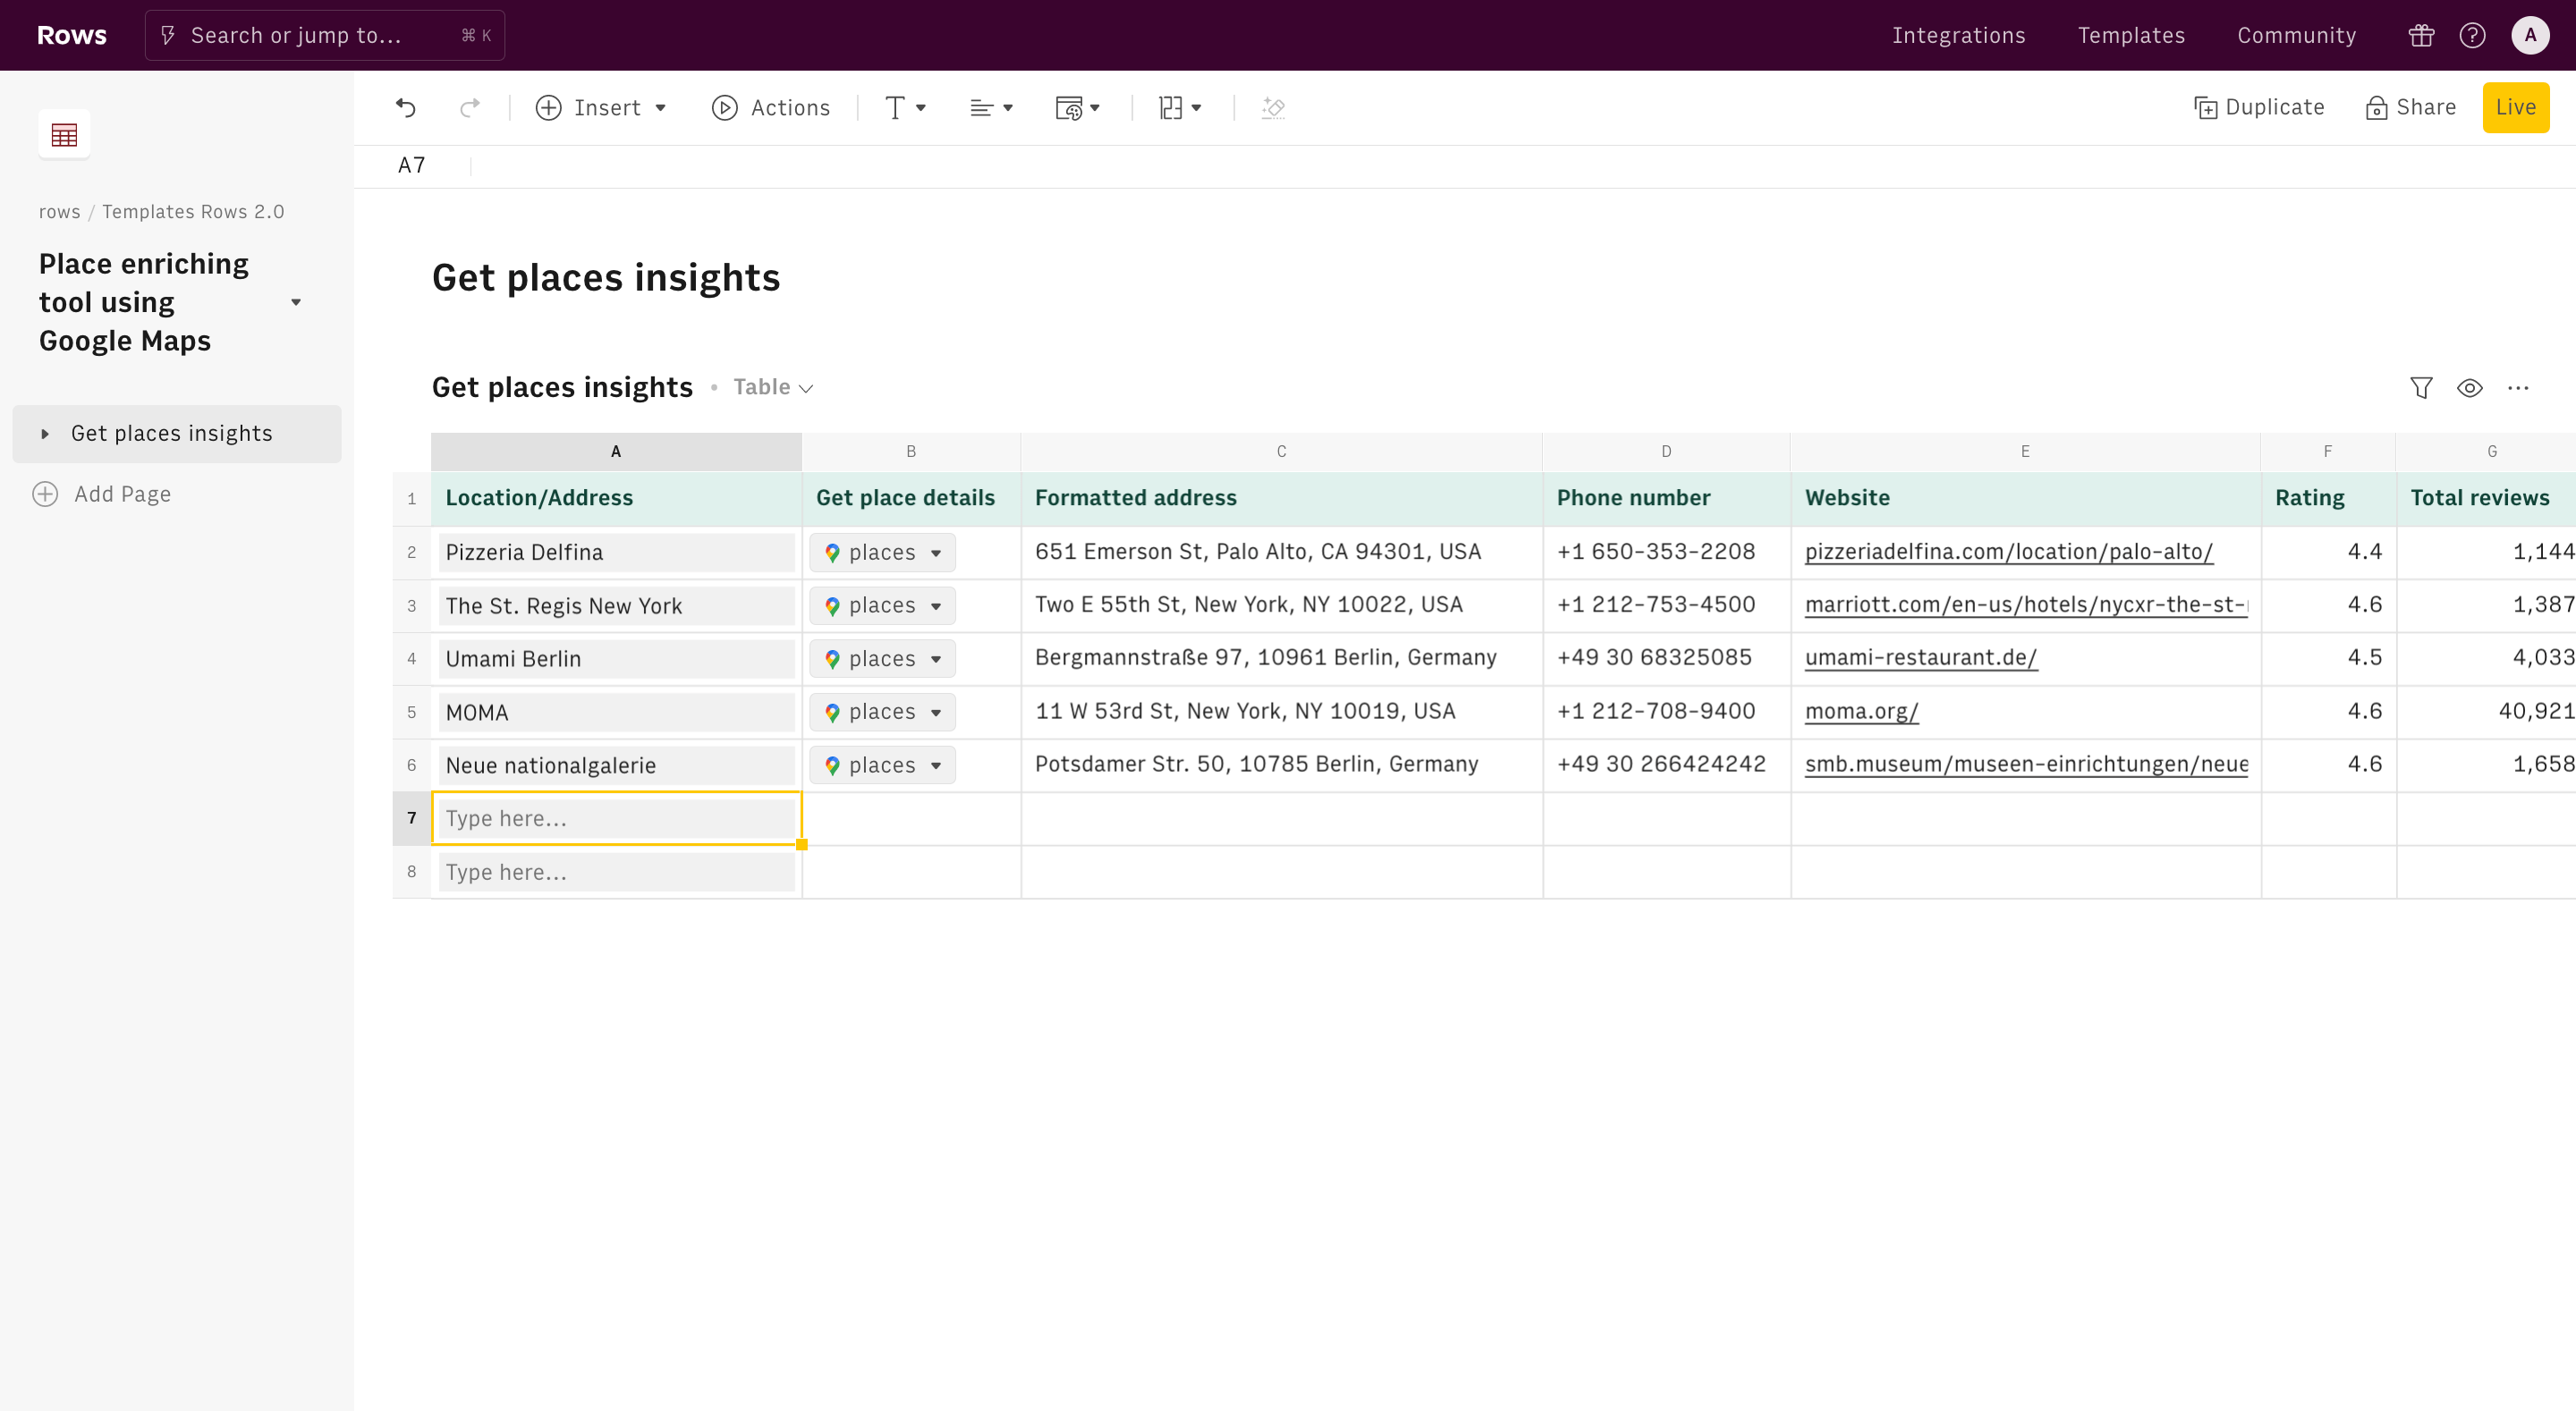
About Company tech stack finder
Checking what technologies certain websites or companies use can be very useful. Not only can you use it to keep an eye on what tools and platforms your competitors use but you can also use it to generate leads by approaching companies who use certain services or similar ones to yours.
Using this template, you can get a list of the technologies that are being used by companies using the company domain, all in a spreadsheet. This includes their CRM, CMS, help desk, hosting provider, analytics tools, website language, and more.
- Enter the company domain you want to look up.
- The BuiltWith function will retrieve the tech stack used by the company and display it in the table.
How it works
How it works
Get started
Click on 'Use template' and start using it right away. No forms, no signup. Your data first.
Connect your Builtwith account
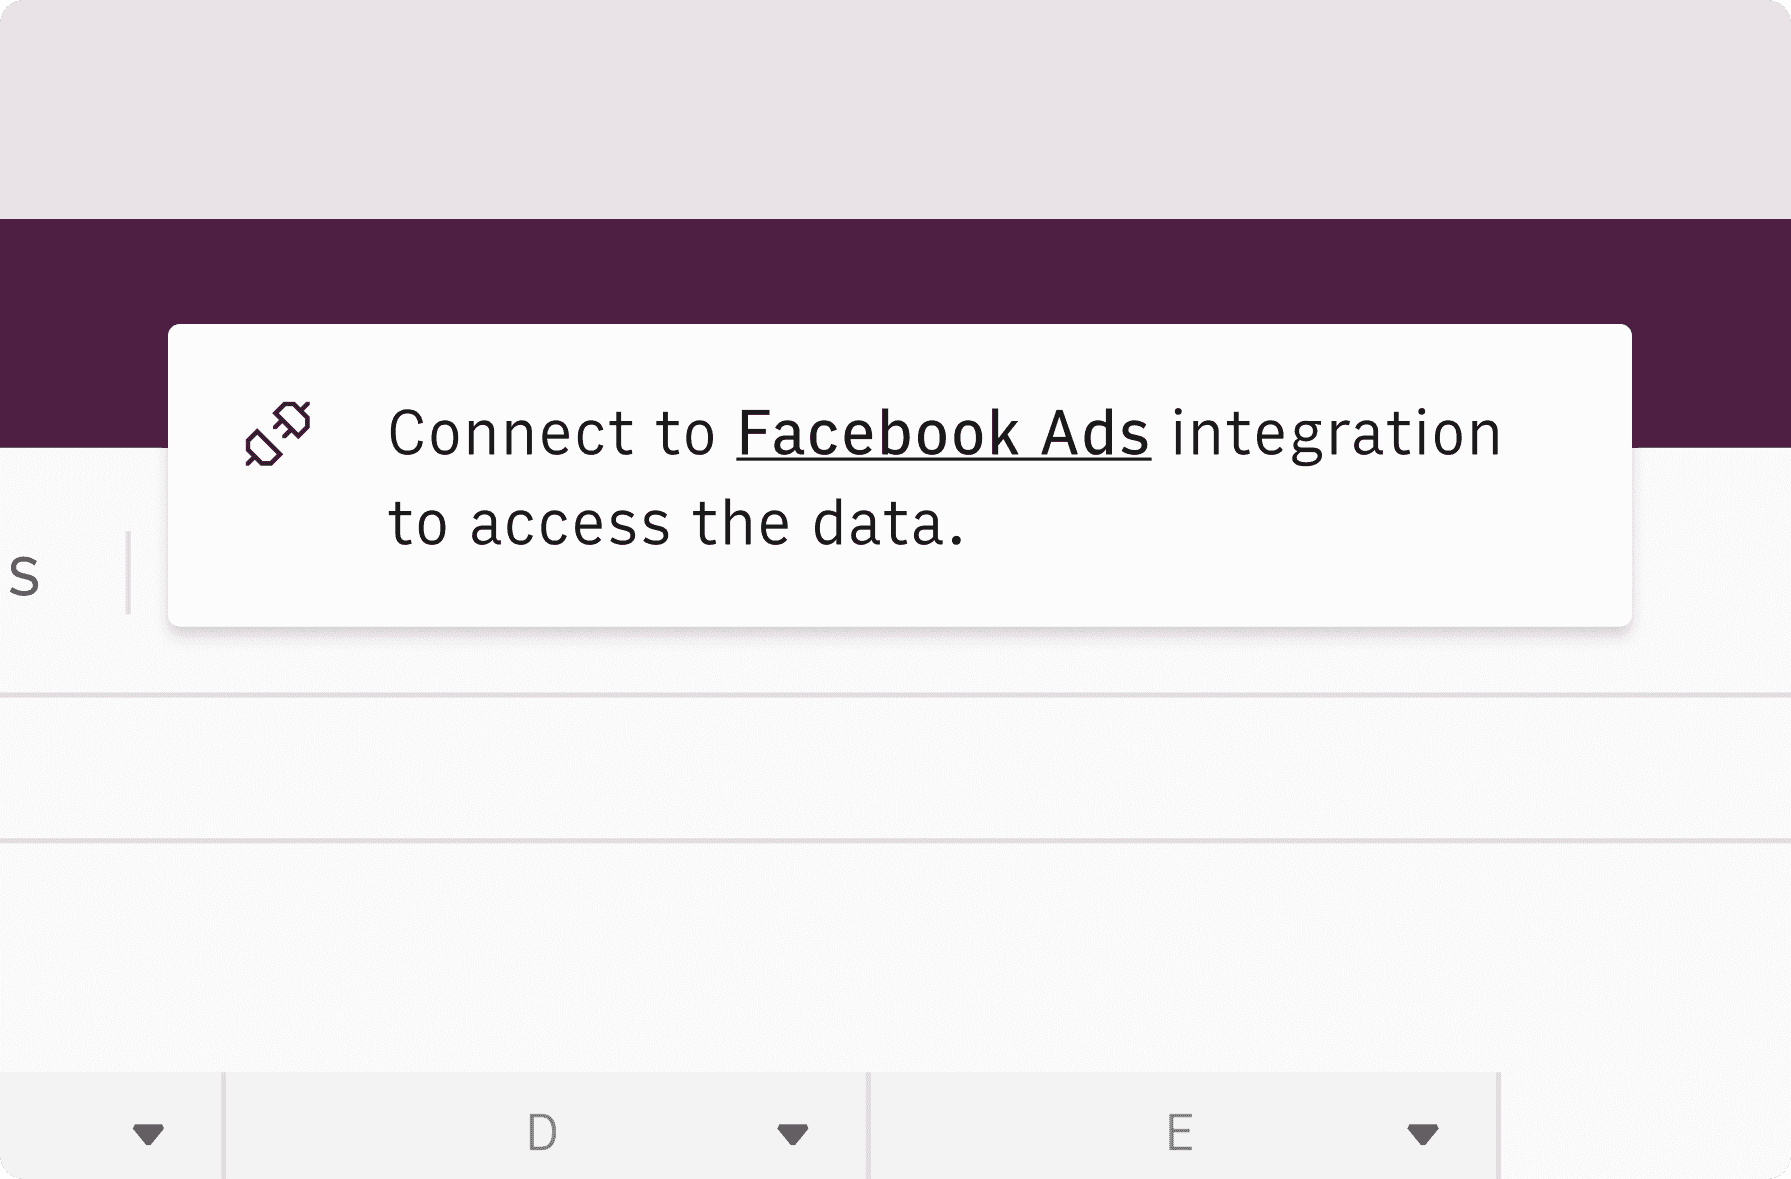
Once landed on the spreadsheet, follow the instructions to connect the required integration and pick your account.
Customize the template and schedule refresh
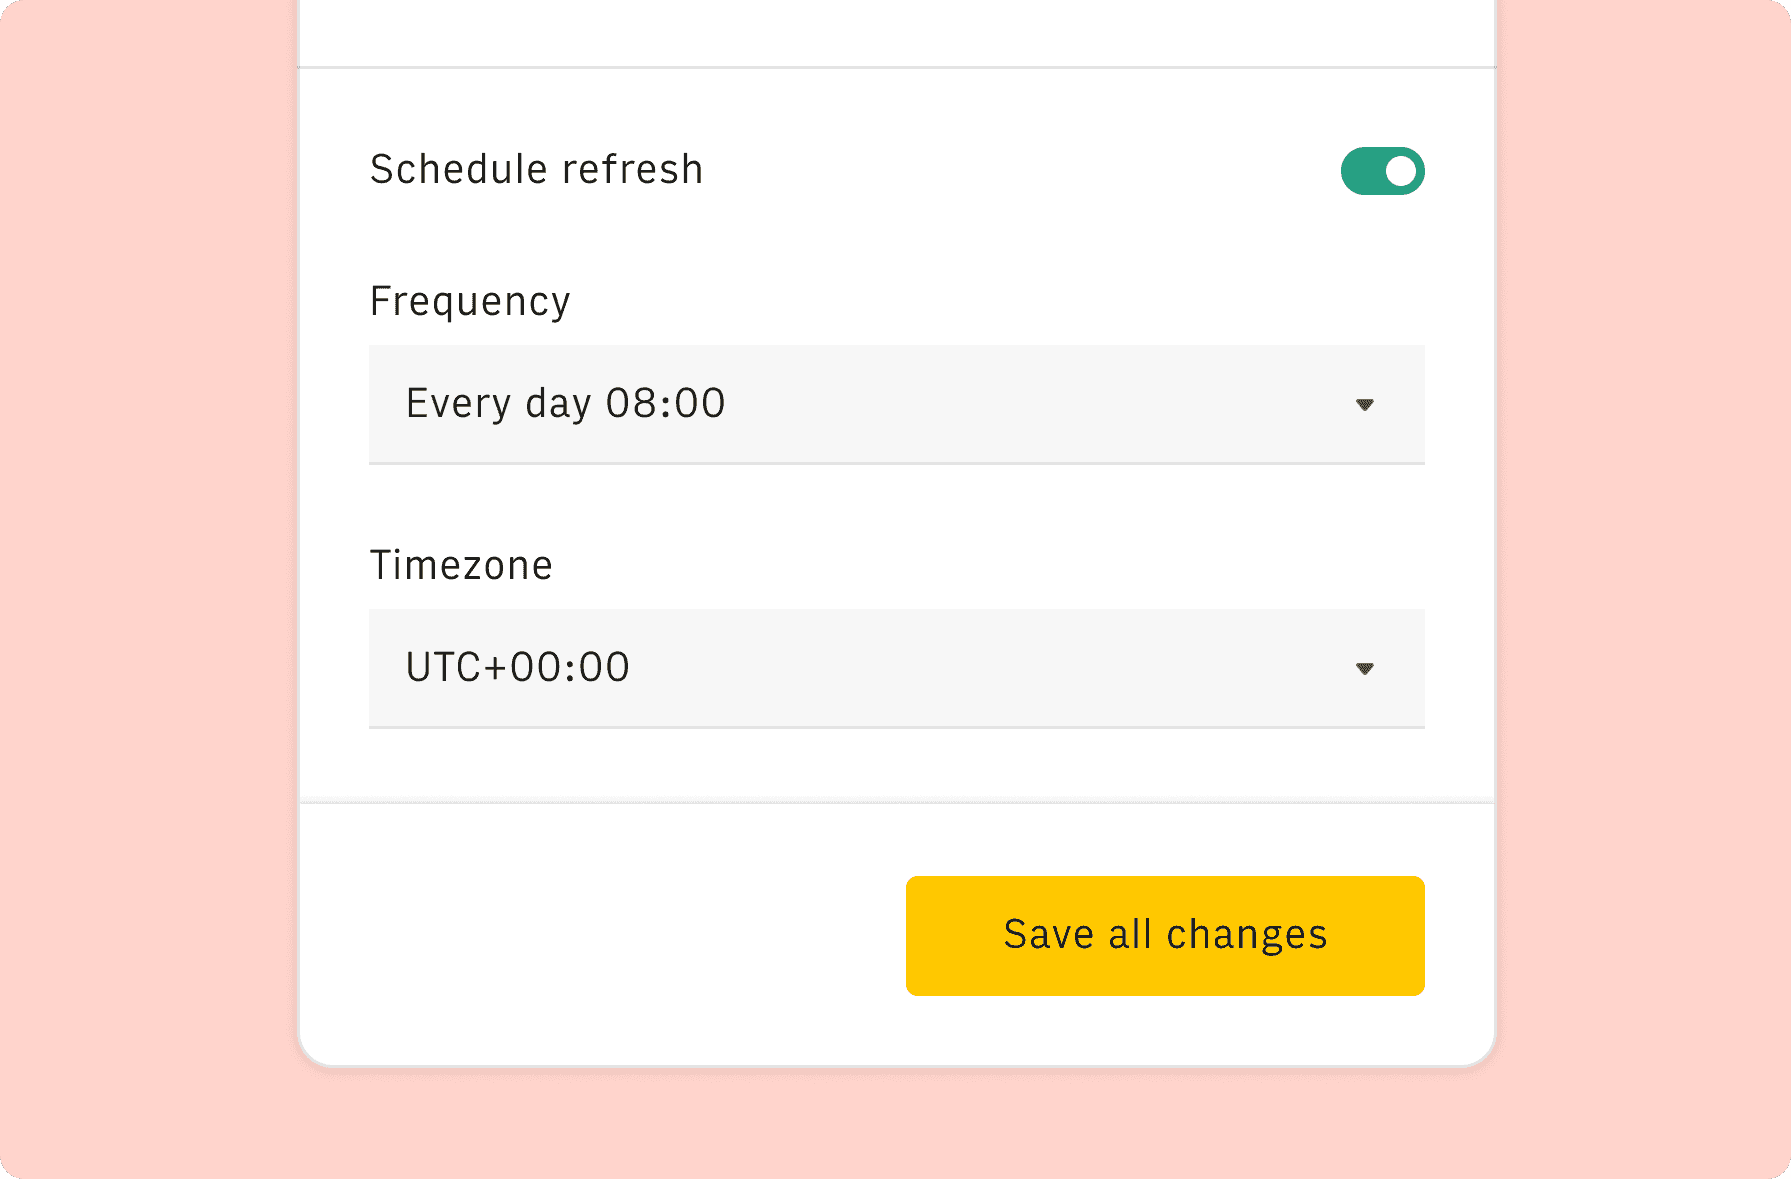
Once the integration has been connected, all tables will update automatically with your own data. Click on 'Edit Source' to change the retrieved data and automate the data refresh. You can then insert a chart or a pivot table, add a column or personalize formats, using all the regular functions and shortcuts that make spreadsheets great.
Embed tables and charts
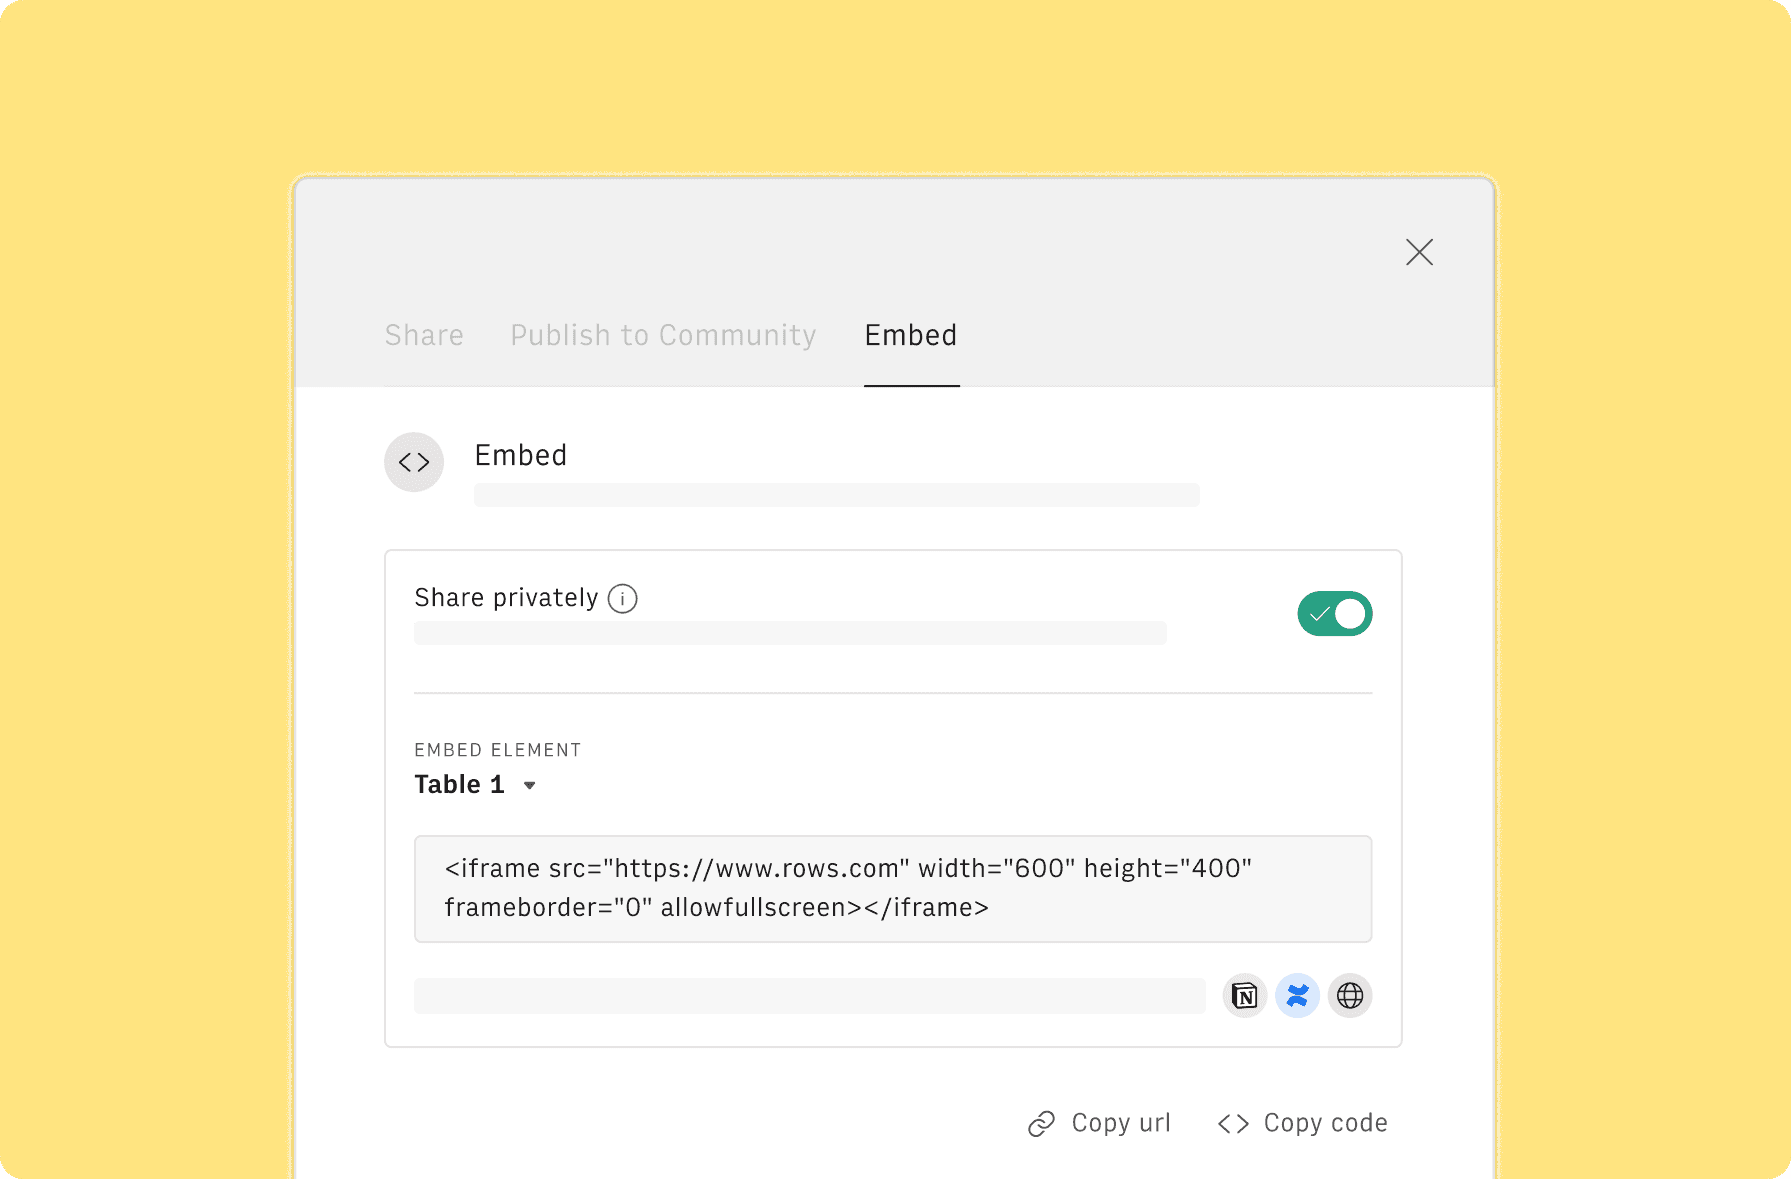
Click on the option menu to embed tables and chart on your Notion, Confluence or any other iframe-ready documents.
Questions and answers
Can I use Rows for free?
More than a Company tech stack finder
Rows is your new AI Data Analyst. It lets you extract from PDFs, import your business data, and analyze it using plain language.
Signup for free
Import your business data
Extract from PDFs and images, import from files, marketing tools, databases, APIs, and other 3rd-party connectors.
Know moreAnalyze it with AI
Ask AI✨ any question about your dataset - from VLOOKUPs to forecasting models - and surface key insights, trends, and patterns.
Know moreCollaborate and Share
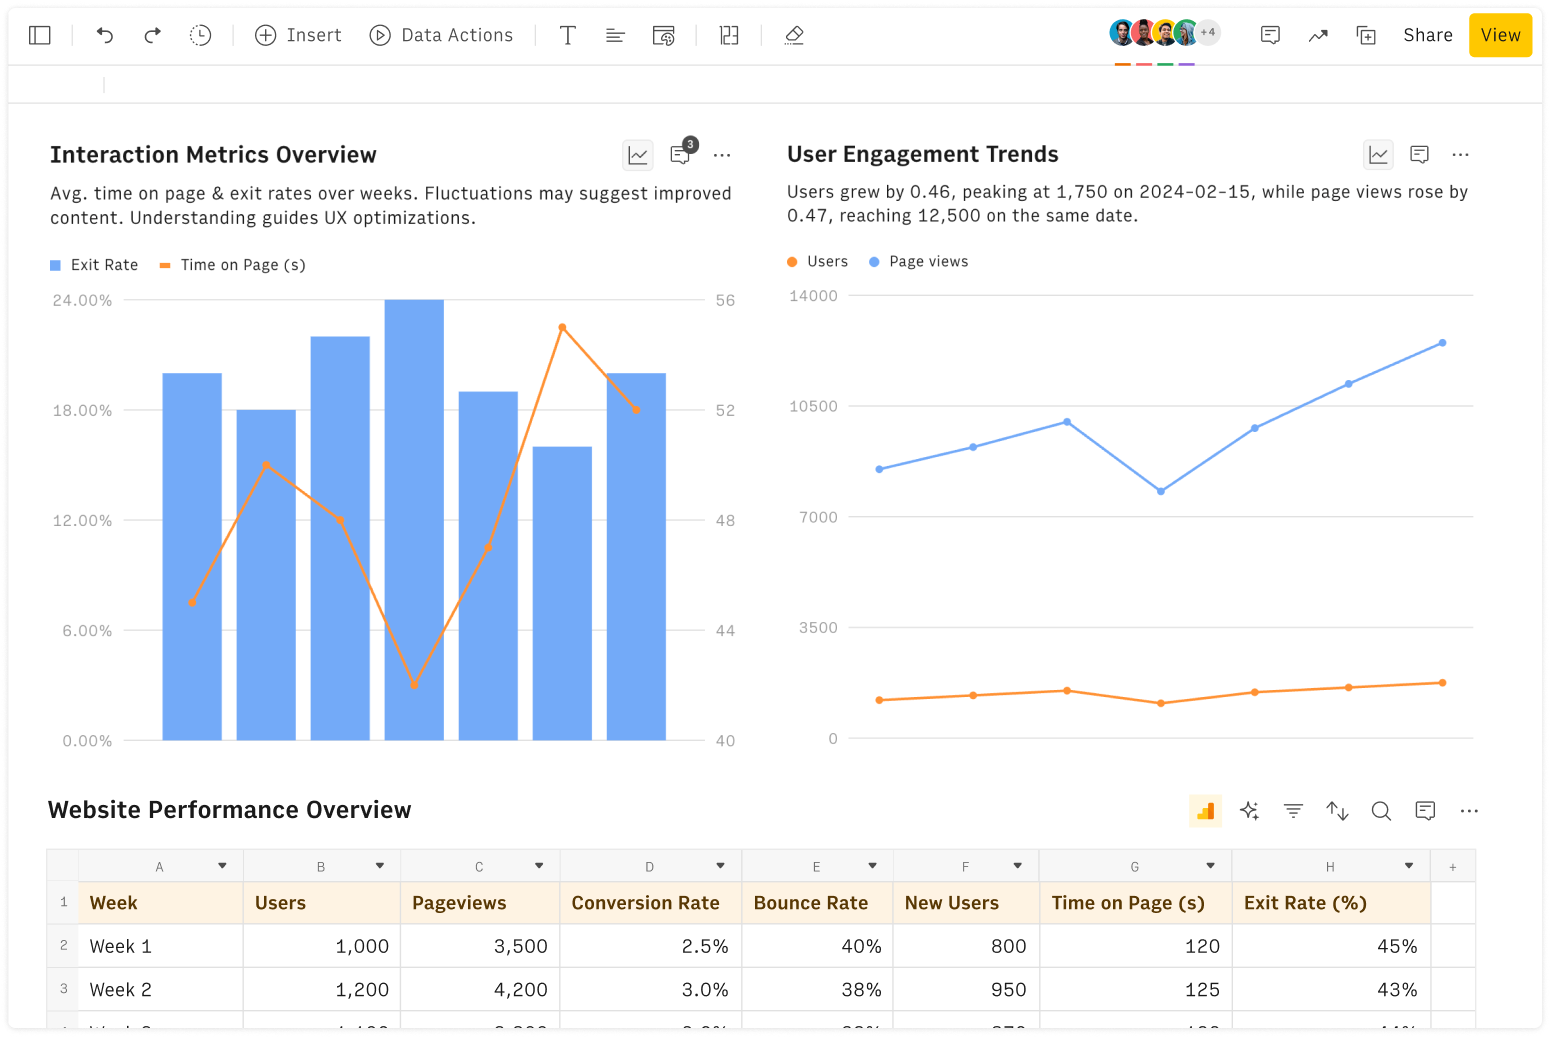
Seamlessly collaborate and share stunning reports with dynamic charts, embed options, and easy export features.
Know more

