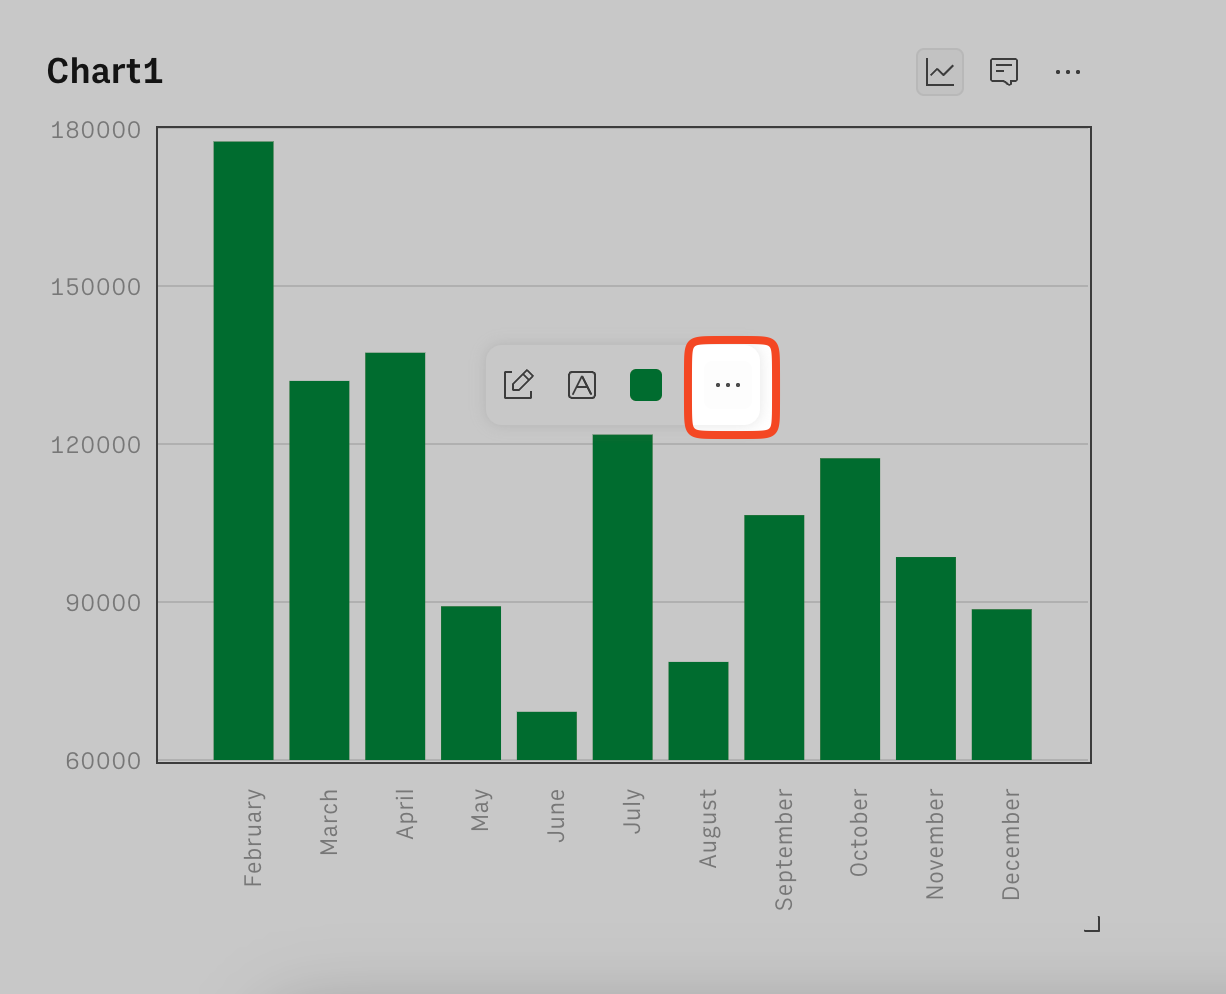
Data labels are a great way to add context to your charts, highlight key data points, and make your visualizations more informative. In Rows, annotating charts is quick and flexible, allowing you to customize labels to suit your needs.

Adding data labels
To annotate a chart, follow these steps —
- Navigate to the chart
- Hover over & click the data point that you'd like to annotate
- Click on the edit icon from the data point editor

- Enter the value you'd want to display as annotated text
Customizing data labels
You can access the customization panel in 2 ways —
- Click on the more options from the data point editor

- Double click on it to open the customization panel like so —

You can choose from the following label positions and styles:
- Label position
- Auto
- Top
- Inside top
- Center
- Inside bottom
- Label style
- Auto
- Text only
- Colored background
- Light background
FAQs
Can I edit or delete annotations later?
Yes, you can 😊 navigate to the data label customization panel and delete the contents of the label to remove the data label altogether.
What if my label overlaps with other chart elements?
Use the label position options to reposition it for better visibility.
Can I annotate multiple data points?
Not at the moment. Feel free to add such feature requests on our feedback board.