How to Use the GOOGLEFINANCE Formulas in Google Sheets [2025]

Imagine effortlessly tracking stock prices, monitoring currency fluctuations, and analyzing market trends without leaving your spreadsheet.
The GOOGLEFINANCE function is your key to unraveling the figures in the world of finance.
Whether you're a seasoned investor, a curious novice, or a business professional, this function will improve the way you interact with financial data.
In this guide, you'll learn how to use GOOGLEFINANCE formulas in Google Sheets.
What is GOOGLEFINANCE?
GOOGLEFINANCE is a powerful built-in function in Google Sheets that lets you import real-time and historical financial data into spreadsheets.
It lets users easily integrate live financial data into their spreadsheets, enabling real-time tracking and analysis of various financial metrics without leaving Google Sheets.
This function provides access to various financial information for stocks, mutual funds, currencies, and other securities.
The general syntax of the GOOGLEFINANCE function is:
=GOOGLEFINANCE(ticker, [attribute], [start_date], [end_date|num_days], [interval])
The parameters are:
`ticker` (required): The stock symbol or currency pair (e.g., "GOOGL" for Alphabet Inc., "CURRENCY:USDEUR" for USD to EUR exchange rate)
`attribute` (optional): The specific data point you want to retrieve (e.g., "price", "pe" for P/E ratio)
`start_date` (optional): The beginning date for historical data retrieval
`end_date|num_days` (optional): Either the end date or the number of days for which to retrieve data
`interval` (optional): The frequency of data points ("DAILY" or "WEEKLY" for historical data)
The following attributes are available for various financial functions:

Your new AI Data Analyst
Extract from PDFs, import your business data, and analyze it using plain language.
Try Rows (no signup)How to use the GOOGLEFINANCE function?
There are many use cases of GOOGLEFINANCE in Google Sheets ranging from currency exchange rate evaluation to stock analysis and investment portfolio tracking.
For you to carry out specific tasks with GOOGLEFINANCE, you need specific formulas.
The formula for tracking stock is never the same as the formula for tracking currency. Each use case comes with its special attribute or ticker.
For this article, we are going to teach you how to use the GOOGLEFINANCE function to execute 4 important tasks in the area of finance. With these tasks, you can drive important informed business decisions and boost financial literacy.
The first on the list is:
How to use GOOGLEFINANCE function to get historical data about stocks
The stock market is complex and constantly evolving with each passing day. For investors, analysts, and financial enthusiasts, having access to accurate historical stock data is crucial for making informed decisions.
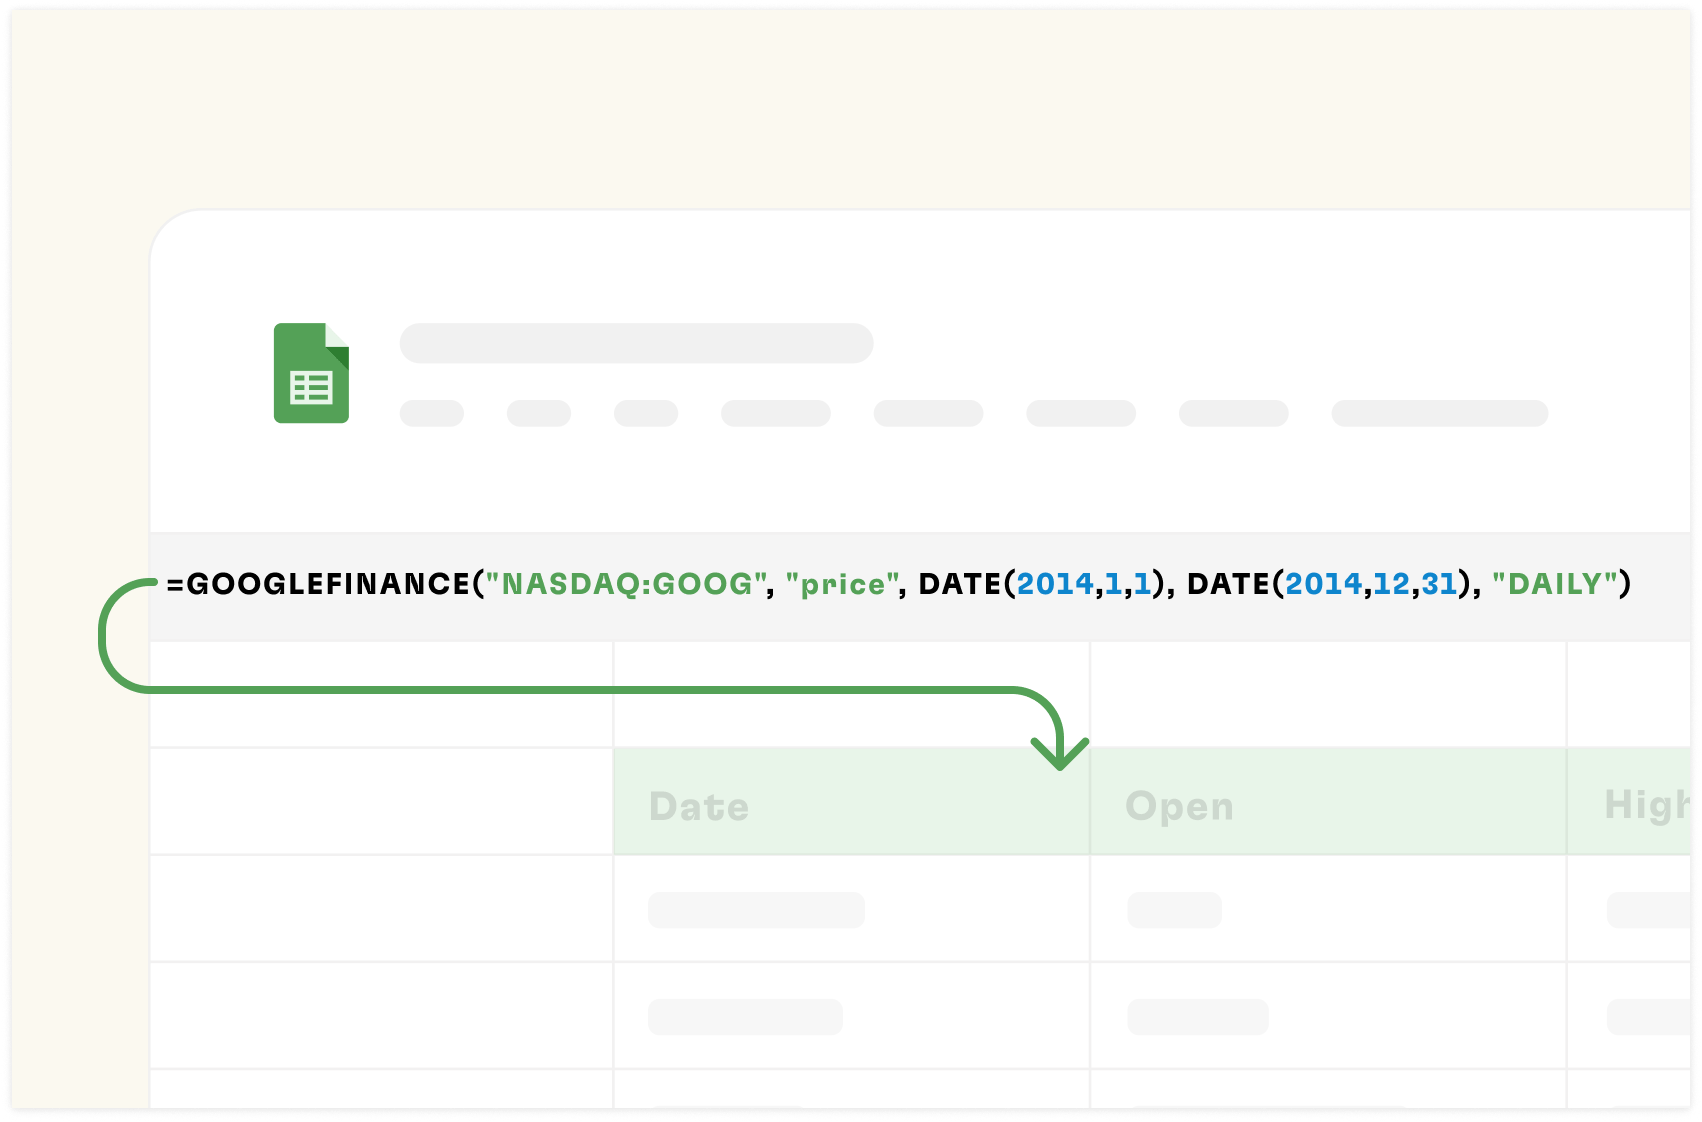
When researching the stock market performance of Tesla, Inc., you should gather historical data to analyze trends and make predictions. Tesla's ticker symbol is "NASDAQ:TSLA"; "close" is the argument for the closing price for the specified date span. Here is the GOOGLEFINANCE formula to use:
=GOOGLEFINANCE("NASDAQ:TSLA", "close", DATE(2023,1,1), DATE(2024,1,1), "DAILY")
So, let's go straight in to the steps:
Step1: Open Google Sheets
Go to sheets.google.com and create a new spreadsheet or open an existing one.
Step 2: Understand the GOOGLEFINANCE Function Syntax
- The basic syntax for historical data is:
`=GOOGLEFINANCE("ticker", "attribute", start_date, end_date, [interval])`
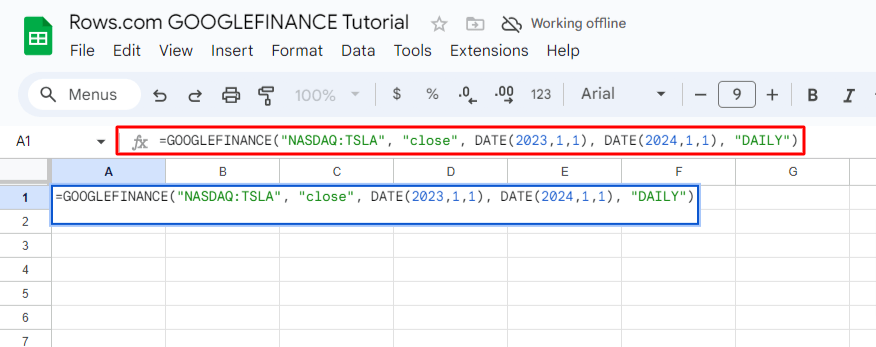
For this example, I am using: =GOOGLEFINANCE("NASDAQ:TSLA", "close", DATE(2023,1,1), DATE(2024,1,1), "DAILY")
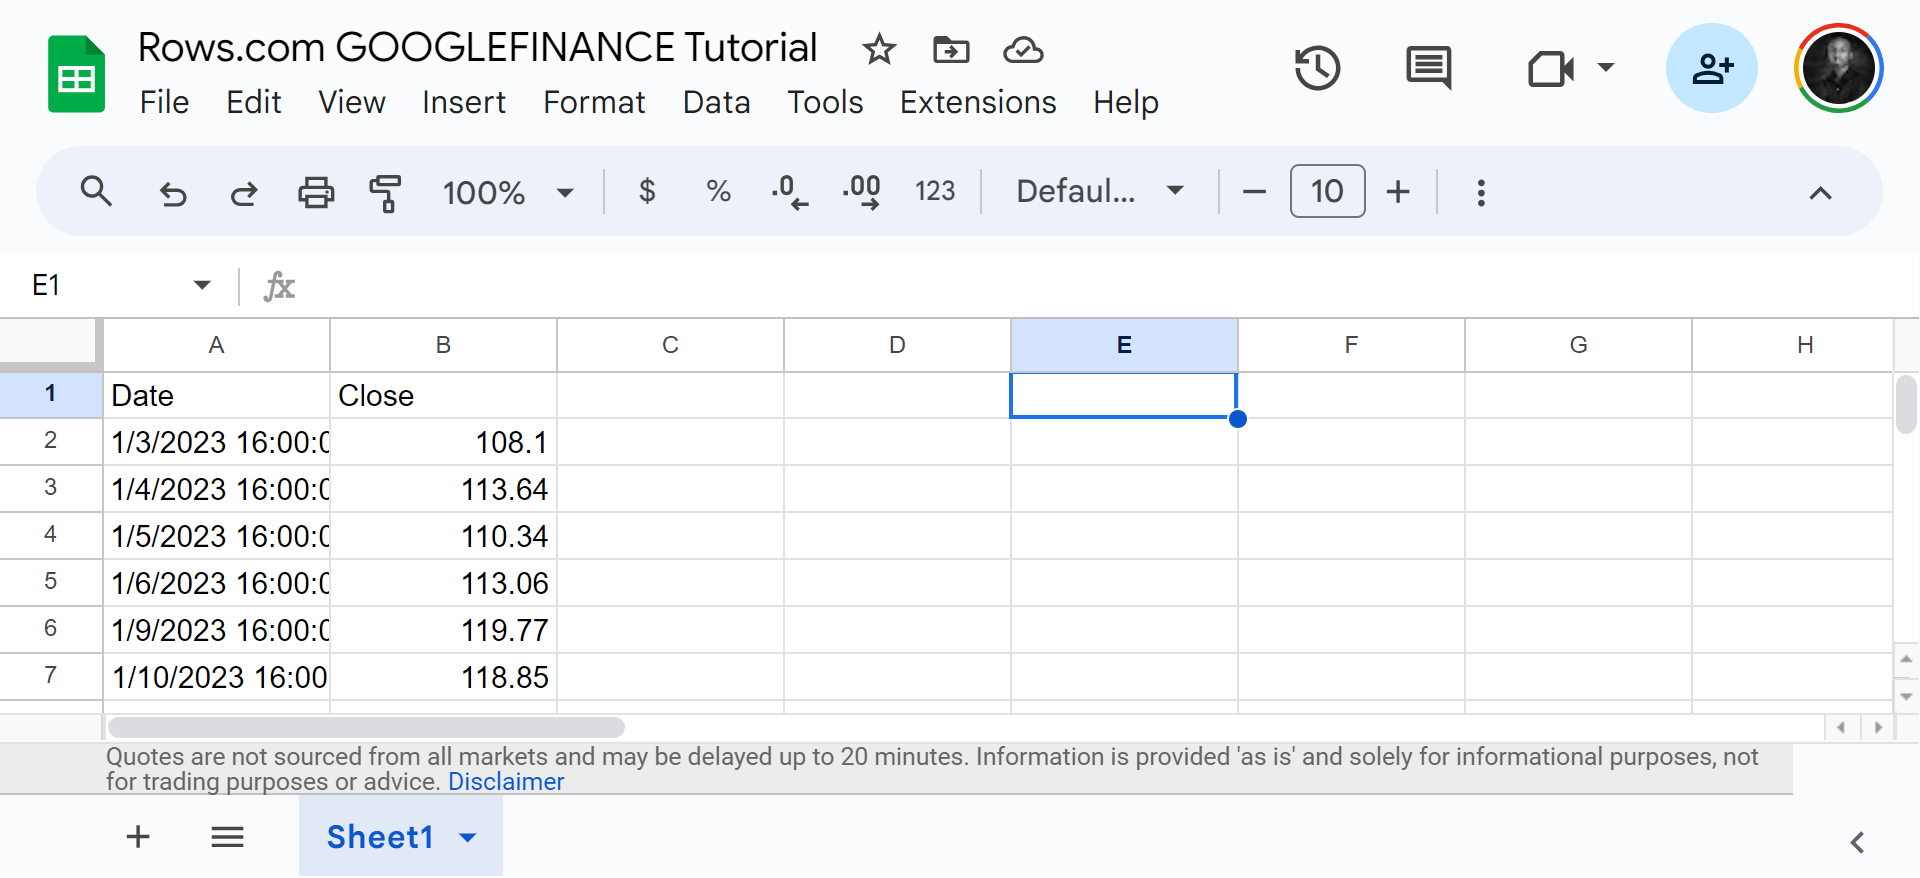
Once the formula is typed in, press the “enter tab” on your PC . Here's the result I got. A comprehensive overview of all stock value for the said date in 2023.
How to track stocks using the GOOGLE FINANCE formula
Many people track current stocks to:
Assess performance over time
Make timely buy or sell decisions
Diversify their investments
Understand market sentiment and economic conditions
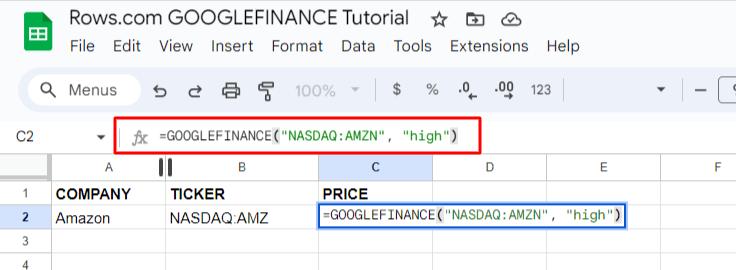
For this example, we are tracking the stocks of Amazon on NASDAQ with the attribute — Volume
Begin by writing down the ticket symbols of the company you are interested in to get your current stock value price.
=GOOGLEFINANCE("NASDAQ:AMZN", "high")
Where;
NASDAQ is the stock exchange where the ticker is listed
AMZN is the ticker symbol.
And “high” is an attribute.
Step 1: Input the formula. Note: you can switch companies, as long as the company's stocks is live on NASDAQ. Once done, click “enter”.
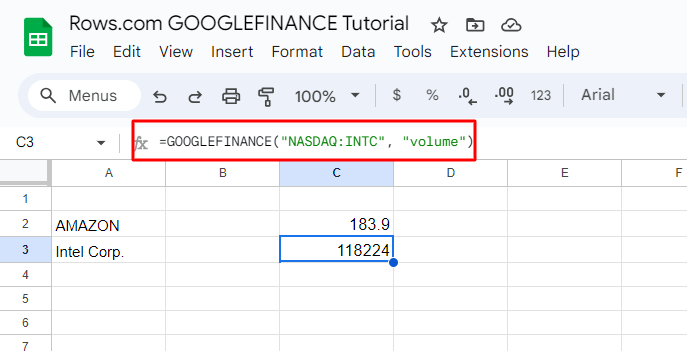
Here's another example;
GOOGLEFINANCE("NASDAQ:INTC", "volume")
Intel Corporation (INTC):
How to use GOOGLEFINANCE for currency exchange rate
People monitor exchange rates for different reasons, either to plan international transactions, manage currency risk in investments, budget for overseas travels, or analyze global economic trends.
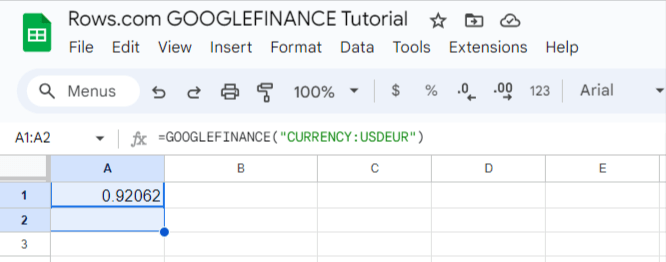
For this example, I'm going to be checking out the exchange rate for USD (United States Dollars) to EUR (Euro):
To carry out this function, I'll use this syntax:
=GOOGLEFINANCE("CURRENCY:USDEUR")
You can choose to switch the abbreviation for any currecny you want to check.
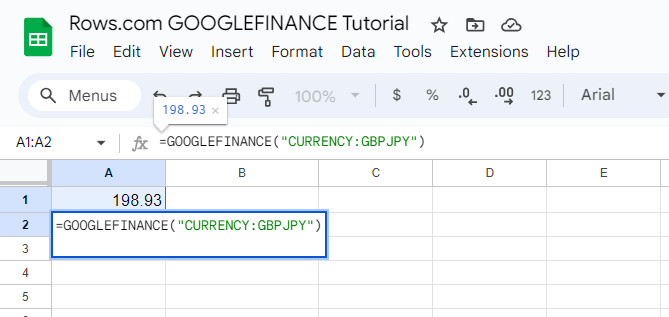
Another example, for GBP (Great Britain Pounds) to JPY (Japanese Yen):
=GOOGLEFINANCE("CURRENCY:GBPJPY")
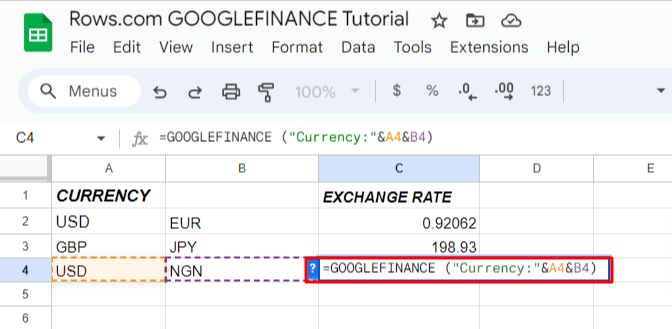
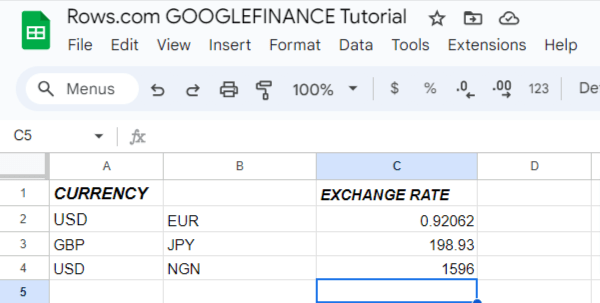
Alternatively, you can choose to use the “cell method”. In this method, you'd have your currency abbreviations set for each column.
From there, you can use the same syntax but this time around switching the currency to their implying cell number on the spreadsheet.
For this example, I used: =GOOGLEFINANCE(“Currency:” &A4&B4)
How to Import Historical Currency Exchange Rates with GOOGLEFINANCE
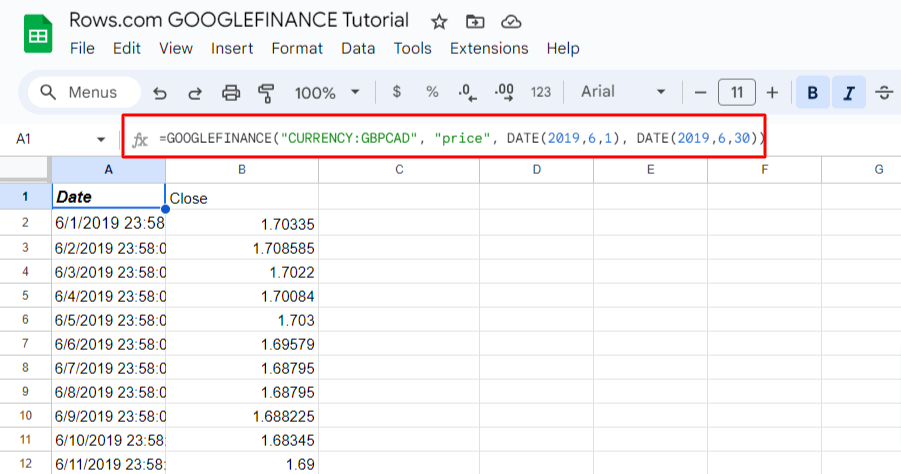
The good thing about the GOOGLEFINANCE function is that you can have an estimate of both past and present financial data. For this example, I'm going to evaluate the price of the exchange rate of Great Britain Pounds to Canadian Dollars from the 1st of June, 2019 to 30th of June, 2019.
Using this syntax;
=GOOGLEFINANCE("CURRENCY:GBPCAD", "price", DATE(2019,6,1), DATE(2019,6,30))
Pros and cons of using GOOGLEFINANCE
Pros ✅
It is flexible and dynamic.
Cons ❌
Syntax is Prone to Error. There are many formulas for multiple use cases, so it can pose a steep learning curve to handle very complex tasks.
You cannot pull aggregations of data points: you need one function for each parameter.
Untidy UX: If you don't select the right cell, figures will be in an inappropriate position in your spreadsheet or will collide with other values, generating errors.
How to use finance functions in Rows?
Rows is a comprehensive spreadsheet for modern teams that offers better UX for data ingestion and has native AI capabilities (AI analyst, AI-generated subtitles, native AI functions).
With Rows, you can use Alpha Vantage to retrieve single KPIs, time series or aggregated overviews of financial data, from price quotes and FX or Crypto time series to company's entire financial statements (p&l, balance sheets and cash flow statements)
Connecting Alpha Vantage with Rows lets you track real-time and historical stock, FX, and cryptocurrency data using the Alpha Vantage Stock Market API, all in a spreadsheet.
What are the Uses cases of Rows Finance Functions?
Things you can do when using Alpha Vantage with Rows include:
Retrieve real-time stock data.
Retrieve real-time exchange rates for any pair of digital currency (e.g. Bitcoin) and physical currency (e.g. USD).
Returns lists of equities and market data by company name, symbol, or keyword.
Retrieve real-time and historical daily, weekly, monthly and intraday stock data.
Retrieve real-time bid and ask prices for physical currency (Forex) pairs.
Retrieve real-time and historical sector performances calculated from S&P500 incumbents.
To use finance functions watch the following videos:
How to import a stock price based on a list of tickers
2. How to get aggregated KPIs for a single stock, including descriptive statistics, EBITDA, PE ratio, Earning per share.
3. How to get a company income statement (P&L)

The spreadsheet powered by AI
Access the power of AI to analyze, summarize and transform data. Build better spreadsheets, faster.
Try Rows for FreeHow does Rows compare with the GOOGLEFINANCE function?
While GOOGLEFINANCE function is very beneficial in Google Sheets, Rows poses some advantages with its automation capabilities and templates. Take a look at 3 advantages of Rows over Google Sheets when it comes to importing financial data into spreadsheets.
Advanced data aggregation
Rows lets you pull way more complete aggregations of data points. It doesn't just offer only single (or time series of) values, like 'price', or 'high', but sets of financial KPIs at once, such as the entire balance sheets, income statements and cash flow statements, including both US GAAP and non-GAAP indicators through the following functions:
GET_COMPANY_OVERVIEW_ALPHAVANTAGE, which provides a snapshot of the main KPIs of any listed company, including PE ratio, EPS, Market Cap, etc.
GET_INCOME_STATEMENT_ALPHAVANTAGE, which gives you the full Profit and Loss statement of any listed company
GET_BALANCE_SHEET_ALPHAVANTAGE, which gives you the full balance sheet statement of any listed company
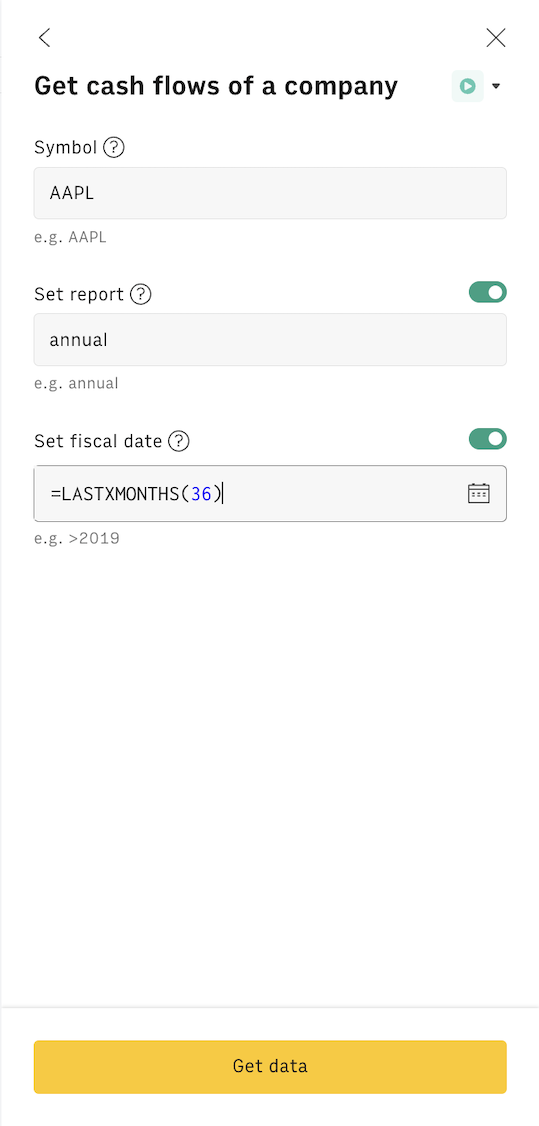
GET_CASH_FLOW_ALPHAVANTAGE, which gives you the full cash flow statement of any listed company
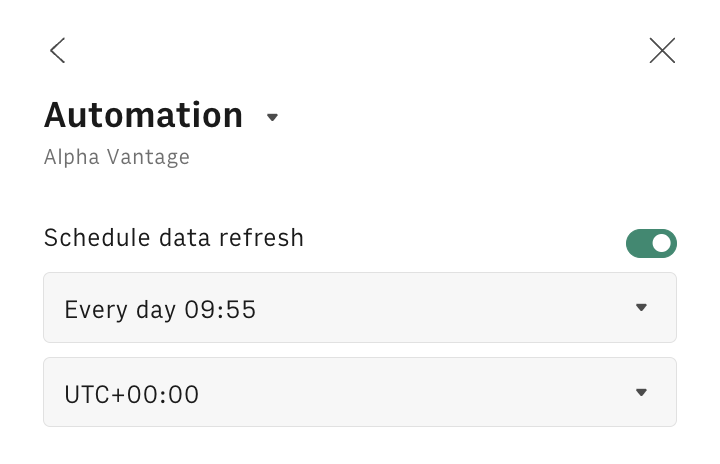
Plus, with Rows you can automate refresh of these functions based on your preferred schedule so that your reports are always up to date without the need of re-executing the function.
Formula helper
Rows has a wizard that help you build the function in a simple way without writing complex syntaxes
Finance tracker templates
Compared to Google Sheets, Rows has templates for tracking finance-related data. Its Stock/crypto price tracker can help you track the price for US-listed stocks and cryptocurrencies.
All you need to do is — Type the stock, crypto or FX ticker in the tracker tables to have a quick overview of the main market stats, such as price, volume, high/low, bid/ask. In the 'Stock trend' you can see the last 10Y price trend.
We also have an investment portfolio tracker; with this template, you can manage your portfolio of stocks, ETFs and crypto with ease.
But just so you know, you can't get the best use of these templates without connecting to a data source. That's where the next feature helps you.
Data ingestion
AlphaVantage is only one of the 50+ data sources you can pull data from when using Rows. Rows lets you import live data from 50+ sources directly on the spreadsheet, refreshable at your preferred rate, such as:
Marketing: GA4, GSC, Facebook, Instagram, TikTok
Productivity software: OpenAI, Notion, Slack, Email, Translate
Datawarehouse: MySQL, BigQuery, PostgreSQL, Snowflake, Amazon Redshift
And many more.
See below an example of custom report import from GA4:
Plus, you have the possibility of creating custom connections via our HTTP functions: GET, POST, PUT, PATCH that makes the catalog of integrable tools virtually infinite
Whenever you have a Table generated through a data connection (i.e. GA4), you can schedule a refresh so that data gets updated every day/week/month based on your needs.
Your new AI Data Analyst
Extract from PDFs, import your business data, and analyze it using plain language.
Try Rows (no signup)Get Started with Rows — More Advantages with Alpha Vantage feature
With Rows, you get to do more with less work using the Alpha Vantage Integration. The sweetest part is that you can easily integrate data from any source into your spreadsheets and manipulate as you want.
Ready to get started with Rows.com? Start using the product right away for free.