
Google Search Console Blog Traffic Report
Investigate your blog traffic by looking into top performing pages and keywords, average position over time and tracking other blog metrics relevant to your SEO strategy.

 100% spreadsheet
 Connected to your data
 Daily+ refresh
 Embed everywhere
About Google Search Console Blog Traffic Report
Despite playing a big role in engaging with current and potential users, content marketing must be paired with accurate analytics to deploy its full potential.
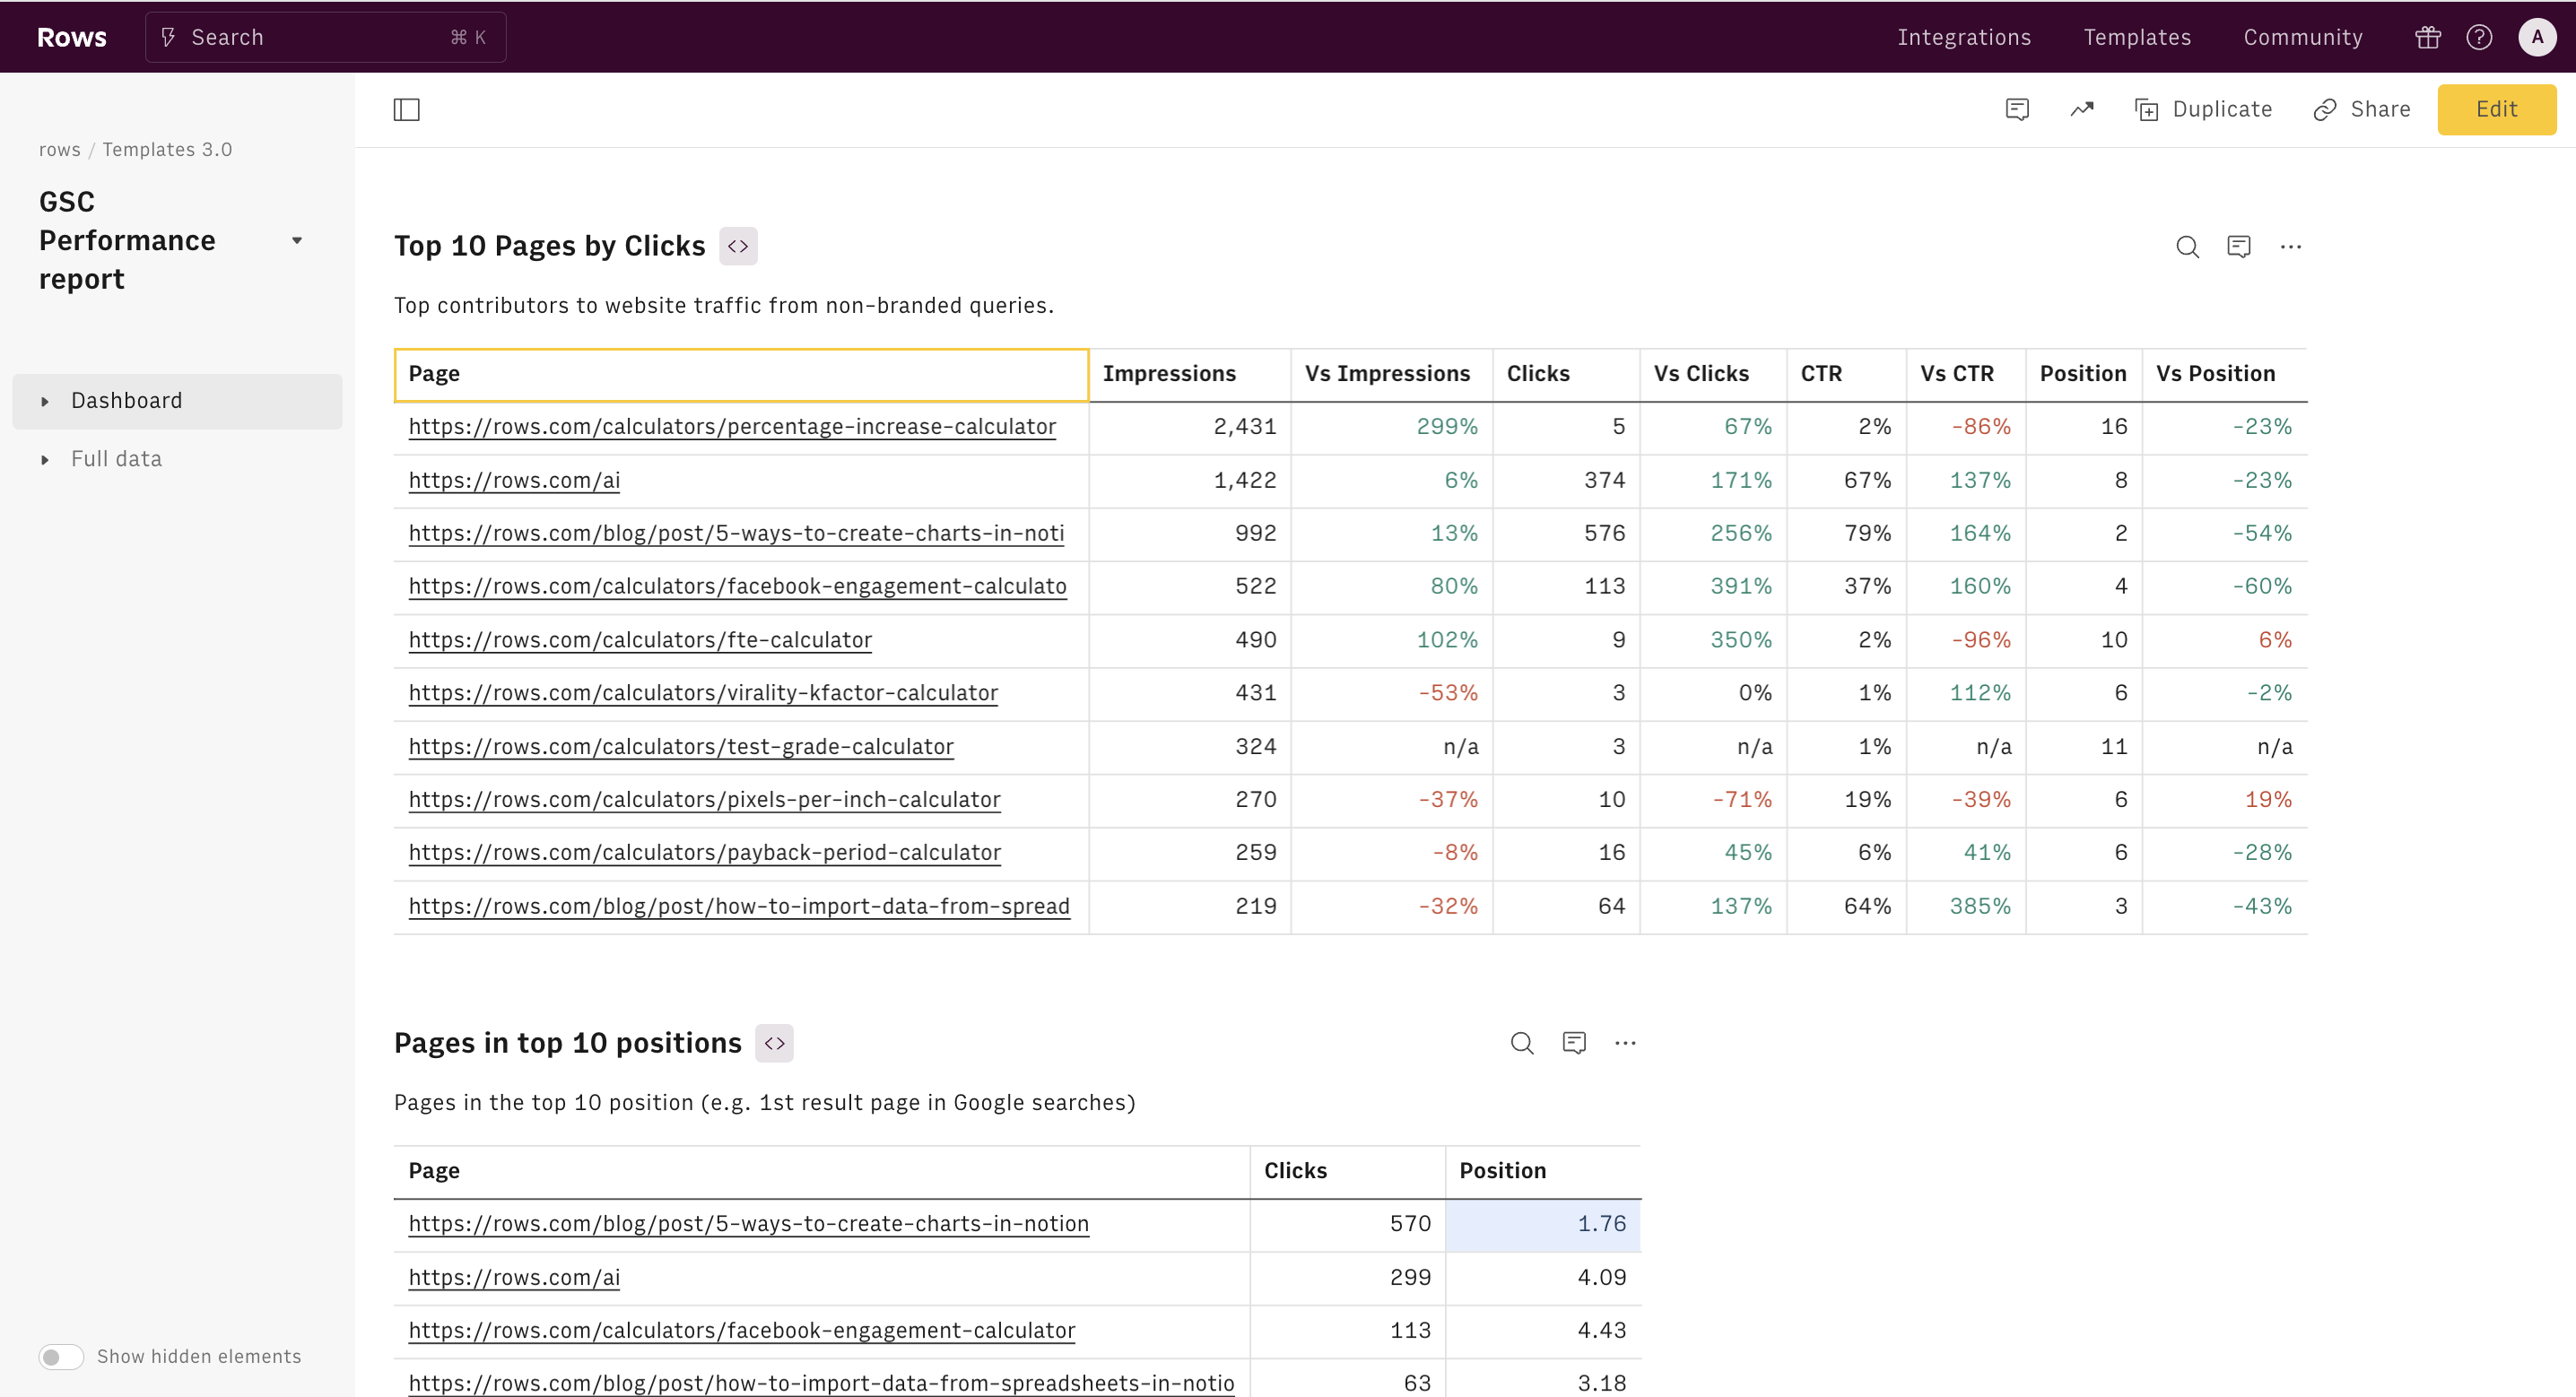
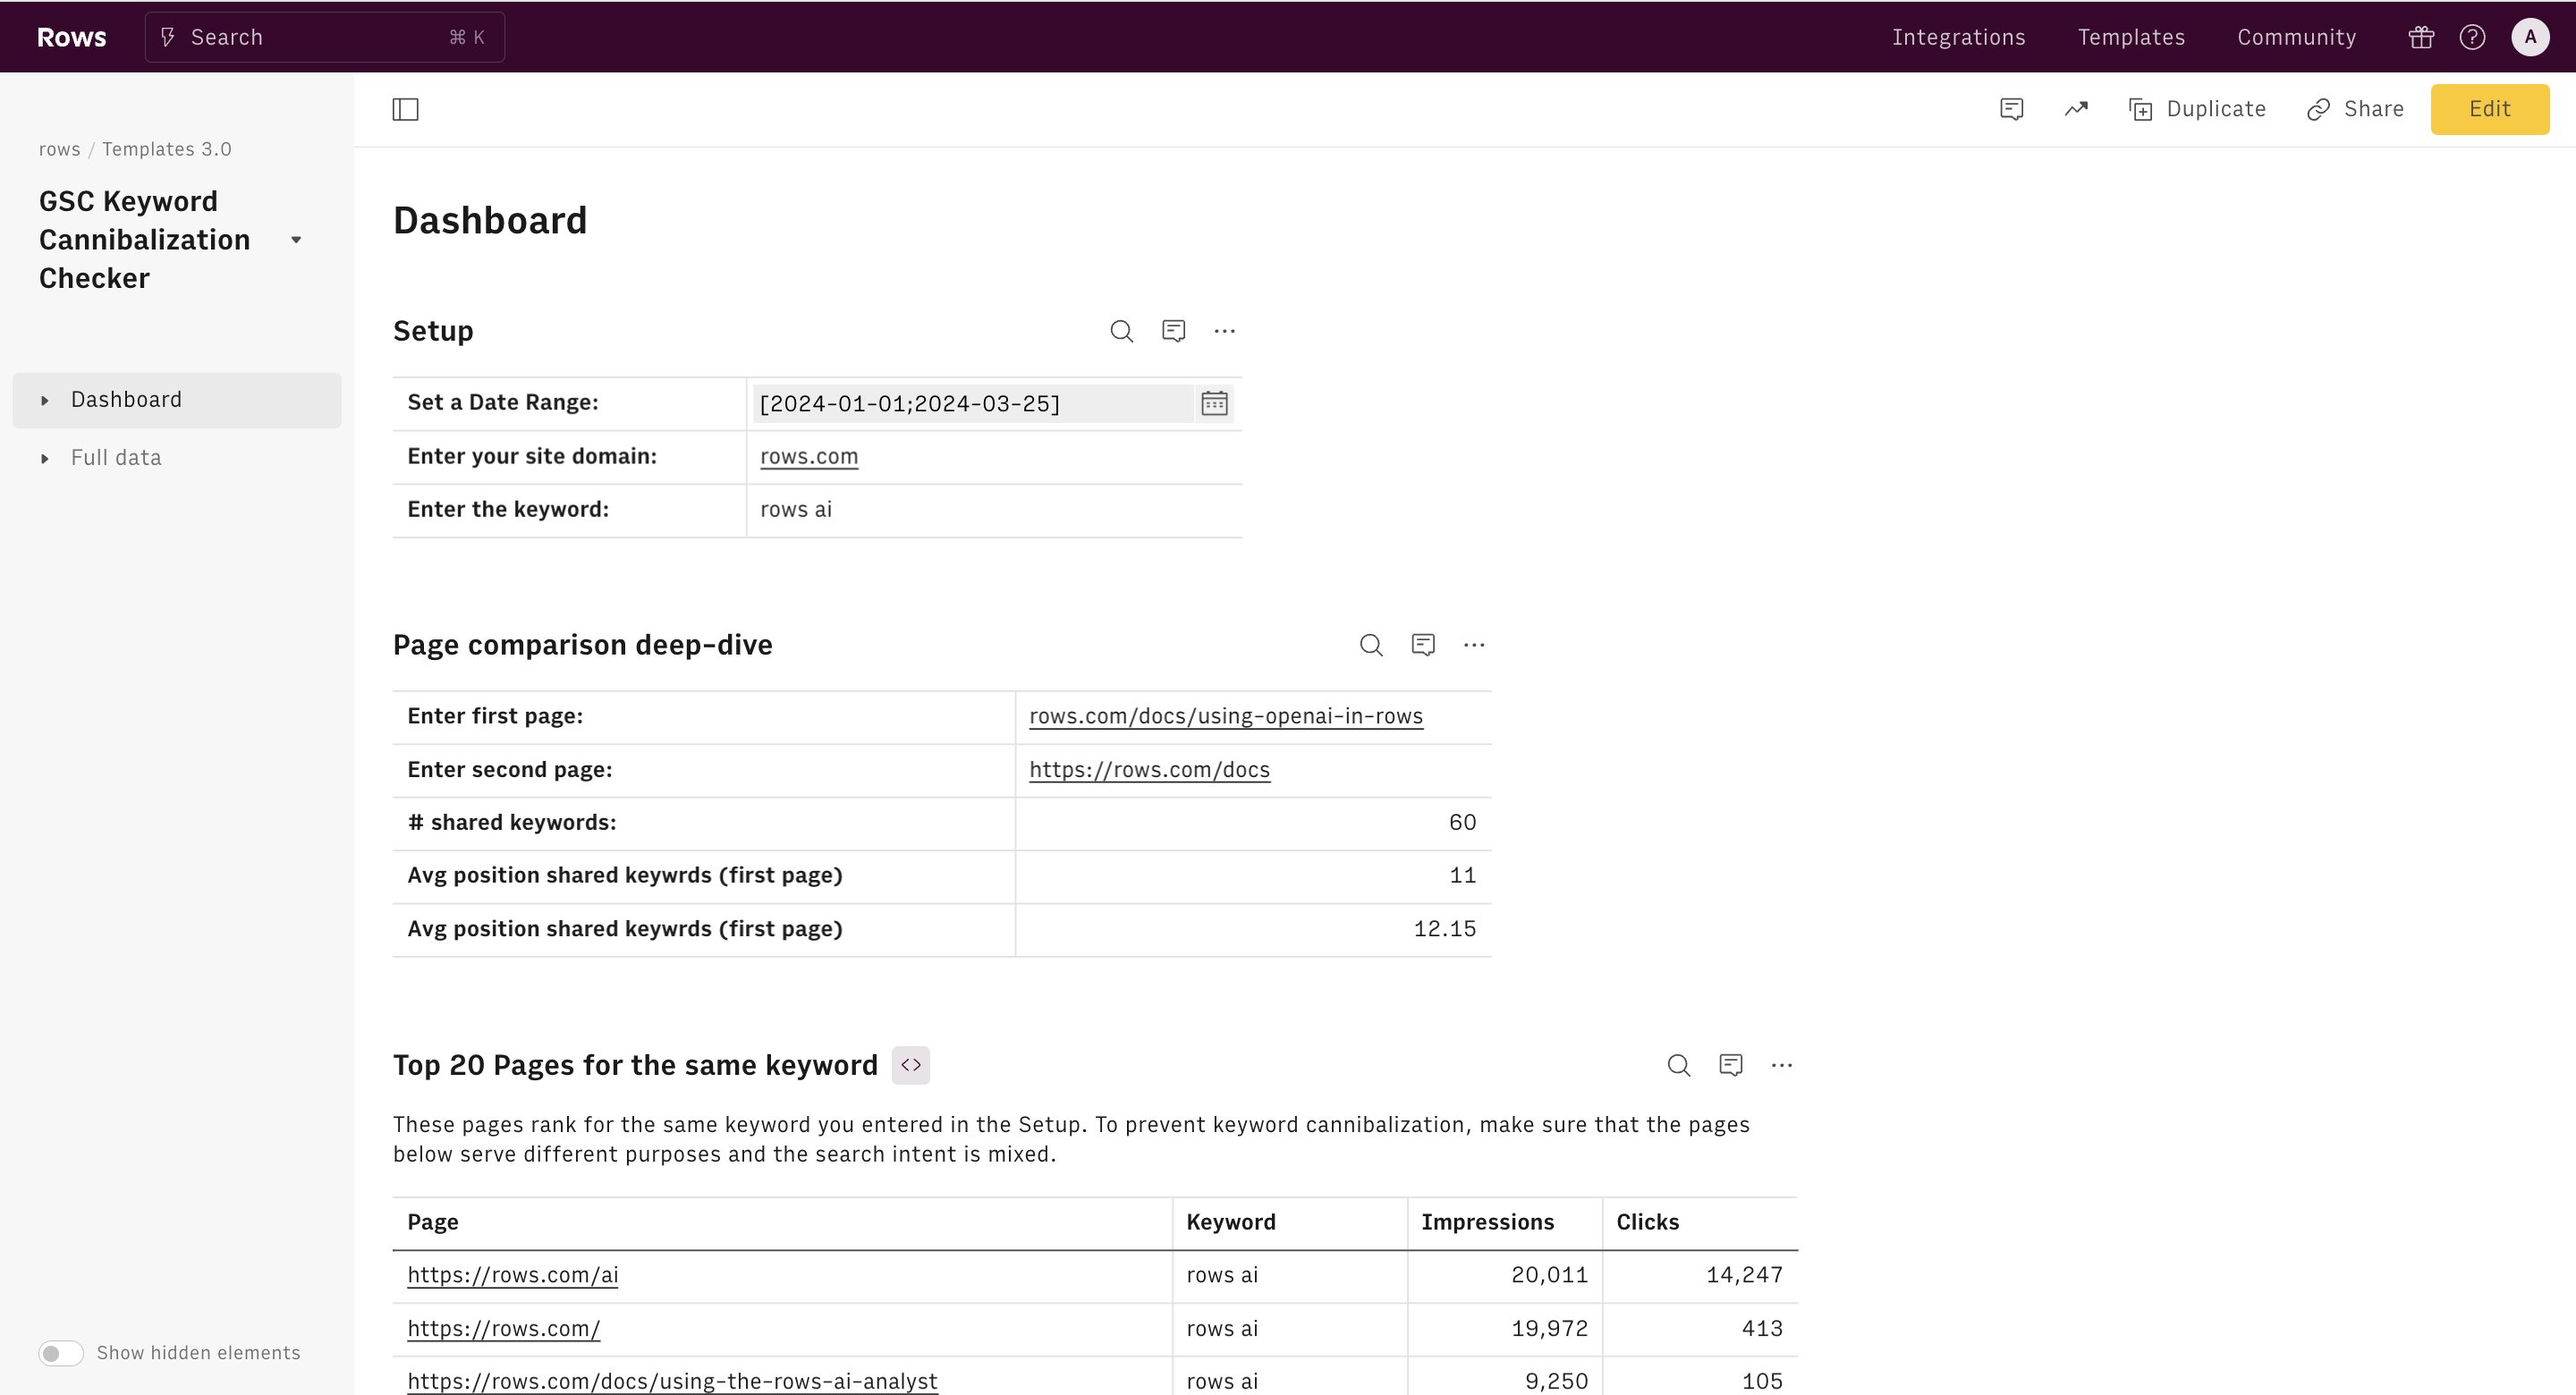
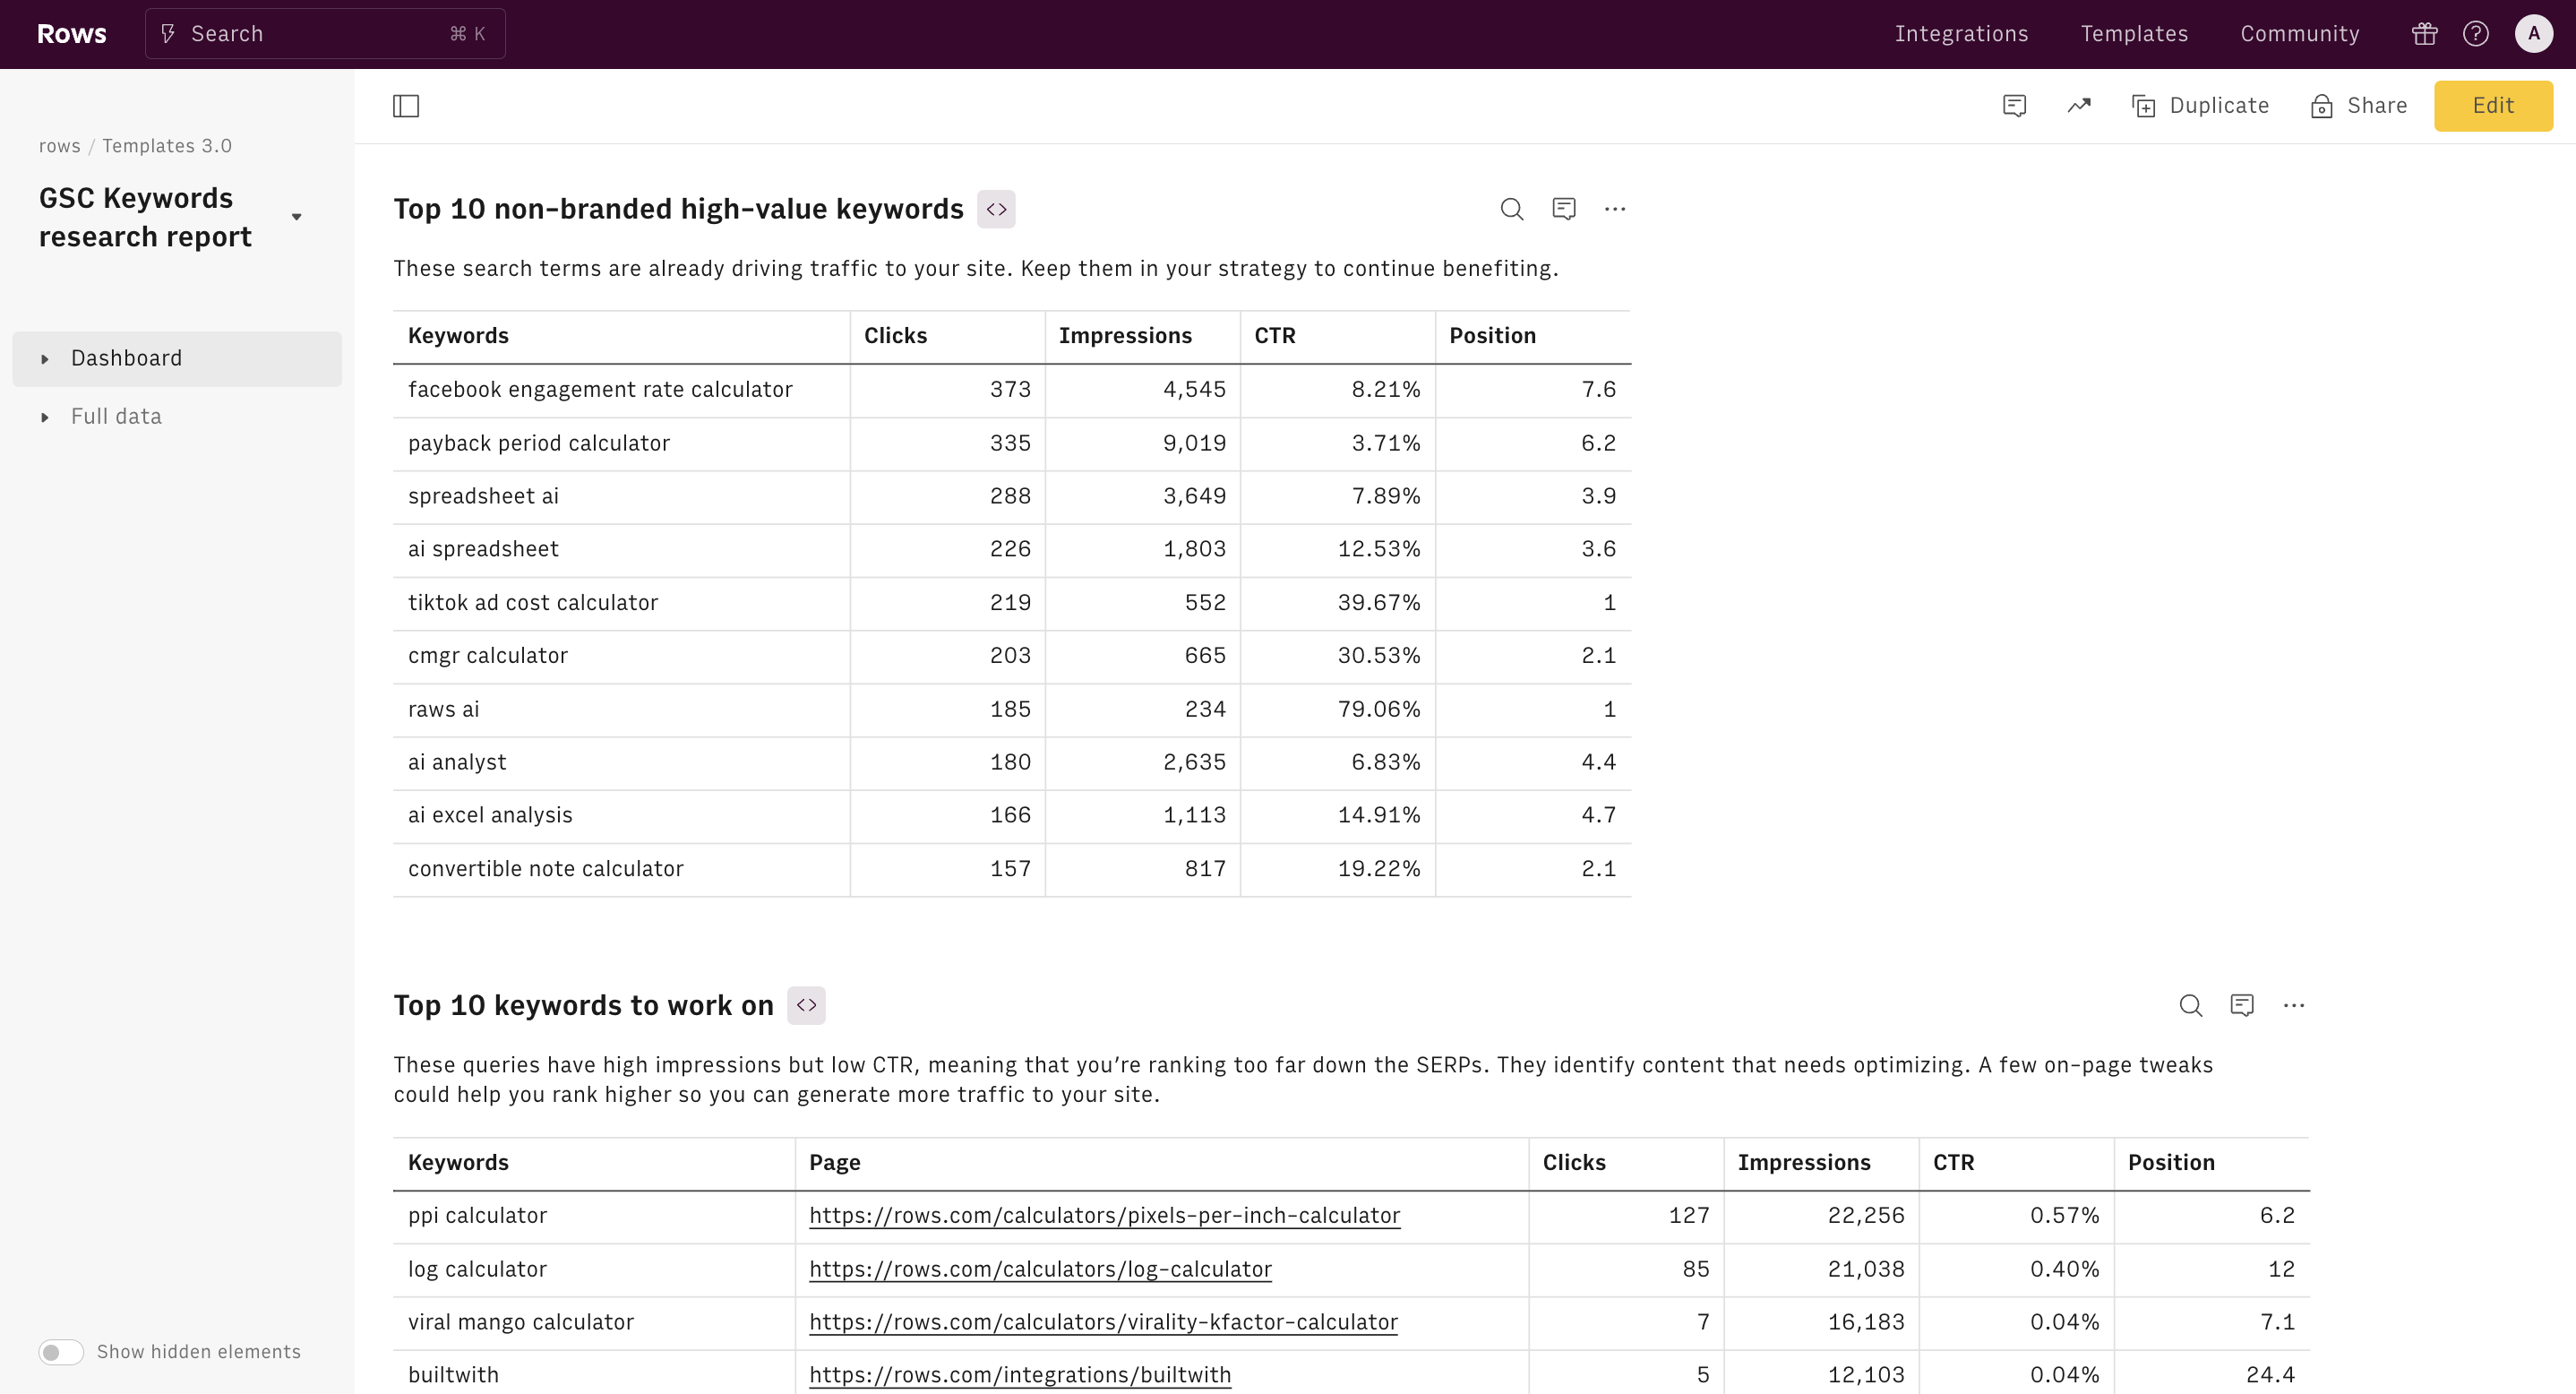
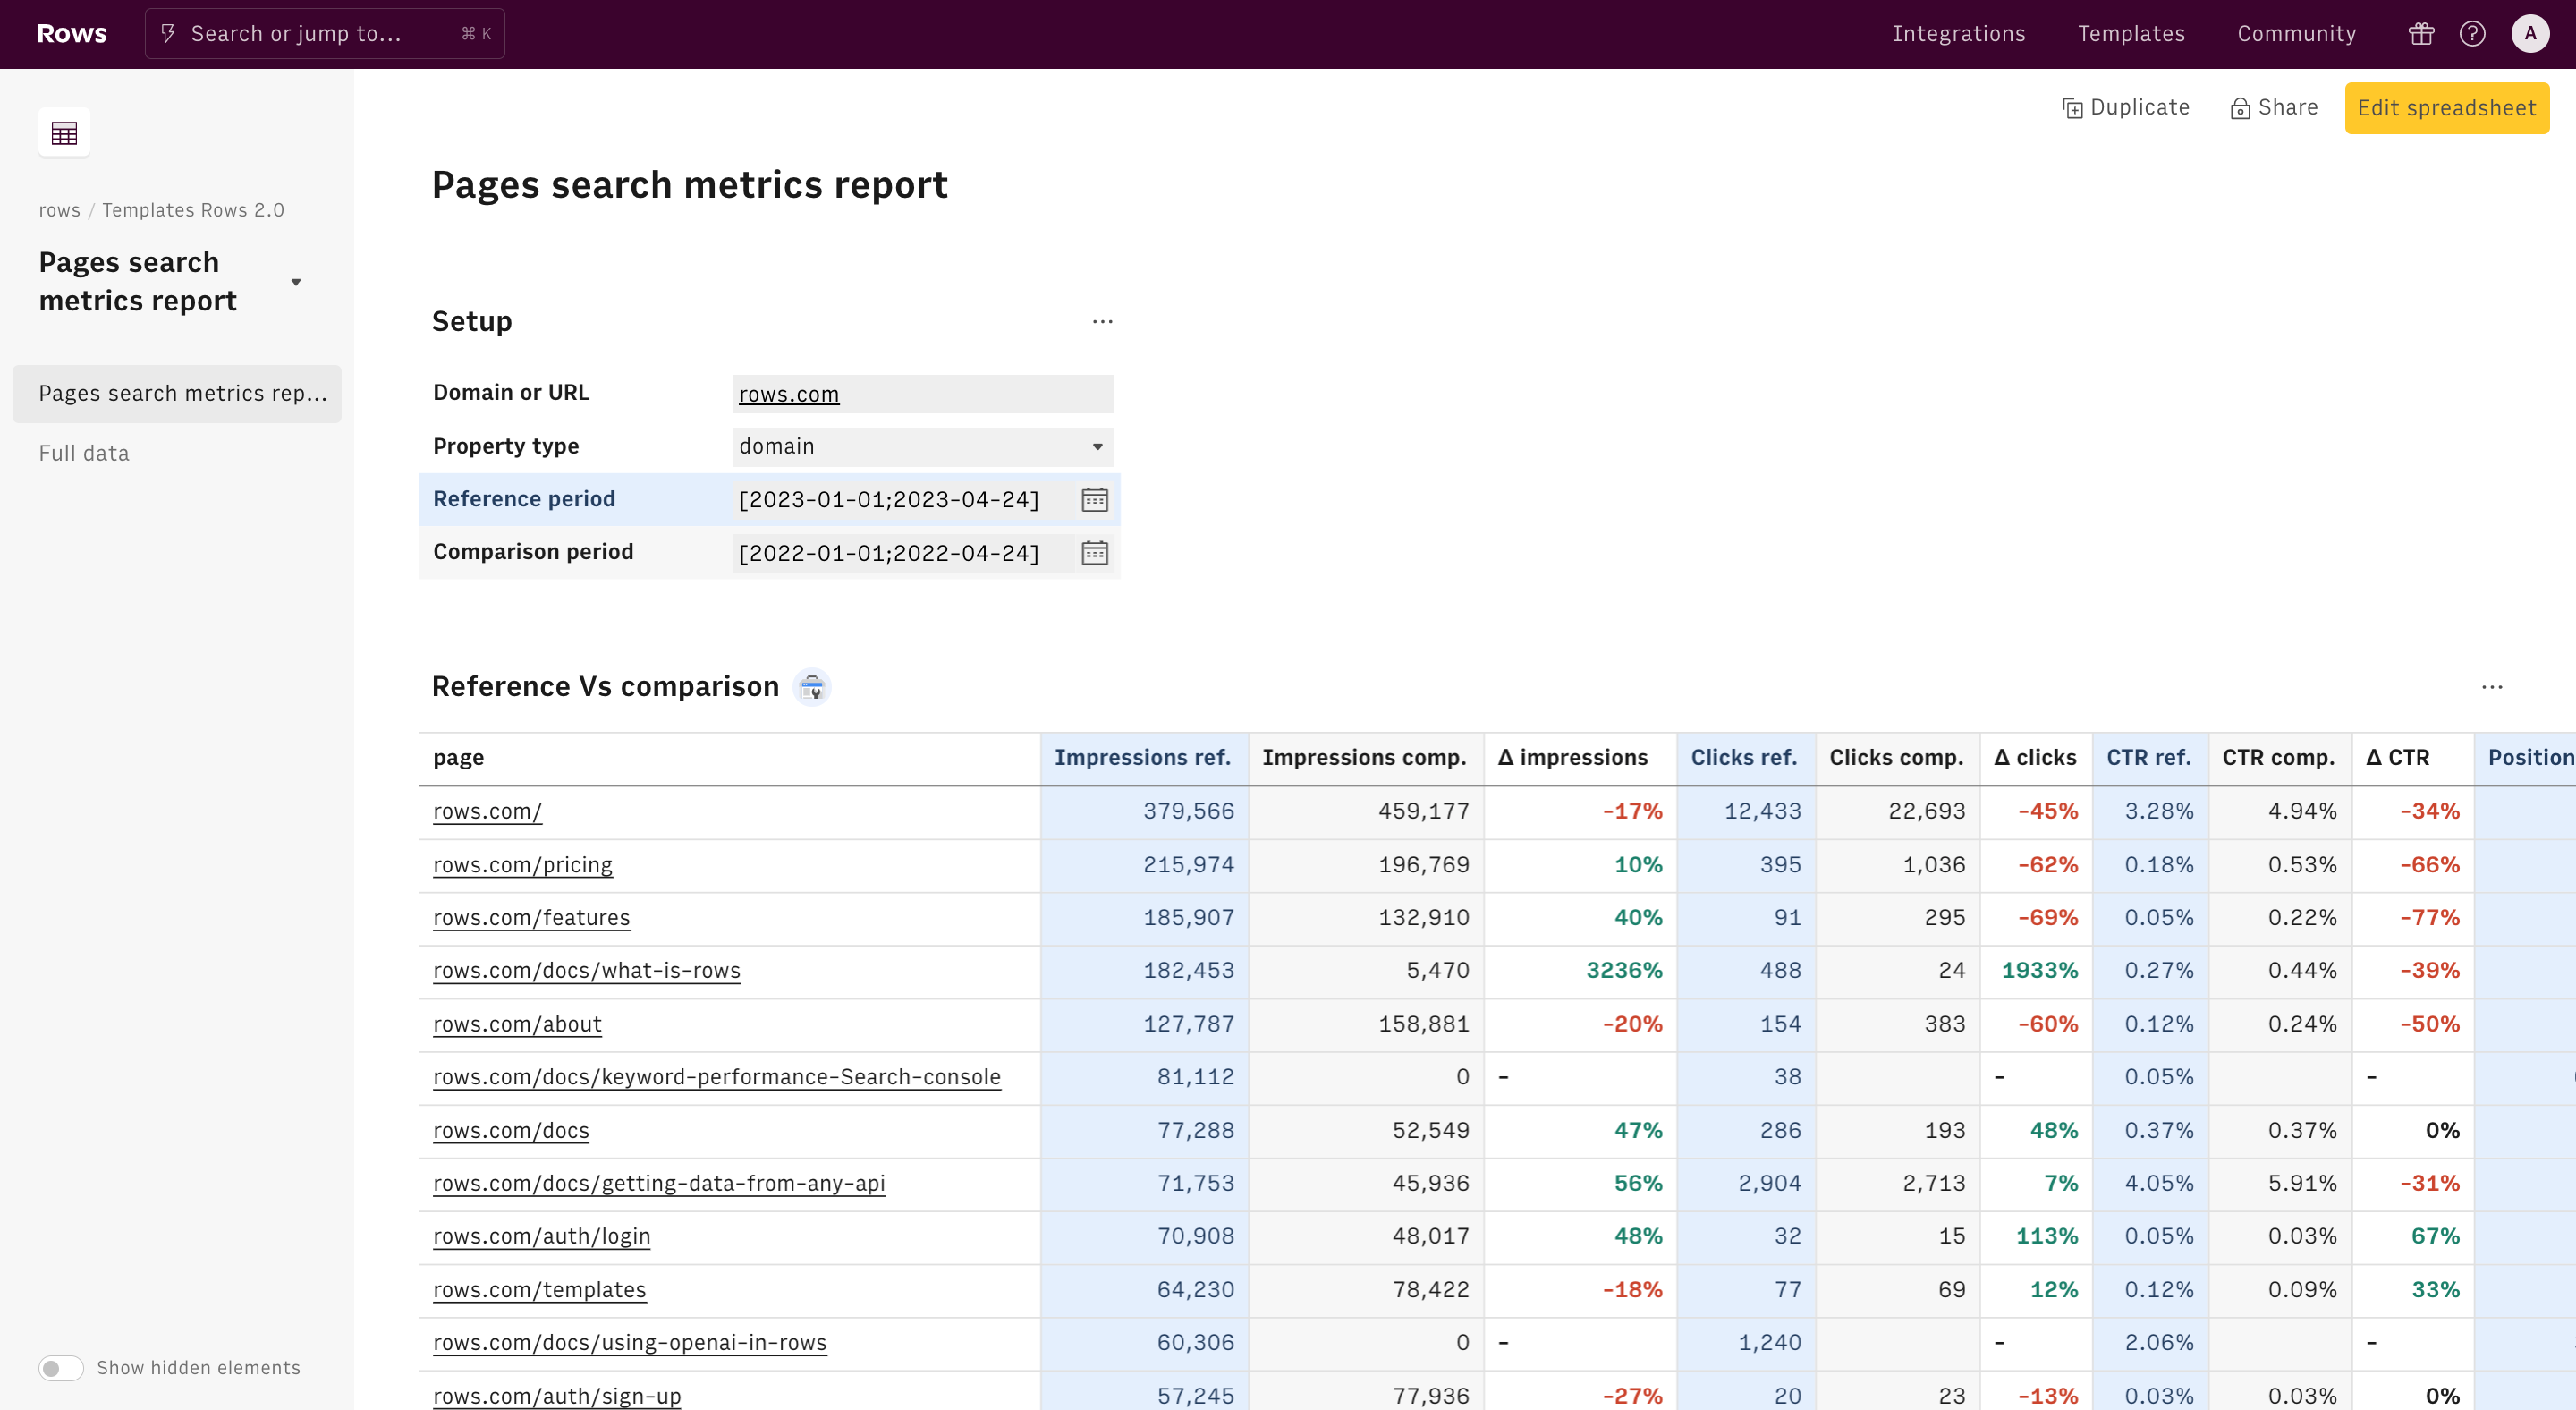
Leveraging the power of Google Search Console, this template allows you to get search insights about your blog posting activity: from impressions, to clicks and average SERP position.
- Once your integration has been enabled, fill the 'Setup' table by inputting your domain, choosing the date range you want to examine and the corresponding account Id
- List the URLs in the table below, and let the magic happen! All main KPIs of your blog posts will be retrieved automatically.
How it works

How it works
Get started
Click on 'Use template' and start using it right away. No forms, no signup. Your data first.
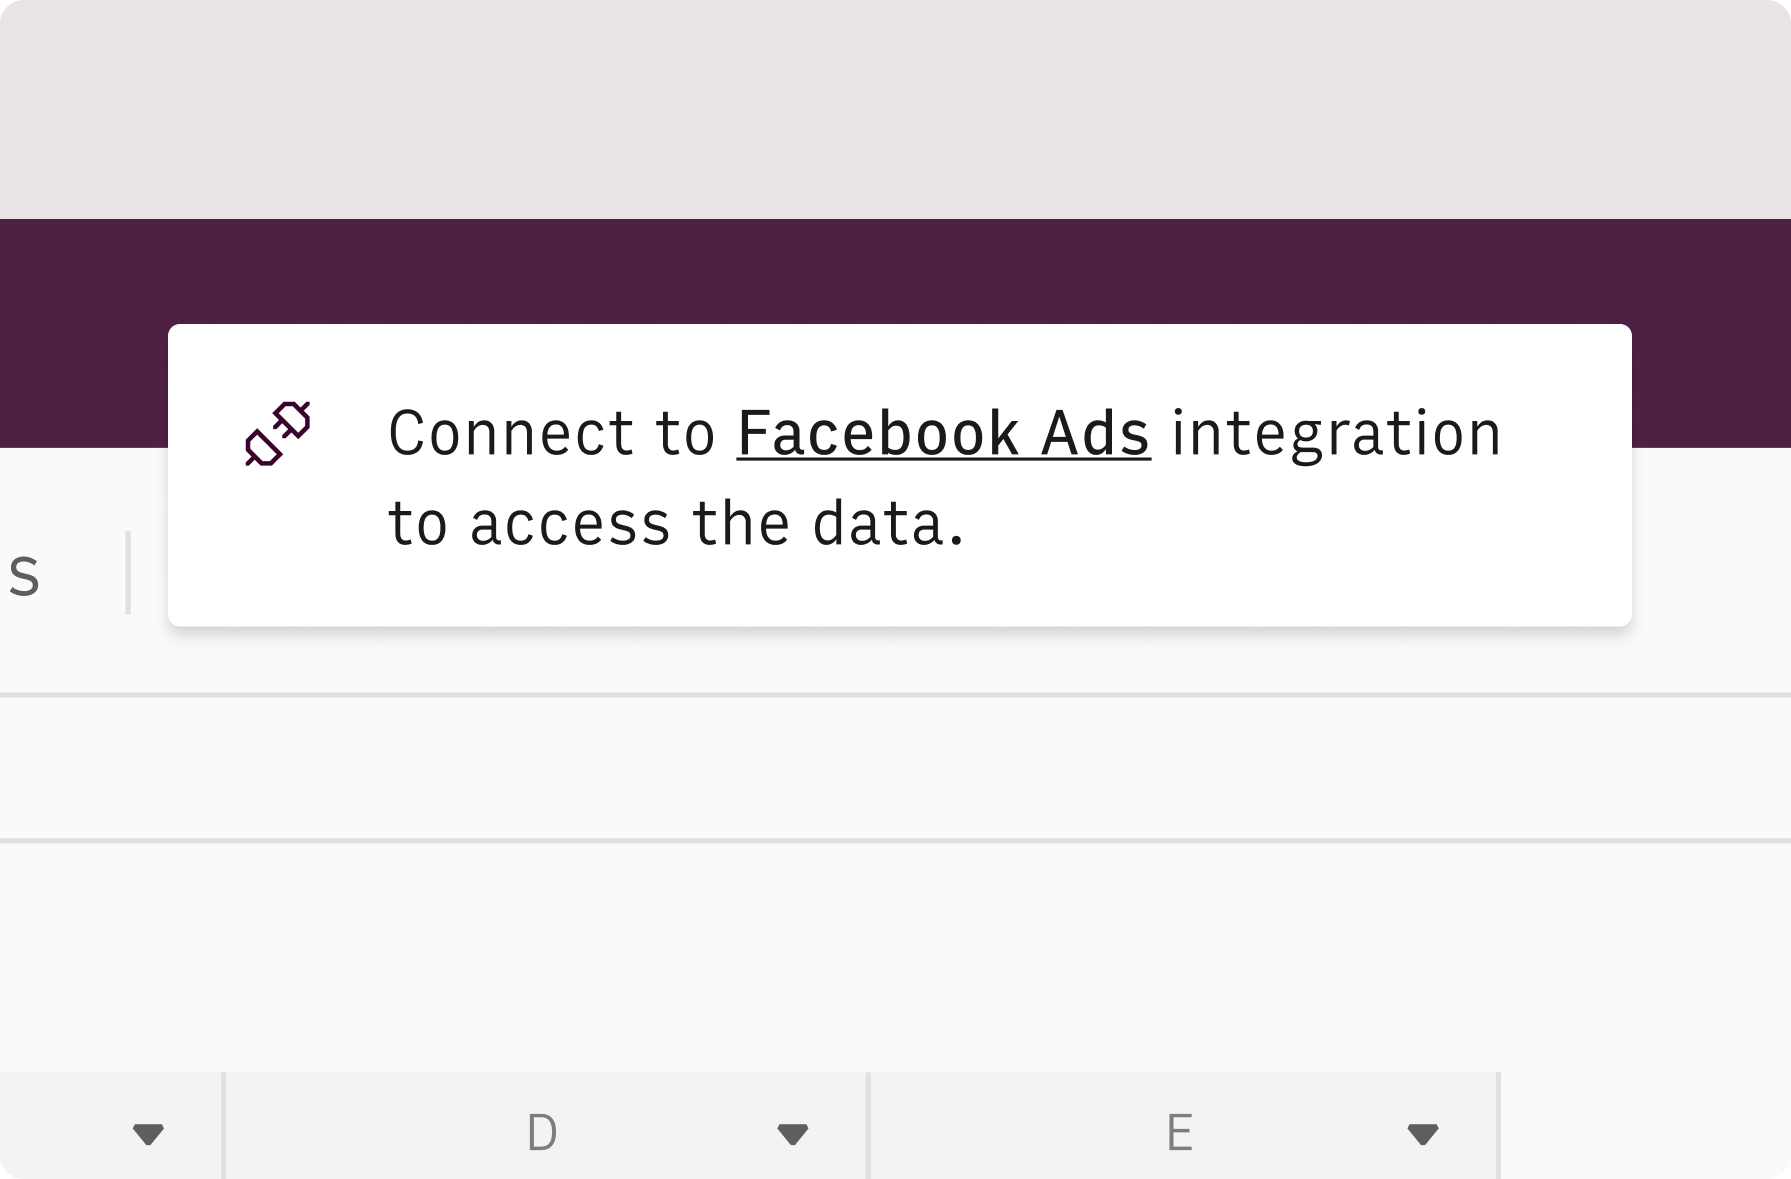
Connect your Google Search Console account
Once landed on the spreadsheet, follow the instructions to connect the required integration and pick your account.
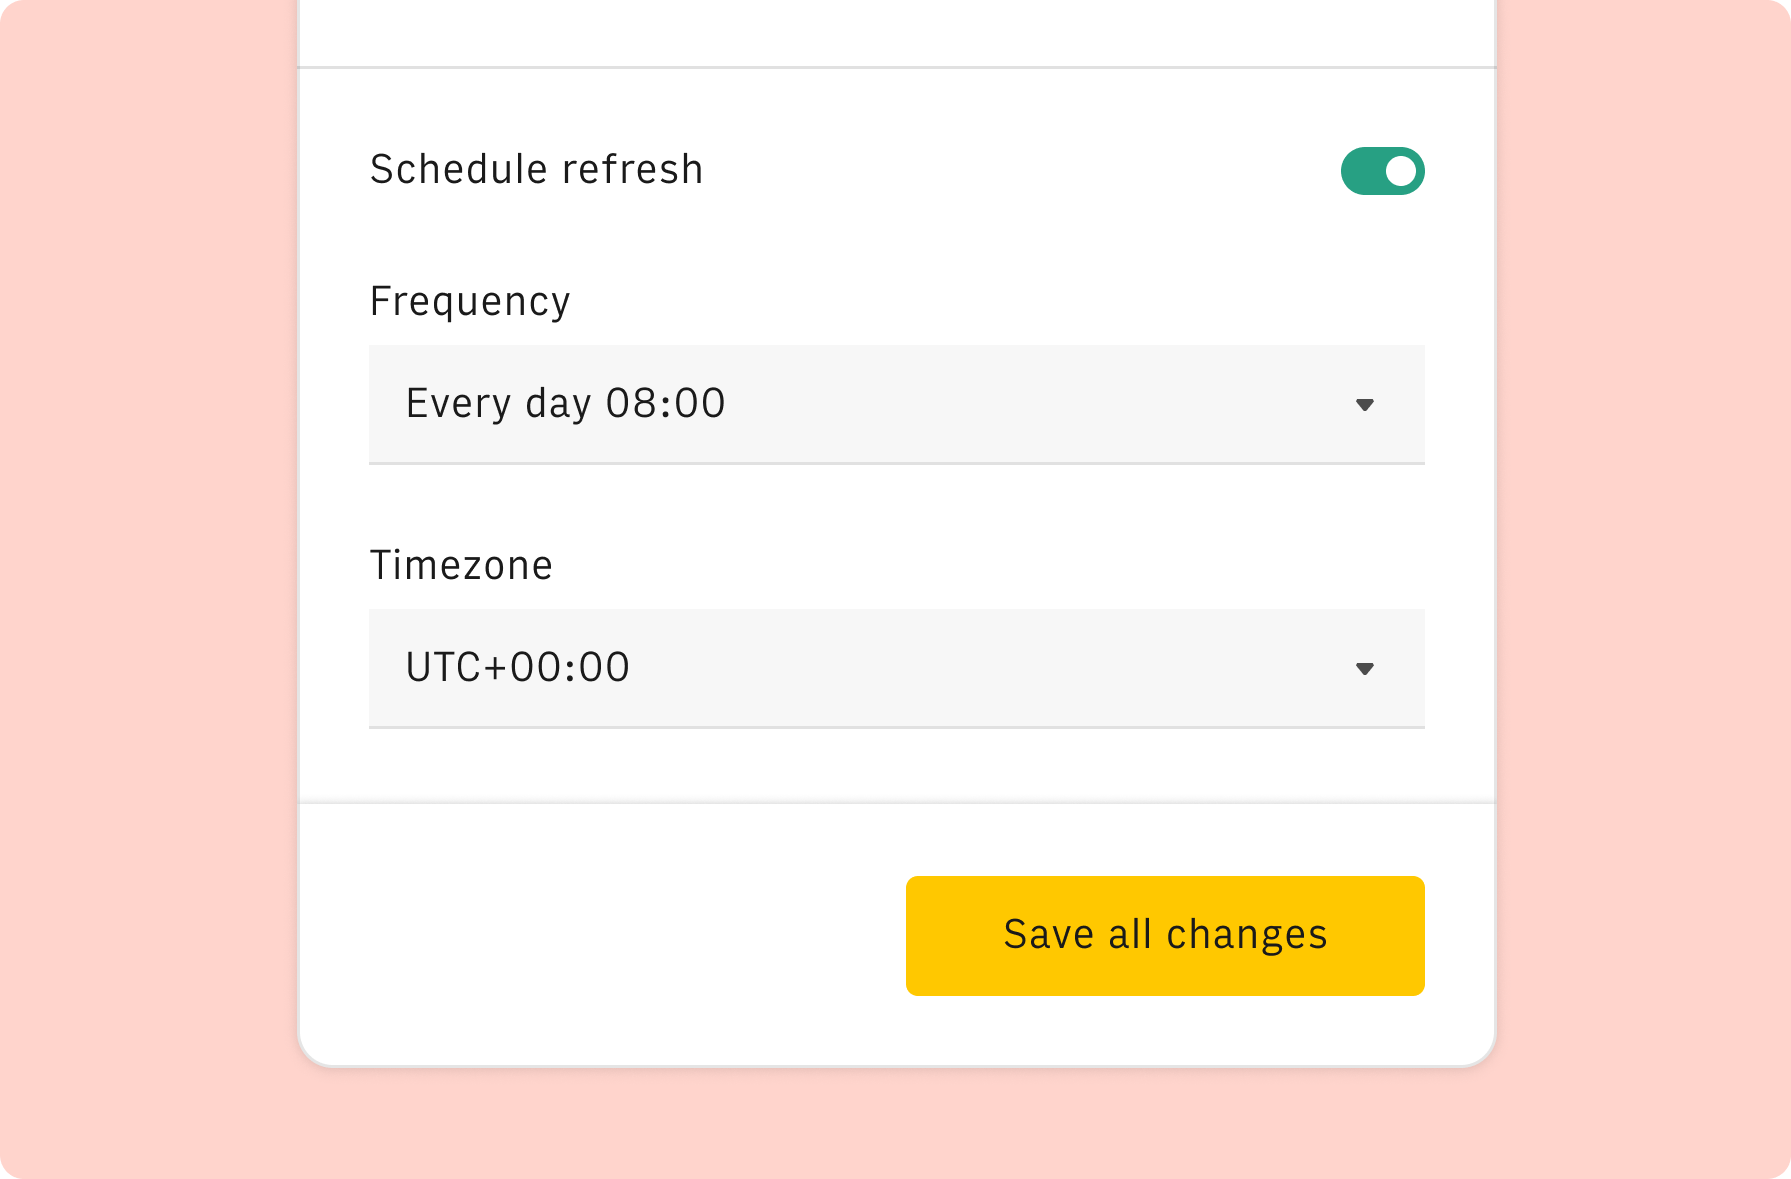
Customize the template and schedule refresh
Once the integration has been connected, all tables will update automatically with your own data. Click on 'Edit Source' to change the retrieved data and automate the data refresh. You can then insert a chart or a pivot table, add a column or personalize formats, using all the regular functions and shortcuts that make spreadsheets great.
Embed tables and charts
Click on the option menu to embed tables and chart on your Notion, Confluence or any other iframe-ready documents.


Questions and answers
Can I use Rows for free?
More than a Google Search Console Blog Traffic Report
Rows is the easiest way to import, transform and share data in a spreadsheet.
Signup for free
Import data from anywhere
Unleash data versatility: Import from files, marketing tools, databases, APIs, and connectors.
Know moreAnalyze with the power of AI
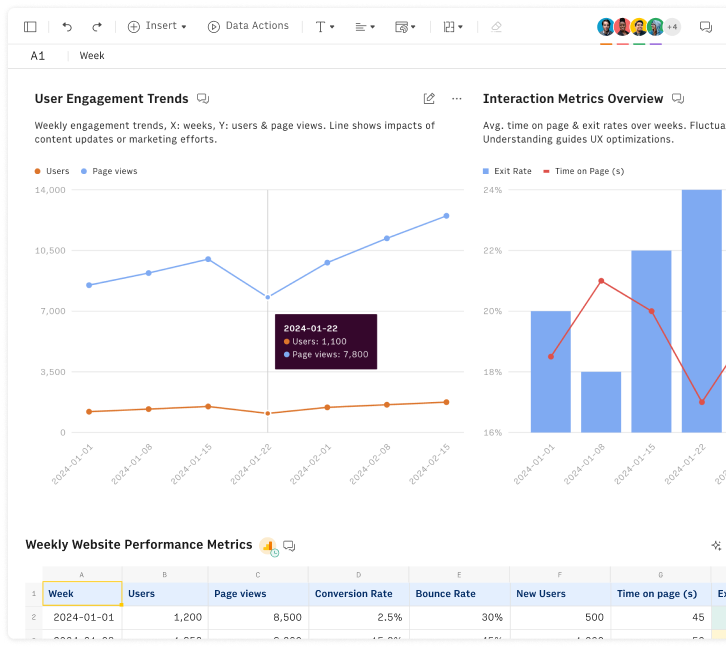
Unlock AI-powered analysis with 'AI Analyst': merge spreadsheet versatility, formatting, data tables, pivot tables, and smart filter/sort.
Know moreCollaborate and Share
Seamlessly collaborate and share stunning reports with dynamic charts, embed options, and easy export features.
Know more